Oocyte Retrieval Needles Market Size and Share Forecast Outlook (2023 to 2033)

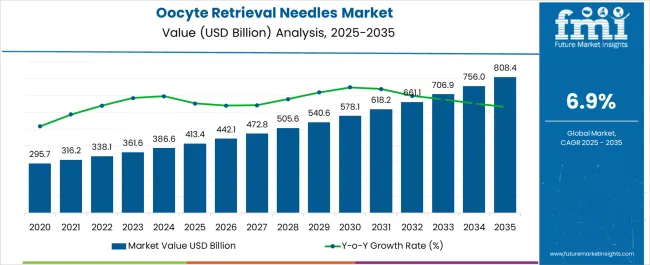
The oocyte retrieval needles market size is projected to be worth USD 359.1 million in 2023. The market is likely to surpass USD 724.6 million by 2033 at a CAGR of 7.3% during the forecast period.

The Oocyte retrieval needles market refers to the global market for medical devices specifically designed for the retrieval of oocytes (immature eggs) from the ovaries of women undergoing assisted reproductive technology (ART) procedures, such as in vitro fertilization (IVF) or intracytoplasmic sperm injection (ICSI). Oocyte retrieval is a crucial step in these procedures, where the eggs are collected from the ovaries using specialized needles.

Other Drivers Propelling the Demand for Oocyte Retrieval Needles include:

  • The need for ART techniques including in vitro fertilization (IVF) and the increased prevalence of infertility have both considerably fueled the rise of the oocyte retrieval needles market. The demand for these needles has increased as more couples seek out fertility treatments, which is a crucial phase in the IVF process called oocyte retrieval.
  • The market for oocyte retrieval needles has seen technological advancements made to increase the effectiveness and security of the retrieval process. The development of needles with characteristics including thinner diameters, improved visibility under ultrasound guidance, and enhanced design for simpler penetration and tissue manipulation is the main goal of manufacturers.
  • In many areas, rising healthcare costs and disposable money have made it possible for individuals and couples to afford pricey fertility therapies like IVF. Financial resources are more widely accessible, which has raised demand for reproductive services and increased use of oocyte retrieval needles.

Challenges for Companies /Manufacturers in the Oocyte Retrieval Needles Market:

  • It can be expensive to receive fertility treatments, particularly IVF procedures that need oocyte retrieval. These treatments can be difficult for people and couples with minimal resources to receive because of their high cost. The price of oocyte retrieval needles and related fertility treatments may discourage some individuals from seeking therapy, which may have an effect on market growth.
  • Oocyte retrieval procedures require knowledge and specialized training to perform. In some areas, it may be difficult to find qualified medical personnel with experience in oocyte retrieval procedures, such as reproductive endocrinologists and embryologists. The adoption and use of oocyte retrieval needles may be hampered, and this could have an adverse effect on the market's expansion.
  • For oocyte retrieval methods, there is a lack of standardized protocols and standards, including variability in stimulation regimens, needle diameters, and techniques employed. The lack of standardized procedures might lead to inconsistent results, making it difficult to compare findings across various research and clinics.

Opportunities in the Oocyte Retrieval Needles Industry:

  • The demand for oocyte retrieval operations is being driven by the rising prevalence of infertility as well as rising awareness and acceptance of ART. The need for oocyte retrieval needles is predicted to rise as more people and couples turn to these procedures. Manufacturers now have the chance to meet the growing demand and meet the requirements of the expanding patient population.
  • Working together with fertility clinics and research organizations can promote innovation and expand the market. Manufacturers can participate in clinical trials, learn useful insights from industry leaders, and advance the creation of innovative methods and technologies by collaborating with them.

Latest Trends in the Oocyte Retrieval Needles Market:

  • Adoption of single-use, disposable oocyte retrieval needles has been on the rise. With the use of these needles, there is no longer a chance of infection or cross-contamination. The emphasis placed in reproductive clinics on patient safety and infection control measures is what has sparked the trend towards single-use disposable needles.
  • In the market for oocyte retrieval needles, the relevance of needle safety characteristics has increased. Manufacturers have included safety features like retractable needles and needle guards to reduce the possibility of healthcare workers suffering needle stick injuries.
Attributes Details
Oocyte Retrieval Needles Market Size (2023) USD 359.1 million
Oocyte Retrieval Needles Market Projected Size (2033) USD 724.6 million
Value CAGR (2023 to 2033) 6.7%

Oocyte Retrieval Needles Market Sales Analysis (2017 to 2022) and Forecast Outlook (2023 to 2033)

From 2017 to 2022, the global oocyte retrieval needles market experienced a CAGR of 6.0%, reaching a market size of USD 359.1 million in 2023.

From 2017 to 2022, The market for oocyte retrieval needles has been steadily expanding as a result of developments in assisted reproductive technology (ART) and rising interest in infertility therapies.

Oocyte retrieval needles are made specifically for the removal of oocytes (eggs) during intracytoplasmic sperm injection (ICSI) or in vitro fertilization (IVF). They are commonly utilized in assisted reproduction facilities and play a critical part in fertility treatments.

Future Forecast for Oocyte Retrieval Needles Industry:

Looking ahead, the global oocyte retrieval needles industry is expected to rise at a CAGR of 7.3% from 2023 to 2033. During the forecast period, the market size is expected to reach USD 724.6 million by 2033.

The oocyte retrieval needles industry is expected to continue its growth trajectory from 2023 to 2033, Due to reasons like changing lifestyles, postponed pregnancies, and environmental variables, the prevalence of infertility is predicted to keep increasing globally. In the upcoming years, this is probably going to increase demand for oocyte retrieval needles.

The demand for oocyte retrieval needles is anticipated to rise as more people and couples choose fertility procedures like IVF and ICSI. This demand may be influenced by variables like shifting societal standards, more awareness, and easier access to fertility clinics.
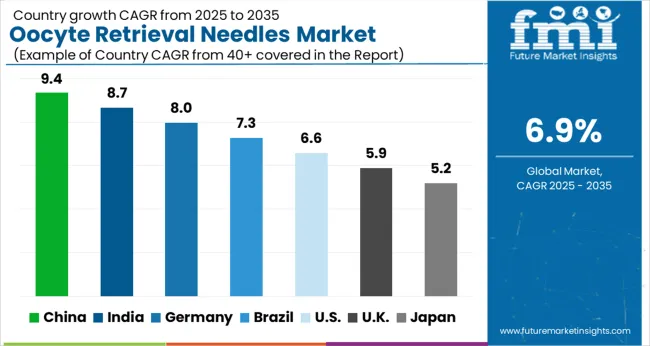
Analysis of Leading Countries in the Oocyte Retrieval Needles Market

Oocyte Retrieval Needles Market to Surge in the United States Due to Rising Number of Infertility Rates.

Country The United States
Market Size (USD million) by End of Forecast Period (2033) USD 239.3 million
CAGR % 2023 to End of Forecast (2033) 7.8%

The oocyte retrieval needles industry in the United States is expected to reach a market size of USD 239.3 million by 2033, expanding at a CAGR of 7.8%. The number of infertile couples in the US has been gradually increasing.

The rising need for reproductive procedures like IVF and ICSI is influenced by variables like postponed pregnancies, lifestyle changes, and environmental factors. Oocyte retrieval needle demand is consequently increased as a result.

Rising Fertility Treatments to Propel the United Kingdom Market Growth

Country The United Kingdom
Market Size (USD million) by End of Forecast Period (2033) USD 42.2 million
CAGR % 2023 to End of Forecast (2033) 8.0%

The oocyte retrieval needles industry in the United Kingdom is expected to reach a market share of USD 42.2 million, expanding at a CAGR of 8.0% during the forecast period. For those who meet the criteria, the National Health Service (NHS) in the UK offers access to fertility treatments.

The accessibility and affordability of these services are improved by the availability of NHS-funded fertility treatments, including oocyte retrieval operations. This helps the UK market for oocyte retrieval needles to expand.

Notable Growth Expected in China's Oocyte Retrieval Needles Market as Governments Supportive Measures

Country China
Market Size (USD million) by End of Forecast Period (2033) USD 53.6 million
CAGR % 2023 to End of Forecast (2033) 7.6%

The oocyte retrieval needles industry in China is anticipated to reach a market size of USD 53.6 million, moving at a CAGR of 7.6% during the forecast period. To address the issue of infertility and advance assisted reproductive technologies, the Chinese government has put supportive regulations and programs in place.

These include actions like easing the restrictions on family planning, enhancing the infrastructure for healthcare, and funding fertility treatments. Such government assistance promotes the market expansion for oocyte retrieval needles.
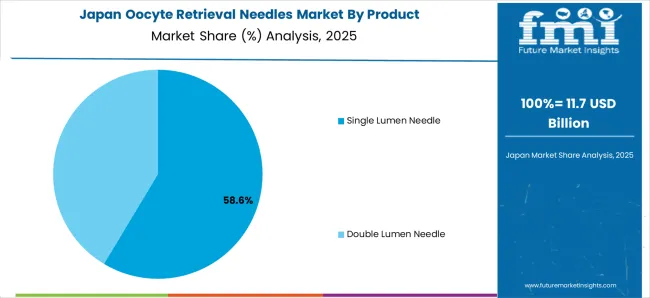
Due to Well Developed Healthcare Infrastructure Drive Market Growth in Japan

Country Japan
Market Size (USD million) by End of Forecast Period (2033) USD 39.3 million
CAGR % 2023 to End of Forecast (2033) 7.5%

The oocyte retrieval needles industry in Japan is estimated to reach a market size of USD 39.3 million by 2033, thriving at a CAGR of 7.5%. The healthcare system in Japan is well developed and includes assisted reproduction facilities and specialized fertility clinics.

These facilities have cutting-edge technology and a high rate of adoption of cutting-edge oocyte retrieval needle designs. The presence of cutting-edge healthcare infrastructure facilitates market expansion.

Demand for Oocyte Retrieval Needles is Rising Due to Increased Medical Tourism

Country South Korea
Market Size (USD million) by End of Forecast Period (2033) USD 29.1 million
CAGR % 2023 to End of Forecast (2033) 7.2%

The oocyte retrieval needles industry in South Korea is expected to reach a market size of USD 29.1 million, expanding at a CAGR of 7.2% during the forecast period. In terms of medical tourism, South Korea has become a well-liked location for fertility procedures.

International patients seeking fertility treatments are drawn to the nation because of its reputation for providing high-quality healthcare services, cutting-edge technologies, and skilled healthcare experts. As a result, the market for oocyte retrieval needles is expanding.

Oocyte Retrieval Needles Market Analysis by Top Investment Segments

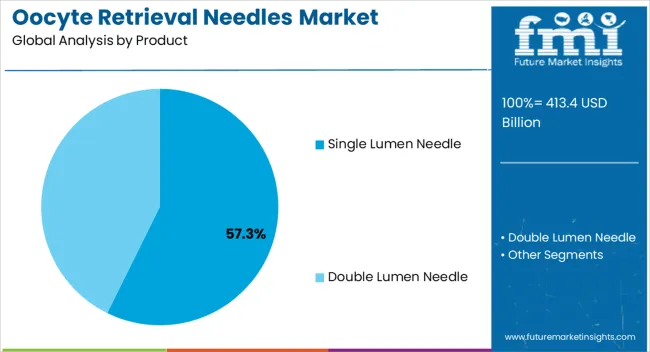
Single Lumen Needle to Dominate Oocyte Retrieval Needles Industry with 7.6% CAGR through 2033

The Single Lumen Needle is expected to dominate the oocyte retrieval needles industry with a CAGR of 7.6% from 2023 to 2033. This segment captures a significant market share in 2023, in order to lower the possibility of contamination and infection during oocyte retrieval techniques, single lumen needles were developed.

They reduce the possibility of cross-contamination between the needle and the surrounding area by only having one hole or lumen. Their greater use in clinical settings due to their enhanced safety profile is what is causing the market to rise overall.

Which End User is Widely Adopted the Oocyte Retrieval Needles?

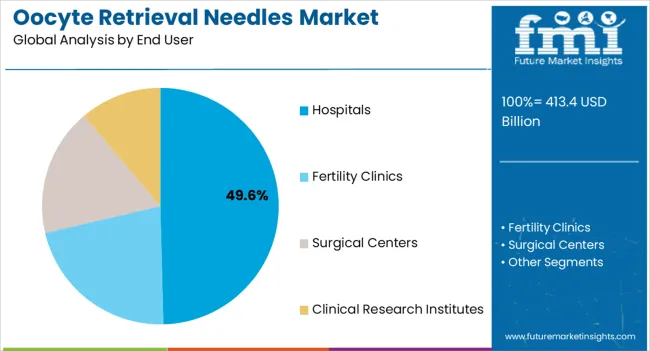
The Fertility Clinics segment is expected to dominate the oocyte retrieval needles industry with a CAGR of 7.5% from 2023 to 2033. Oocyte retrieval needles are in high demand since fertility clinics are the main providers of assisted reproductive technologies (ART), such as IVF and ICSI.

Oocyte retrieval is a crucial step in these treatments, which these facilities provide to individuals and couples struggling with infertility. The demand for oocyte retrieval needles is directly impacted by the expansion of fertility clinics and the growing number of patients they serve.
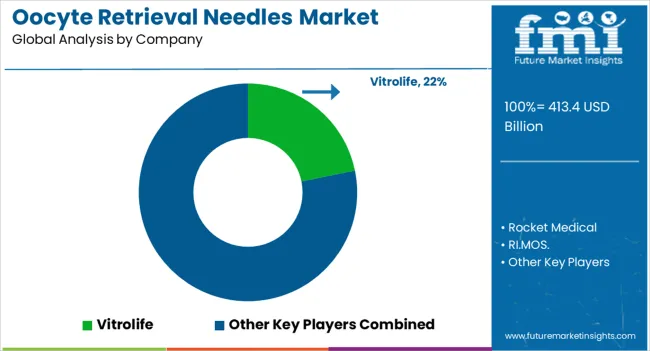
Competitive Landscape of the Oocyte Retrieval Needles Market

The oocyte retrieval needles sector is fiercely competitive, with many companies fighting for market dominance. To stay ahead of the competition in such a circumstance, essential players must employ smart techniques.

Key Strategies Used by the Participants

Product Development

To develop innovative goods that increase efficacy, dependability, and cost-effectiveness, businesses make significant investments in research and development. Product innovation allows companies to stand out from the competition while also meeting the shifting needs of their customers.

Strategic Alliances & Collaborations

Strategic relationships and alliances with other businesses are regularly formed by major players in an industry to take advantage of each other's advantages and expand their market reach. Through such partnerships, businesses may also obtain access to novel innovations and markets.

Expansion into Emerging Markets

The market for oocyte retrieval needles is rising quickly in developing nations. To strengthen their presence in these regions, key companies are expanding their distribution networks and building local manufacturing sites.

Acquisitions and mergers

Leading companies in the oocyte retrieval needles industry frequently use mergers and acquisitions to consolidate their market positions, broaden their product offerings, and enter new markets.

Leading Oocyte Retrieval Needles Manufacturers by Market Share

  • Vitrolife
  • Rocket Medical
  • RI.MOS.
  • Gynetics Medical Products
  • Kitazato Corporation
  • Wallace™ (A CooperSurgical Company)
  • Gynemed Medizinprodukte GmbH & Co. KG
  • Rocket Medical plc
  • Biolife Italiana S.r.l.
  • ReproLine Medical Devices
  • Triumph Medical Supplies Co., Ltd.
  • CADMACH MACHINERY CO. PVT. LTD.
  • LifeGlobal Group LLC
  • Sage Media Ltd.
  • SRR Surgical Instruments
  • Tsunami Medical
  • CooperSurgical, Inc

Key Developments in the Oocyte Retrieval Needles Market:

  • In November 2021, CooperSurgical, Inc., purchased Generate Life Sciences® Company. Generate Life Sciences® is a privately held market-leading provider of sperms and donor eggs for fertility cryopreservation services, newborn stem cell storage (cord blood & tissue) and fertility treatments.

Top Segments Studied in the Oocyte Retrieval Needles Market Report

By Product:

  • Single Lumen Needle
  • Double Lumen Needle

By End User:

  • Hospitals
  • Fertility Clinics
  • Surgical Centers
  • Clinical Research Institutes

By Region:

  • North America
  • Latin America
  • Europe
  • East Asia
  • South Asia
  • Oceania
  • The Middle East & Africa

Table of Content

  • 1. Executive Summary
  • 2. Market Overview
  • 3. Key Market Trends
  • 4. Value Added Insights
  • 5. Market Background
  • 6. Global Market Demand (in Value or Size in USD Million) Analysis 2017 to 2022 and Forecast, 2023 to 2033
  • 7. Global Market Analysis 2017 to 2022 and Forecast 2023 to 2033, By Product
    • 7.1. Single Lumen Needle
    • 7.2. Double Lumen Needle
  • 8. Global Market Analysis 2017 to 2022 and Forecast 2023 to 2033, By End User
    • 8.1. Hospitals
    • 8.2. Fertility Clinics
    • 8.3. Surgical Centers
    • 8.4. Clinical Research Institutes
  • 9. Global Market Analysis 2017 to 2022 and Forecast 2023 to 2033, by Region
    • 9.1. North America
    • 9.2. Latin America
    • 9.3. Europe
    • 9.4. South Asia
    • 9.5. East Asia
    • 9.6. Oceania
    • 9.7. Middle East and Africa (MEA)
  • 10. North America Market Analysis 2017 to 2022 and Forecast 2023 to 2033
  • 11. Latin America Market Analysis 2017 to 2022 and Forecast 2023 to 2033
  • 12. Europe Market Analysis 2017 to 2022 and Forecast 2023 to 2033
  • 13. South Asia Market Analysis 2017 to 2022 and Forecast 2023 to 2033
  • 14. East Asia Market Analysis 2017 to 2022 and Forecast 2023 to 2033
  • 15. Oceania Market Analysis 2017 to 2022 and Forecast 2023 to 2033
  • 16. Middle East and Africa Market Analysis 2017 to 2022 and Forecast 2023 to 2033
  • 17. Market Structure Analysis
  • 18. Competition Analysis
    • 18.1. Vitrolife
    • 18.2. Rocket Medical
    • 18.3. RI.MOS.
    • 18.4. Gynetics Medical Products
    • 18.5. Kitazato Corporation
    • 18.6. Wallace™ (A CooperSurgical Company)
    • 18.7. Gynemed Medizinprodukte GmbH & Co. KG
    • 18.8. Rocket Medical plc
    • 18.9. Biolife Italiana S.r.l.
    • 18.10. ReproLine Medical Devices
    • 18.11. Triumph Medical Supplies Co., Ltd.
    • 18.12. CADMACH MACHINERY CO. PVT. LTD.
    • 18.13. LifeGlobal Group LLC
    • 18.14. Sage Media Ltd.
    • 18.15. SRR Surgical Instruments
    • 18.16. Tsunami Medical
    • 18.17. CooperSurgical, Inc
  • 19. Assumptions and Acronyms Used
  • 20. Research Methodology

List of Tables

Table 01: Global Market Analysis 2017 to 2022 and Forecast 2023 to 2033, by Product

Table 02: Global Market Analysis 2017 to 2022 and Forecast 2023 to 2033, by End User

Table 03: Global Market Analysis 2017 to 2022 and Forecast 2023 to 2033, by Region

Table 04: North America Market Value (US$ Million) Analysis 2017 to 2022 and Forecast 2023 to 2033, by Country

Table 05: North America Market Value (US$ Million) Analysis 2017 to 2022 and Forecast 2023 to 2033, by Product

Table 06: North America Market Value (US$ Million) Analysis 2017 to 2022 and Forecast 2023 to 2033, by End User

Table 07: Latin America Market Value (US$ Million) Analysis 2017 to 2022 and Forecast 2023 to 2033, by Country

Table 08: Latin America Market Value (US$ Million) Analysis 2017 to 2022 and Forecast 2023 to 2033, by Product

Table 09: Latin America Market Value (US$ Million) Analysis 2017 to 2022 and Forecast 2023 to 2033, by End User

Table 10: Europe Market Value (US$ Million) Analysis 2017 to 2022 and Forecast 2023 to 2033, by Country

Table 11: Europe Market Value (US$ Million) Analysis 2017 to 2022 and Forecast 2023 to 2033, by Product

Table 12: Europe Market Analysis 2017 to 2022 and Forecast 2023 to 2033, by End User

Table 13: East Asia Market Value (US$ Million) Analysis 2017 to 2022 and Forecast 2023 to 2033, by Country

Table 14: East Asia Market Value (US$ Million) Analysis 2017 to 2022 and Forecast 2023 to 2033, by Product

Table 15: East Asia Market Value (US$ Million) Analysis 2017 to 2022 and Forecast 2023 to 2033, by End User

Table 16: South Asia Market Value (US$ Million) Analysis 2017 to 2022 and Forecast 2023 to 2033, by Country

Table 17: South Asia Market Value (US$ Million) Analysis 2017 to 2022 and Forecast 2023 to 2033, by Product

Table 18: South Asia Market Value (US$ Million) Analysis 2017 to 2022 and Forecast 2023 to 2033, by End User

Table 19: Oceania Market Value (US$ Million) Analysis 2017 to 2022 and Forecast 2023 to 2033, by Country

Table 20: Oceania Market Value (US$ Million) Analysis 2017 to 2022 and Forecast 2023 to 2033, by Product

Table 21: Oceania Market Analysis 2017 to 2022 and Forecast 2023 to 2033, by End User

Table 22: Middle East & Africa Market Value (US$ Million) Analysis 2017 to 2022 and Forecast 2023 to 2033, by Country

Table 23: Middle East & Africa Market Value (US$ Million) Analysis 2017 to 2022 and Forecast 2023 to 2033, by Product

Table 24: Middle East & Africa Market Analysis 2017 to 2022 and Forecast 2023 to 2033, by End User

List of Figures

Figure 01: Global Market Value (US$ Million) Analysis, 2017 to 2022

Figure 02: Global Market Forecast & Y-o-Y Growth, 2023 to 2033

Figure 03: Global Market Absolute $ Opportunity (US$ Million) Analysis, 2022 to 2033

Figure 04: Global Market Value Share (%) Analysis 2023 and 2033, by Product

Figure 05: Global Market Y-o-Y Growth (%) Analysis 2022 to 2033, by Product

Figure 06: Global Market Attractiveness Analysis 2023 to 2033, by Product

Figure 07: Global Market Value Share (%) Analysis 2023 and 2033, by End User

Figure 08: Global Market Y-o-Y Growth (%) Analysis 2022 to 2033, by End User

Figure 09: Global Market Attractiveness Analysis 2023 to 2033, by End User

Figure 10: Global Market Value Share (%) Analysis 2023 and 2033, by Region

Figure 11: Global Market Y-o-Y Growth (%) Analysis 2022 to 2033, by Region

Figure 12: Global Market Attractiveness Analysis 2023 to 2033, by Region

Figure 13: North America Market Value (US$ Million) Analysis, 2017 to 2022

Figure 14: North America Market Value (US$ Million) Forecast, 2023 to 2033

Figure 15: North America Market Value Share, by Product (2023 E)

Figure 16: North America Market Value Share, by End User (2023 E)

Figure 17: North America Market Value Share, by Country (2023 E)

Figure 18: North America Market Attractiveness Analysis by Product, 2023 to 2033

Figure 19: North America Market Attractiveness Analysis by Country, 2023 to 2033

Figure 20: USA Market Value Proportion Analysis, 2022

Figure 21: Global Vs. USA Growth Comparison

Figure 22: USA Market Share Analysis (%) by Product, 2022 & 2033

Figure 23: USA Market Share Analysis (%) by End User, 2022 & 2033

Figure 24: Canada Market Value Proportion Analysis, 2022

Figure 25: Global Vs. Canada. Growth Comparison

Figure 26: Canada Market Share Analysis (%) by Product, 2022 & 2033

Figure 27: Canada Market Share Analysis (%) by End User, 2022 & 2033

Figure 28: Latin America Market Value (US$ Million) Analysis, 2017 to 2022

Figure 29: Latin America Market Value (US$ Million) Forecast, 2023 to 2033

Figure 30: Latin America Market Value Share, by Product (2023 E)

Figure 31: Latin America Market Value Share, by End User (2023 E)

Figure 32: Latin America Market Value Share, by Country (2023 E)

Figure 33: Latin America Market Attractiveness Analysis by Product, 2023 to 2033

Figure 34: Latin America Market Attractiveness Analysis by End User, 2023 to 2033

Figure 35: Latin America Market Attractiveness Analysis by Country, 2023 to 2033

Figure 36: Mexico Market Value Proportion Analysis, 2022

Figure 37: Global Vs Mexico Growth Comparison

Figure 38: Mexico Market Share Analysis (%) by Product, 2022 & 2033

Figure 39: Mexico Market Share Analysis (%) by End User, 2022 & 2033

Figure 40: Brazil Market Value Proportion Analysis, 2022

Figure 41: Global Vs. Brazil. Growth Comparison

Figure 42: Brazil Market Share Analysis (%) by Product, 2022 & 2033

Figure 43: Brazil Market Share Analysis (%) by End User, 2022 & 2033

Figure 44: Argentina Market Value Proportion Analysis, 2022

Figure 45: Global Vs Argentina Growth Comparison

Figure 46: Argentina Market Share Analysis (%) by Product, 2022 & 2033

Figure 47: Argentina Market Share Analysis (%) by End User, 2022 & 2033

Figure 48: Europe Market Value (US$ Million) Analysis, 2017 to 2022

Figure 49: Europe Market Value (US$ Million) Forecast, 2023 to 2033

Figure 50: Europe Market Value Share, by Product (2023 E)

Figure 51: Europe Market Value Share, by End User (2023 E)

Figure 52: Europe Market Value Share, by Country (2023 E)

Figure 53: Europe Market Attractiveness Analysis by Product, 2023 to 2033

Figure 54: Europe Market Attractiveness Analysis by End User, 2023 to 2033

Figure 55: Europe Market Attractiveness Analysis by Country, 2023 to 2033

Figure 56: UK Market Value Proportion Analysis, 2022

Figure 57: Global Vs. UK Growth Comparison

Figure 58: UK Market Share Analysis (%) by Product, 2022 & 2033

Figure 59: UK Market Share Analysis (%) by End User, 2022 & 2033

Figure 60: Germany Market Value Proportion Analysis, 2022

Figure 61: Global Vs. Germany Growth Comparison

Figure 62: Germany Market Share Analysis (%) by Product, 2022 & 2033

Figure 63: Germany Market Share Analysis (%) by End User, 2022 & 2033

Figure 64: Italy Market Value Proportion Analysis, 2022

Figure 65: Global Vs. Italy Growth Comparison

Figure 66: Italy Market Share Analysis (%) by Product, 2022 & 2033

Figure 67: Italy Market Share Analysis (%) by End User, 2022 & 2033

Figure 68: France Market Value Proportion Analysis, 2022

Figure 69: Global Vs France Growth Comparison

Figure 70: France Market Share Analysis (%) by Product, 2022 & 2033

Figure 71: France Market Share Analysis (%) by End User, 2022 & 2033

Figure 72: Spain Market Value Proportion Analysis, 2022

Figure 73: Global Vs Spain Growth Comparison

Figure 74: Spain Market Share Analysis (%) by Product, 2022 & 2033

Figure 75: Spain Market Share Analysis (%) by End User, 2022 & 2033

Figure 76: Russia Market Value Proportion Analysis, 2022

Figure 77: Global Vs Russia Growth Comparison

Figure 78: Russia Market Share Analysis (%) by Product, 2022 & 2033

Figure 79: Russia Market Share Analysis (%) by End User, 2022 & 2033

Figure 80: BENELUX Market Value Proportion Analysis, 2022

Figure 81: Global Vs BENELUX Growth Comparison

Figure 82: BENELUX Market Share Analysis (%) by Product, 2022 & 2033

Figure 83: BENELUX Market Share Analysis (%) by End User, 2022 & 2033

Figure 84: East Asia Market Value (US$ Million) Analysis, 2017 to 2022

Figure 85: East Asia Market Value (US$ Million) Forecast, 2023 to 2033

Figure 86: East Asia Market Value Share, by Product (2023 E)

Figure 87: East Asia Market Value Share, by End User (2023 E)

Figure 88: East Asia Market Value Share, by Country (2023 E)

Figure 89: East Asia Market Attractiveness Analysis by Product, 2023 to 2033

Figure 90: East Asia Market Attractiveness Analysis by End User, 2023 to 2033

Figure 91: East Asia Market Attractiveness Analysis by Country, 2023 to 2033

Figure 92: China Market Value Proportion Analysis, 2022

Figure 93: Global Vs. China Growth Comparison

Figure 94: China Market Share Analysis (%) by Product, 2022 & 2033

Figure 95: China Market Share Analysis (%) by End User, 2022 & 2033

Figure 96: Japan Market Value Proportion Analysis, 2022

Figure 97: Global Vs. Japan Growth Comparison

Figure 98: Japan Market Share Analysis (%) by Product, 2022 & 2033

Figure 99: Japan Market Share Analysis (%) by End User, 2022 & 2033

Figure 100: South Korea Market Value Proportion Analysis, 2022

Figure 101: Global Vs South Korea Growth Comparison

Figure 102: South Korea Market Share Analysis (%) by Product, 2022 & 2033

Figure 103: South Korea Market Share Analysis (%) by End User, 2022 & 2033

Figure 104: South Asia Market Value (US$ Million) Analysis, 2017 to 2022

Figure 105: South Asia Market Value (US$ Million) Forecast, 2023 to 2033

Figure 106: South Asia Market Value Share, by Product (2023 E)

Figure 107: South Asia Market Value Share, by End User (2023 E)

Figure 108: South Asia Market Value Share, by Country (2023 E)

Figure 109: South Asia Market Attractiveness Analysis by Product, 2023 to 2033

Figure 110: South Asia Market Attractiveness Analysis by End User, 2023 to 2033

Figure 111: South Asia Market Attractiveness Analysis by Country, 2023 to 2033

Figure 112: India Market Value Proportion Analysis, 2022

Figure 113: Global Vs. India Growth Comparison

Figure 114: India Market Share Analysis (%) by Product, 2022 & 2033

Figure 115: India Market Share Analysis (%) by End User, 2022 & 2033

Figure 116: Indonesia Market Value Proportion Analysis, 2022

Figure 117: Global Vs. Indonesia Growth Comparison

Figure 118: Indonesia Market Share Analysis (%) by Product, 2022 & 2033

Figure 119: Indonesia Market Share Analysis (%) by End User, 2022 & 2033

Figure 120: Malaysia Market Value Proportion Analysis, 2022

Figure 121: Global Vs. Malaysia Growth Comparison

Figure 122: Malaysia Market Share Analysis (%) by Product, 2022 & 2033

Figure 123: Malaysia Market Share Analysis (%) by End User, 2022 & 2033

Figure 124: Thailand Market Value Proportion Analysis, 2022

Figure 125: Global Vs. Thailand Growth Comparison

Figure 126: Thailand Market Share Analysis (%) by Product, 2022 & 2033

Figure 127: Thailand Market Share Analysis (%) by End User, 2022 & 2033

Figure 128: Oceania Market Value (US$ Million) Analysis, 2017 to 2022

Figure 129: Oceania Market Value (US$ Million) Forecast, 2023 to 2033

Figure 130: Oceania Market Value Share, by Product (2023 E)

Figure 131: Oceania Market Value Share, by End User (2023 E)

Figure 132: Oceania Market Value Share, by Country (2023 E)

Figure 133: Oceania Market Attractiveness Analysis by Product, 2023 to 2033

Figure 134: Oceania Market Attractiveness Analysis by End User, 2023 to 2033

Figure 135: Oceania Market Attractiveness Analysis by Country, 2023 to 2033

Figure 136: Australia Market Value Proportion Analysis, 2022

Figure 137: Global Vs. Australia Growth Comparison

Figure 138: Australia Market Share Analysis (%) by Product, 2022 & 2033

Figure 139: Australia Market Share Analysis (%) by End User, 2022 & 2033

Figure 140: New Zealand Market Value Proportion Analysis, 2022

Figure 141: Global Vs New Zealand Growth Comparison

Figure 142: New Zealand Market Share Analysis (%) by Product, 2022 & 2033

Figure 143: New Zealand Market Share Analysis (%) by End User, 2022 & 2033

Figure 144: Middle East & Africa Market Value (US$ Million) Analysis, 2017 to 2022

Figure 145: Middle East & Africa Market Value (US$ Million) Forecast, 2023 to 2033

Figure 146: Middle East & Africa Market Value Share, by Product (2023 E)

Figure 147: Middle East & Africa Market Value Share, by End User (2023 E)

Figure 148: Middle East & Africa Market Value Share, by Country (2023 E)

Figure 149: Middle East & Africa Market Attractiveness Analysis by Product, 2023 to 2033

Figure 150: Middle East & Africa Market Attractiveness Analysis by End User, 2023 to 2033

Figure 151: Middle East & Africa Market Attractiveness Analysis by Country, 2023 to 2033

Figure 152: GCC Countries Market Value Proportion Analysis, 2022

Figure 153: Global Vs GCC Countries Growth Comparison

Figure 154: GCC Countries Market Share Analysis (%) by Product, 2022 & 2033

Figure 155: GCC Countries Market Share Analysis (%) by End User, 2022 & 2033

Figure 156: Türkiye Market Value Proportion Analysis, 2022

Figure 157: Global Vs. Türkiye Growth Comparison

Figure 158: Türkiye Market Share Analysis (%) by Product, 2022 & 2033

Figure 159: Türkiye Market Share Analysis (%) by End User, 2022 & 2033

Figure 160: South Africa Market Value Proportion Analysis, 2022

Figure 161: Global Vs. South Africa Growth Comparison

Figure 162: South Africa Market Share Analysis (%) by Product, 2022 & 2033

Figure 163: South Africa Market Share Analysis (%) by End User, 2022 & 2033

Figure 164: Northern Africa Market Value Proportion Analysis, 2022

Figure 165: Global Vs Northern Africa Growth Comparison

Figure 166: Northern Africa Market Share Analysis (%) by Product, 2022 & 2033

Figure 167: Northern Africa Market Share Analysis (%) by End User, 2022 & 2033

Frequently Asked Questions

How Much the Oocyte Retrieval Needles Market is Slated to Attain by 2033?

The oocyte retrieval needles market is slated to attain USD 724.6 million by 2033.

What is the Growth Potential of the Oocyte Retrieval Needles Market?

The growth potential of the oocyte retrieval needles market is 6.7% CAGR through 2033.

Which Trends Can be Seen in the Market?

The inclusion of safety features like needle guards and retractable needles to avoid any injuries.

Which Opportunities are Cropping up in the Market?

Promoting the knowledge about the use of oocyte retrieval needles.

What are the Growth Prospects for the United Kingdom Market?

The United Kingdom market is expected to register a CAGR of 8% through 2033.

Explore Similar Insights

Future Market Insights

Oocyte Retrieval Needles Market