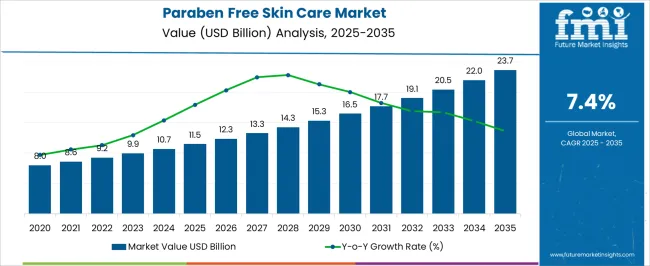
FMI singles out the paraben free skin care market, with analysis signifying a persistent escalation in demand, with the value being pegged at USD 10,684.90 million in 2024. Sales revenue of paraben free skin care products are poised to hit USD 22,021.90 million by. This represents a robust CAGR of 7.50% between 2024 and 2034.
The main factor contributing to the paraben free skin care market’s evolution is escalating recognition regarding the detrimental impact of chemicals on the skin. The intensifying consciousness regarding the advantages of clean ingredient items encourages customers to discover environment-friendly, natural beauty care items.
Attributes | Details |
---|---|
Market Value for 2024 | USD 10,684.90 million |
Market Value for 2034 | USD 22,021.90 million |
Market CAGR from 2024 to 2034 | 7.50% |
The producers that function in the paraben free skin care market strongly concentrate on widening the consumer base by leveraging the propsects offered in the Asia Pacific. New paraben free skin care vendors enter the market to reinforce the market's environmental consciousness.
They also take advantage of consumers' perceptions regarding organic choices as opposed to synthetic cosmetic products. This trend has caused many manufacturers to propose a wide organic product portfolio, like face washes, serums, and facials. Natural skin care products are organic and have no synthetic ingredients.
Attributes | Details |
---|---|
Market Value for 2019 | USD 7,711.50 million |
Market Value for 2023 | USD 9,995.20 million |
Market CAGR from 2019 to 2023 | 6.70% |
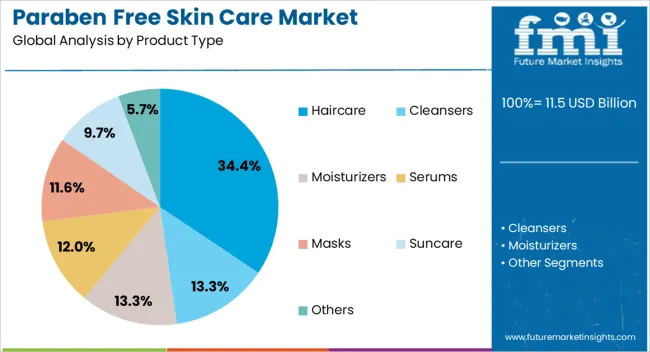
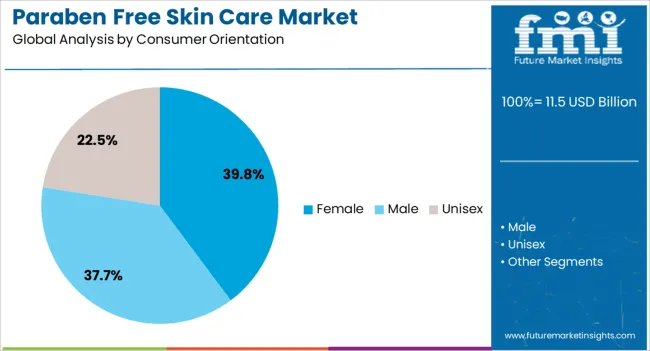
The segmented paraben free skin care market analysis is mentioned in the below subsection. Based on comprehensive studies, the hair care sector is predominant in the product type category. Meanwhile, the female sector is controlling the consumer orientation category.
Segment | Hair Care |
---|---|
Share (2024) | 34.40% |
Paraben free haircare demand supports the ascending trend towards organic ingredients, attracting health-conscious people. Paraben free ingredients in haircare align with buyers concerned about prospective adverse effects, boosting inclination towards safer options.
Haircare items are important for daily grooming regimes, satisfying an extensive consumer base looking for healthier hair. The haircare segment acquires the top spot owing to the economic opportunities for producers to cash on the flourishing paraben free skin care market.
Segment | Female |
---|---|
Share (2024) | 39.80% |
The flexibility of paraben free items satisfies diverse skincare requirements of women, from anti-aging to reactive skin care, prompting significant sales in the female segment. The predominant beauty influencers and media platforms convince primarily the female customer base, imprinting the idea of paraben free skin care advantages.
The augmenting awareness in women regarding the prospective health risks related to parabens escalates their choice of non-toxic replacements. The beauty sector’s concentration on organic and clean ingredients appeals strongly to female consumers, affecting their decisions.
The organic skin care market can be observed in the subsequent tables, which focus on the leading regions in North America, Europe, and the Asia Pacific. A comprehensive evaluation demonstrates that Asia Pacific has enormous market potential for paraben free skin care.
Demand Analysis of Paraben Free Skin Care in North America
Countries | CAGR (2024 to 2034) |
---|---|
United States | 4.70% |
Canada | 8.10% |
Major retail outlets in the United States are mushrooming their product portfolio of paraben free skin care products to serve the booming demand for toxin-free beauty items. Regulatory examination and consumer guidance groups are propelling stricter labeling needs, encouraging producers to recompound products to fulfil paraben free benchmarks.
Influencer promotional campaigns and social media are critical in enhancing paraben free beauty options and persuading consumer preferences. This escalates the United States paraben free skin care market growth.
A trend inclined towards transparency and ingredient integrity is witnessed by the skincare industry of Canada. Brands stress the removal of parabens in their formulations to lure health-conscious shoppers. Environmental awareness and sustainability are key catalysts transforming purchasing decisions in Canada, steering to amplify demand for chemical-free skin care products that go well with sustainable values. The online boom is also a catalyst for the Canadian market’s growth.
Opportunities for Paraben Free Skin Care in Europe
Countries | CAGR (2024 to 2034) |
---|---|
Spain | 6.10% |
Italy | 5.70% |
Germany | 5.40% |
France | 5.10% |
United Kingdom | 4.90% |
The skincare market in Spain observes a remarkable inclination towards paraben free products as consumers are mindful of ingredient security. Consumers in Spain grab paraben free skin care alternatives, ushered by issues of health risks and ecological influence. The amplifying consciousness regarding the probable harm of parabens ushers Spanish consumers to find paraben free cosmetic options, aiding paraben free skin care market growth.
An inclination for natural and organic beauty products intensifies Spain's paraben free beauty products demand. The Spanish skincare industry acts optimistically towards consumer requirements for better alternatives with an expansion of paraben free formulations.
The skincare industry in Italy witnesses an amplification in demand as customers prioritize safer and environment-friendly alternatives. Consumers in Italy are inclined towards paraben free beauty solutions, indicating an escalating alternative in favor of organic beauty products.
The heightened consciousness about the detrimental impacts of parabens surges the paraben free skin care market expansion in Italy. The trend of paraben free skin care goes with an expansive movement towards cleaner and energy-efficient beauty alternatives. The Italian skincare industry has a dramatic inclination towards paraben free formulations amplified by shifting consumer choices and regulatory fluctuations.
Opportunities in the Asia Pacific Industry
Countries | CAGR (2024 to 2034) |
---|---|
Singapore | 9.60% |
India | 9.40% |
Japan | 9.10% |
China | 8.90% |
Australia | 6.30% |
The prosperous population in Singapore is progressively seeking natural and safer alternatives in skincare, aiding the advent of paraben free products. The cosmopolitan culture and susceptibility to global beauty trends in Singapore induce consumers to pick organic skin care solutions.
Strict regulations and consumer cognizance pertaining to health risks enhance the demand for clean skincare alternatives in Singapore. The escalation of ecological efficiency and clean environment trends in Singapore is leading skincare producers to provide cleaner formulations.
The flourishing e-commerce market in India bolsters accessibility to an array of chemical-free skincare products, satisfying consumer demand. The inclination of Indian customers towards Ayurvedic and herbal skincare solutions escalates the demand.
The emergence of organic and natural beauty movements in India amplifies the adoption of paraben free skin care products by health-aware consumers. The surging awareness regarding the environmental impact of chemical-based cosmetics instigates Indian consumers to switch to cruelty-free skincare alternatives.
Numerous manufacturers dot the competitive terrain of the paraben free skin care market, obligated to dispense consumers with effective and clean skincare. Established producers like Burt's Bees, Alba Botanica, Aveeno, and Dr. Hauschka are prominent for their commitment to organic and carbon-neutral ingredients. Paula's Choice, Caudalie, and The Body Shop are distinctive for their concentration on 0% paraben formulations and ethical activities.
Advancements are an impetus in the market, with paraben free skin care vendors like Kiehl's, Juice Beauty, and Andalou Naturals persistently pushing boundaries to provide premium skincare products that are paraben free. Tata Harper, Avalon Organics, and Acure Organics satisfy the strengthening demand for organic and greener alternatives, while Desert Essence and Ren Clean Skincare emphasize controlling the power of natural extracts.
The paraben free skin care manufacturers are devoted to ethical activities. As consumer recognition of substance safety escalates, the market is slated to witness amplified growth, with the potential for established providers and emerging startups to leave their impression on the paraben free skin care market.
Noteworthy Observations
Company | Haeckels |
---|---|
Headquarter | United Kingdom |
Recent Advancement |
|
Company | e.l.f. Cosmetics |
---|---|
Headquarter | United States |
Recent Advancement |
|
Company | L'Oreal |
---|---|
Headquarter | France |
Recent Advancement |
|
Company | The Body Shop |
---|---|
Headquarter | United Kingdom |
Recent Advancement |
|
Company | Phy |
---|---|
Headquarter | India |
Recent Advancement |
|
Table 1: Global Market Value (US$ Million) Forecast by Region, 2019 to 2034
Table 2: Global Market Volume (Unit Pack) Forecast by Region, 2019 to 2034
Table 3: Global Market Value (US$ Million) Forecast by Product Type, 2019 to 2034
Table 4: Global Market Volume (Unit Pack) Forecast by Product Type, 2019 to 2034
Table 5: Global Market Value (US$ Million) Forecast by Consumer Orientation, 2019 to 2034
Table 6: Global Market Volume (Unit Pack) Forecast by Consumer Orientation, 2019 to 2034
Table 7: Global Market Value (US$ Million) Forecast by Packaging Type, 2019 to 2034
Table 8: Global Market Volume (Unit Pack) Forecast by Packaging Type, 2019 to 2034
Table 9: Global Market Value (US$ Million) Forecast by Sales Channel, 2019 to 2034
Table 10: Global Market Volume (Unit Pack) Forecast by Sales Channel, 2019 to 2034
Table 11: North America Market Value (US$ Million) Forecast by Country, 2019 to 2034
Table 12: North America Market Volume (Unit Pack) Forecast by Country, 2019 to 2034
Table 13: North America Market Value (US$ Million) Forecast by Product Type, 2019 to 2034
Table 14: North America Market Volume (Unit Pack) Forecast by Product Type, 2019 to 2034
Table 15: North America Market Value (US$ Million) Forecast by Consumer Orientation, 2019 to 2034
Table 16: North America Market Volume (Unit Pack) Forecast by Consumer Orientation, 2019 to 2034
Table 17: North America Market Value (US$ Million) Forecast by Packaging Type, 2019 to 2034
Table 18: North America Market Volume (Unit Pack) Forecast by Packaging Type, 2019 to 2034
Table 19: North America Market Value (US$ Million) Forecast by Sales Channel, 2019 to 2034
Table 20: North America Market Volume (Unit Pack) Forecast by Sales Channel, 2019 to 2034
Table 21: Latin America Market Value (US$ Million) Forecast by Country, 2019 to 2034
Table 22: Latin America Market Volume (Unit Pack) Forecast by Country, 2019 to 2034
Table 23: Latin America Market Value (US$ Million) Forecast by Product Type, 2019 to 2034
Table 24: Latin America Market Volume (Unit Pack) Forecast by Product Type, 2019 to 2034
Table 25: Latin America Market Value (US$ Million) Forecast by Consumer Orientation, 2019 to 2034
Table 26: Latin America Market Volume (Unit Pack) Forecast by Consumer Orientation, 2019 to 2034
Table 27: Latin America Market Value (US$ Million) Forecast by Packaging Type, 2019 to 2034
Table 28: Latin America Market Volume (Unit Pack) Forecast by Packaging Type, 2019 to 2034
Table 29: Latin America Market Value (US$ Million) Forecast by Sales Channel, 2019 to 2034
Table 30: Latin America Market Volume (Unit Pack) Forecast by Sales Channel, 2019 to 2034
Table 31: Western Europe Market Value (US$ Million) Forecast by Country, 2019 to 2034
Table 32: Western Europe Market Volume (Unit Pack) Forecast by Country, 2019 to 2034
Table 33: Western Europe Market Value (US$ Million) Forecast by Product Type, 2019 to 2034
Table 34: Western Europe Market Volume (Unit Pack) Forecast by Product Type, 2019 to 2034
Table 35: Western Europe Market Value (US$ Million) Forecast by Consumer Orientation, 2019 to 2034
Table 36: Western Europe Market Volume (Unit Pack) Forecast by Consumer Orientation, 2019 to 2034
Table 37: Western Europe Market Value (US$ Million) Forecast by Packaging Type, 2019 to 2034
Table 38: Western Europe Market Volume (Unit Pack) Forecast by Packaging Type, 2019 to 2034
Table 39: Western Europe Market Value (US$ Million) Forecast by Sales Channel, 2019 to 2034
Table 40: Western Europe Market Volume (Unit Pack) Forecast by Sales Channel, 2019 to 2034
Table 41: Eastern Europe Market Value (US$ Million) Forecast by Country, 2019 to 2034
Table 42: Eastern Europe Market Volume (Unit Pack) Forecast by Country, 2019 to 2034
Table 43: Eastern Europe Market Value (US$ Million) Forecast by Product Type, 2019 to 2034
Table 44: Eastern Europe Market Volume (Unit Pack) Forecast by Product Type, 2019 to 2034
Table 45: Eastern Europe Market Value (US$ Million) Forecast by Consumer Orientation, 2019 to 2034
Table 46: Eastern Europe Market Volume (Unit Pack) Forecast by Consumer Orientation, 2019 to 2034
Table 47: Eastern Europe Market Value (US$ Million) Forecast by Packaging Type, 2019 to 2034
Table 48: Eastern Europe Market Volume (Unit Pack) Forecast by Packaging Type, 2019 to 2034
Table 49: Eastern Europe Market Value (US$ Million) Forecast by Sales Channel, 2019 to 2034
Table 50: Eastern Europe Market Volume (Unit Pack) Forecast by Sales Channel, 2019 to 2034
Table 51: South Asia and Pacific Market Value (US$ Million) Forecast by Country, 2019 to 2034
Table 52: South Asia and Pacific Market Volume (Unit Pack) Forecast by Country, 2019 to 2034
Table 53: South Asia and Pacific Market Value (US$ Million) Forecast by Product Type, 2019 to 2034
Table 54: South Asia and Pacific Market Volume (Unit Pack) Forecast by Product Type, 2019 to 2034
Table 55: South Asia and Pacific Market Value (US$ Million) Forecast by Consumer Orientation, 2019 to 2034
Table 56: South Asia and Pacific Market Volume (Unit Pack) Forecast by Consumer Orientation, 2019 to 2034
Table 57: South Asia and Pacific Market Value (US$ Million) Forecast by Packaging Type, 2019 to 2034
Table 58: South Asia and Pacific Market Volume (Unit Pack) Forecast by Packaging Type, 2019 to 2034
Table 59: South Asia and Pacific Market Value (US$ Million) Forecast by Sales Channel, 2019 to 2034
Table 60: South Asia and Pacific Market Volume (Unit Pack) Forecast by Sales Channel, 2019 to 2034
Table 61: East Asia Market Value (US$ Million) Forecast by Country, 2019 to 2034
Table 62: East Asia Market Volume (Unit Pack) Forecast by Country, 2019 to 2034
Table 63: East Asia Market Value (US$ Million) Forecast by Product Type, 2019 to 2034
Table 64: East Asia Market Volume (Unit Pack) Forecast by Product Type, 2019 to 2034
Table 65: East Asia Market Value (US$ Million) Forecast by Consumer Orientation, 2019 to 2034
Table 66: East Asia Market Volume (Unit Pack) Forecast by Consumer Orientation, 2019 to 2034
Table 67: East Asia Market Value (US$ Million) Forecast by Packaging Type, 2019 to 2034
Table 68: East Asia Market Volume (Unit Pack) Forecast by Packaging Type, 2019 to 2034
Table 69: East Asia Market Value (US$ Million) Forecast by Sales Channel, 2019 to 2034
Table 70: East Asia Market Volume (Unit Pack) Forecast by Sales Channel, 2019 to 2034
Table 71: Middle East and Africa Market Value (US$ Million) Forecast by Country, 2019 to 2034
Table 72: Middle East and Africa Market Volume (Unit Pack) Forecast by Country, 2019 to 2034
Table 73: Middle East and Africa Market Value (US$ Million) Forecast by Product Type, 2019 to 2034
Table 74: Middle East and Africa Market Volume (Unit Pack) Forecast by Product Type, 2019 to 2034
Table 75: Middle East and Africa Market Value (US$ Million) Forecast by Consumer Orientation, 2019 to 2034
Table 76: Middle East and Africa Market Volume (Unit Pack) Forecast by Consumer Orientation, 2019 to 2034
Table 77: Middle East and Africa Market Value (US$ Million) Forecast by Packaging Type, 2019 to 2034
Table 78: Middle East and Africa Market Volume (Unit Pack) Forecast by Packaging Type, 2019 to 2034
Table 79: Middle East and Africa Market Value (US$ Million) Forecast by Sales Channel, 2019 to 2034
Table 80: Middle East and Africa Market Volume (Unit Pack) Forecast by Sales Channel, 2019 to 2034
Figure 1: Global Market Value (US$ Million) by Product Type, 2024 to 2034
Figure 2: Global Market Value (US$ Million) by Consumer Orientation, 2024 to 2034
Figure 3: Global Market Value (US$ Million) by Packaging Type, 2024 to 2034
Figure 4: Global Market Value (US$ Million) by Sales Channel, 2024 to 2034
Figure 5: Global Market Value (US$ Million) by Region, 2024 to 2034
Figure 6: Global Market Value (US$ Million) Analysis by Region, 2019 to 2034
Figure 7: Global Market Volume (Unit Pack) Analysis by Region, 2019 to 2034
Figure 8: Global Market Value Share (%) and BPS Analysis by Region, 2024 to 2034
Figure 9: Global Market Y-o-Y Growth (%) Projections by Region, 2024 to 2034
Figure 10: Global Market Value (US$ Million) Analysis by Product Type, 2019 to 2034
Figure 11: Global Market Volume (Unit Pack) Analysis by Product Type, 2019 to 2034
Figure 12: Global Market Value Share (%) and BPS Analysis by Product Type, 2024 to 2034
Figure 13: Global Market Y-o-Y Growth (%) Projections by Product Type, 2024 to 2034
Figure 14: Global Market Value (US$ Million) Analysis by Consumer Orientation, 2019 to 2034
Figure 15: Global Market Volume (Unit Pack) Analysis by Consumer Orientation, 2019 to 2034
Figure 16: Global Market Value Share (%) and BPS Analysis by Consumer Orientation, 2024 to 2034
Figure 17: Global Market Y-o-Y Growth (%) Projections by Consumer Orientation, 2024 to 2034
Figure 18: Global Market Value (US$ Million) Analysis by Packaging Type, 2019 to 2034
Figure 19: Global Market Volume (Unit Pack) Analysis by Packaging Type, 2019 to 2034
Figure 20: Global Market Value Share (%) and BPS Analysis by Packaging Type, 2024 to 2034
Figure 21: Global Market Y-o-Y Growth (%) Projections by Packaging Type, 2024 to 2034
Figure 22: Global Market Value (US$ Million) Analysis by Sales Channel, 2019 to 2034
Figure 23: Global Market Volume (Unit Pack) Analysis by Sales Channel, 2019 to 2034
Figure 24: Global Market Value Share (%) and BPS Analysis by Sales Channel, 2024 to 2034
Figure 25: Global Market Y-o-Y Growth (%) Projections by Sales Channel, 2024 to 2034
Figure 26: Global Market Attractiveness by Product Type, 2024 to 2034
Figure 27: Global Market Attractiveness by Consumer Orientation, 2024 to 2034
Figure 28: Global Market Attractiveness by Packaging Type, 2024 to 2034
Figure 29: Global Market Attractiveness by Sales Channel, 2024 to 2034
Figure 30: Global Market Attractiveness by Region, 2024 to 2034
Figure 31: North America Market Value (US$ Million) by Product Type, 2024 to 2034
Figure 32: North America Market Value (US$ Million) by Consumer Orientation, 2024 to 2034
Figure 33: North America Market Value (US$ Million) by Packaging Type, 2024 to 2034
Figure 34: North America Market Value (US$ Million) by Sales Channel, 2024 to 2034
Figure 35: North America Market Value (US$ Million) by Country, 2024 to 2034
Figure 36: North America Market Value (US$ Million) Analysis by Country, 2019 to 2034
Figure 37: North America Market Volume (Unit Pack) Analysis by Country, 2019 to 2034
Figure 38: North America Market Value Share (%) and BPS Analysis by Country, 2024 to 2034
Figure 39: North America Market Y-o-Y Growth (%) Projections by Country, 2024 to 2034
Figure 40: North America Market Value (US$ Million) Analysis by Product Type, 2019 to 2034
Figure 41: North America Market Volume (Unit Pack) Analysis by Product Type, 2019 to 2034
Figure 42: North America Market Value Share (%) and BPS Analysis by Product Type, 2024 to 2034
Figure 43: North America Market Y-o-Y Growth (%) Projections by Product Type, 2024 to 2034
Figure 44: North America Market Value (US$ Million) Analysis by Consumer Orientation, 2019 to 2034
Figure 45: North America Market Volume (Unit Pack) Analysis by Consumer Orientation, 2019 to 2034
Figure 46: North America Market Value Share (%) and BPS Analysis by Consumer Orientation, 2024 to 2034
Figure 47: North America Market Y-o-Y Growth (%) Projections by Consumer Orientation, 2024 to 2034
Figure 48: North America Market Value (US$ Million) Analysis by Packaging Type, 2019 to 2034
Figure 49: North America Market Volume (Unit Pack) Analysis by Packaging Type, 2019 to 2034
Figure 50: North America Market Value Share (%) and BPS Analysis by Packaging Type, 2024 to 2034
Figure 51: North America Market Y-o-Y Growth (%) Projections by Packaging Type, 2024 to 2034
Figure 52: North America Market Value (US$ Million) Analysis by Sales Channel, 2019 to 2034
Figure 53: North America Market Volume (Unit Pack) Analysis by Sales Channel, 2019 to 2034
Figure 54: North America Market Value Share (%) and BPS Analysis by Sales Channel, 2024 to 2034
Figure 55: North America Market Y-o-Y Growth (%) Projections by Sales Channel, 2024 to 2034
Figure 56: North America Market Attractiveness by Product Type, 2024 to 2034
Figure 57: North America Market Attractiveness by Consumer Orientation, 2024 to 2034
Figure 58: North America Market Attractiveness by Packaging Type, 2024 to 2034
Figure 59: North America Market Attractiveness by Sales Channel, 2024 to 2034
Figure 60: North America Market Attractiveness by Country, 2024 to 2034
Figure 61: Latin America Market Value (US$ Million) by Product Type, 2024 to 2034
Figure 62: Latin America Market Value (US$ Million) by Consumer Orientation, 2024 to 2034
Figure 63: Latin America Market Value (US$ Million) by Packaging Type, 2024 to 2034
Figure 64: Latin America Market Value (US$ Million) by Sales Channel, 2024 to 2034
Figure 65: Latin America Market Value (US$ Million) by Country, 2024 to 2034
Figure 66: Latin America Market Value (US$ Million) Analysis by Country, 2019 to 2034
Figure 67: Latin America Market Volume (Unit Pack) Analysis by Country, 2019 to 2034
Figure 68: Latin America Market Value Share (%) and BPS Analysis by Country, 2024 to 2034
Figure 69: Latin America Market Y-o-Y Growth (%) Projections by Country, 2024 to 2034
Figure 70: Latin America Market Value (US$ Million) Analysis by Product Type, 2019 to 2034
Figure 71: Latin America Market Volume (Unit Pack) Analysis by Product Type, 2019 to 2034
Figure 72: Latin America Market Value Share (%) and BPS Analysis by Product Type, 2024 to 2034
Figure 73: Latin America Market Y-o-Y Growth (%) Projections by Product Type, 2024 to 2034
Figure 74: Latin America Market Value (US$ Million) Analysis by Consumer Orientation, 2019 to 2034
Figure 75: Latin America Market Volume (Unit Pack) Analysis by Consumer Orientation, 2019 to 2034
Figure 76: Latin America Market Value Share (%) and BPS Analysis by Consumer Orientation, 2024 to 2034
Figure 77: Latin America Market Y-o-Y Growth (%) Projections by Consumer Orientation, 2024 to 2034
Figure 78: Latin America Market Value (US$ Million) Analysis by Packaging Type, 2019 to 2034
Figure 79: Latin America Market Volume (Unit Pack) Analysis by Packaging Type, 2019 to 2034
Figure 80: Latin America Market Value Share (%) and BPS Analysis by Packaging Type, 2024 to 2034
Figure 81: Latin America Market Y-o-Y Growth (%) Projections by Packaging Type, 2024 to 2034
Figure 82: Latin America Market Value (US$ Million) Analysis by Sales Channel, 2019 to 2034
Figure 83: Latin America Market Volume (Unit Pack) Analysis by Sales Channel, 2019 to 2034
Figure 84: Latin America Market Value Share (%) and BPS Analysis by Sales Channel, 2024 to 2034
Figure 85: Latin America Market Y-o-Y Growth (%) Projections by Sales Channel, 2024 to 2034
Figure 86: Latin America Market Attractiveness by Product Type, 2024 to 2034
Figure 87: Latin America Market Attractiveness by Consumer Orientation, 2024 to 2034
Figure 88: Latin America Market Attractiveness by Packaging Type, 2024 to 2034
Figure 89: Latin America Market Attractiveness by Sales Channel, 2024 to 2034
Figure 90: Latin America Market Attractiveness by Country, 2024 to 2034
Figure 91: Western Europe Market Value (US$ Million) by Product Type, 2024 to 2034
Figure 92: Western Europe Market Value (US$ Million) by Consumer Orientation, 2024 to 2034
Figure 93: Western Europe Market Value (US$ Million) by Packaging Type, 2024 to 2034
Figure 94: Western Europe Market Value (US$ Million) by Sales Channel, 2024 to 2034
Figure 95: Western Europe Market Value (US$ Million) by Country, 2024 to 2034
Figure 96: Western Europe Market Value (US$ Million) Analysis by Country, 2019 to 2034
Figure 97: Western Europe Market Volume (Unit Pack) Analysis by Country, 2019 to 2034
Figure 98: Western Europe Market Value Share (%) and BPS Analysis by Country, 2024 to 2034
Figure 99: Western Europe Market Y-o-Y Growth (%) Projections by Country, 2024 to 2034
Figure 100: Western Europe Market Value (US$ Million) Analysis by Product Type, 2019 to 2034
Figure 101: Western Europe Market Volume (Unit Pack) Analysis by Product Type, 2019 to 2034
Figure 102: Western Europe Market Value Share (%) and BPS Analysis by Product Type, 2024 to 2034
Figure 103: Western Europe Market Y-o-Y Growth (%) Projections by Product Type, 2024 to 2034
Figure 104: Western Europe Market Value (US$ Million) Analysis by Consumer Orientation, 2019 to 2034
Figure 105: Western Europe Market Volume (Unit Pack) Analysis by Consumer Orientation, 2019 to 2034
Figure 106: Western Europe Market Value Share (%) and BPS Analysis by Consumer Orientation, 2024 to 2034
Figure 107: Western Europe Market Y-o-Y Growth (%) Projections by Consumer Orientation, 2024 to 2034
Figure 108: Western Europe Market Value (US$ Million) Analysis by Packaging Type, 2019 to 2034
Figure 109: Western Europe Market Volume (Unit Pack) Analysis by Packaging Type, 2019 to 2034
Figure 110: Western Europe Market Value Share (%) and BPS Analysis by Packaging Type, 2024 to 2034
Figure 111: Western Europe Market Y-o-Y Growth (%) Projections by Packaging Type, 2024 to 2034
Figure 112: Western Europe Market Value (US$ Million) Analysis by Sales Channel, 2019 to 2034
Figure 113: Western Europe Market Volume (Unit Pack) Analysis by Sales Channel, 2019 to 2034
Figure 114: Western Europe Market Value Share (%) and BPS Analysis by Sales Channel, 2024 to 2034
Figure 115: Western Europe Market Y-o-Y Growth (%) Projections by Sales Channel, 2024 to 2034
Figure 116: Western Europe Market Attractiveness by Product Type, 2024 to 2034
Figure 117: Western Europe Market Attractiveness by Consumer Orientation, 2024 to 2034
Figure 118: Western Europe Market Attractiveness by Packaging Type, 2024 to 2034
Figure 119: Western Europe Market Attractiveness by Sales Channel, 2024 to 2034
Figure 120: Western Europe Market Attractiveness by Country, 2024 to 2034
Figure 121: Eastern Europe Market Value (US$ Million) by Product Type, 2024 to 2034
Figure 122: Eastern Europe Market Value (US$ Million) by Consumer Orientation, 2024 to 2034
Figure 123: Eastern Europe Market Value (US$ Million) by Packaging Type, 2024 to 2034
Figure 124: Eastern Europe Market Value (US$ Million) by Sales Channel, 2024 to 2034
Figure 125: Eastern Europe Market Value (US$ Million) by Country, 2024 to 2034
Figure 126: Eastern Europe Market Value (US$ Million) Analysis by Country, 2019 to 2034
Figure 127: Eastern Europe Market Volume (Unit Pack) Analysis by Country, 2019 to 2034
Figure 128: Eastern Europe Market Value Share (%) and BPS Analysis by Country, 2024 to 2034
Figure 129: Eastern Europe Market Y-o-Y Growth (%) Projections by Country, 2024 to 2034
Figure 130: Eastern Europe Market Value (US$ Million) Analysis by Product Type, 2019 to 2034
Figure 131: Eastern Europe Market Volume (Unit Pack) Analysis by Product Type, 2019 to 2034
Figure 132: Eastern Europe Market Value Share (%) and BPS Analysis by Product Type, 2024 to 2034
Figure 133: Eastern Europe Market Y-o-Y Growth (%) Projections by Product Type, 2024 to 2034
Figure 134: Eastern Europe Market Value (US$ Million) Analysis by Consumer Orientation, 2019 to 2034
Figure 135: Eastern Europe Market Volume (Unit Pack) Analysis by Consumer Orientation, 2019 to 2034
Figure 136: Eastern Europe Market Value Share (%) and BPS Analysis by Consumer Orientation, 2024 to 2034
Figure 137: Eastern Europe Market Y-o-Y Growth (%) Projections by Consumer Orientation, 2024 to 2034
Figure 138: Eastern Europe Market Value (US$ Million) Analysis by Packaging Type, 2019 to 2034
Figure 139: Eastern Europe Market Volume (Unit Pack) Analysis by Packaging Type, 2019 to 2034
Figure 140: Eastern Europe Market Value Share (%) and BPS Analysis by Packaging Type, 2024 to 2034
Figure 141: Eastern Europe Market Y-o-Y Growth (%) Projections by Packaging Type, 2024 to 2034
Figure 142: Eastern Europe Market Value (US$ Million) Analysis by Sales Channel, 2019 to 2034
Figure 143: Eastern Europe Market Volume (Unit Pack) Analysis by Sales Channel, 2019 to 2034
Figure 144: Eastern Europe Market Value Share (%) and BPS Analysis by Sales Channel, 2024 to 2034
Figure 145: Eastern Europe Market Y-o-Y Growth (%) Projections by Sales Channel, 2024 to 2034
Figure 146: Eastern Europe Market Attractiveness by Product Type, 2024 to 2034
Figure 147: Eastern Europe Market Attractiveness by Consumer Orientation, 2024 to 2034
Figure 148: Eastern Europe Market Attractiveness by Packaging Type, 2024 to 2034
Figure 149: Eastern Europe Market Attractiveness by Sales Channel, 2024 to 2034
Figure 150: Eastern Europe Market Attractiveness by Country, 2024 to 2034
Figure 151: South Asia and Pacific Market Value (US$ Million) by Product Type, 2024 to 2034
Figure 152: South Asia and Pacific Market Value (US$ Million) by Consumer Orientation, 2024 to 2034
Figure 153: South Asia and Pacific Market Value (US$ Million) by Packaging Type, 2024 to 2034
Figure 154: South Asia and Pacific Market Value (US$ Million) by Sales Channel, 2024 to 2034
Figure 155: South Asia and Pacific Market Value (US$ Million) by Country, 2024 to 2034
Figure 156: South Asia and Pacific Market Value (US$ Million) Analysis by Country, 2019 to 2034
Figure 157: South Asia and Pacific Market Volume (Unit Pack) Analysis by Country, 2019 to 2034
Figure 158: South Asia and Pacific Market Value Share (%) and BPS Analysis by Country, 2024 to 2034
Figure 159: South Asia and Pacific Market Y-o-Y Growth (%) Projections by Country, 2024 to 2034
Figure 160: South Asia and Pacific Market Value (US$ Million) Analysis by Product Type, 2019 to 2034
Figure 161: South Asia and Pacific Market Volume (Unit Pack) Analysis by Product Type, 2019 to 2034
Figure 162: South Asia and Pacific Market Value Share (%) and BPS Analysis by Product Type, 2024 to 2034
Figure 163: South Asia and Pacific Market Y-o-Y Growth (%) Projections by Product Type, 2024 to 2034
Figure 164: South Asia and Pacific Market Value (US$ Million) Analysis by Consumer Orientation, 2019 to 2034
Figure 165: South Asia and Pacific Market Volume (Unit Pack) Analysis by Consumer Orientation, 2019 to 2034
Figure 166: South Asia and Pacific Market Value Share (%) and BPS Analysis by Consumer Orientation, 2024 to 2034
Figure 167: South Asia and Pacific Market Y-o-Y Growth (%) Projections by Consumer Orientation, 2024 to 2034
Figure 168: South Asia and Pacific Market Value (US$ Million) Analysis by Packaging Type, 2019 to 2034
Figure 169: South Asia and Pacific Market Volume (Unit Pack) Analysis by Packaging Type, 2019 to 2034
Figure 170: South Asia and Pacific Market Value Share (%) and BPS Analysis by Packaging Type, 2024 to 2034
Figure 171: South Asia and Pacific Market Y-o-Y Growth (%) Projections by Packaging Type, 2024 to 2034
Figure 172: South Asia and Pacific Market Value (US$ Million) Analysis by Sales Channel, 2019 to 2034
Figure 173: South Asia and Pacific Market Volume (Unit Pack) Analysis by Sales Channel, 2019 to 2034
Figure 174: South Asia and Pacific Market Value Share (%) and BPS Analysis by Sales Channel, 2024 to 2034
Figure 175: South Asia and Pacific Market Y-o-Y Growth (%) Projections by Sales Channel, 2024 to 2034
Figure 176: South Asia and Pacific Market Attractiveness by Product Type, 2024 to 2034
Figure 177: South Asia and Pacific Market Attractiveness by Consumer Orientation, 2024 to 2034
Figure 178: South Asia and Pacific Market Attractiveness by Packaging Type, 2024 to 2034
Figure 179: South Asia and Pacific Market Attractiveness by Sales Channel, 2024 to 2034
Figure 180: South Asia and Pacific Market Attractiveness by Country, 2024 to 2034
Figure 181: East Asia Market Value (US$ Million) by Product Type, 2024 to 2034
Figure 182: East Asia Market Value (US$ Million) by Consumer Orientation, 2024 to 2034
Figure 183: East Asia Market Value (US$ Million) by Packaging Type, 2024 to 2034
Figure 184: East Asia Market Value (US$ Million) by Sales Channel, 2024 to 2034
Figure 185: East Asia Market Value (US$ Million) by Country, 2024 to 2034
Figure 186: East Asia Market Value (US$ Million) Analysis by Country, 2019 to 2034
Figure 187: East Asia Market Volume (Unit Pack) Analysis by Country, 2019 to 2034
Figure 188: East Asia Market Value Share (%) and BPS Analysis by Country, 2024 to 2034
Figure 189: East Asia Market Y-o-Y Growth (%) Projections by Country, 2024 to 2034
Figure 190: East Asia Market Value (US$ Million) Analysis by Product Type, 2019 to 2034
Figure 191: East Asia Market Volume (Unit Pack) Analysis by Product Type, 2019 to 2034
Figure 192: East Asia Market Value Share (%) and BPS Analysis by Product Type, 2024 to 2034
Figure 193: East Asia Market Y-o-Y Growth (%) Projections by Product Type, 2024 to 2034
Figure 194: East Asia Market Value (US$ Million) Analysis by Consumer Orientation, 2019 to 2034
Figure 195: East Asia Market Volume (Unit Pack) Analysis by Consumer Orientation, 2019 to 2034
Figure 196: East Asia Market Value Share (%) and BPS Analysis by Consumer Orientation, 2024 to 2034
Figure 197: East Asia Market Y-o-Y Growth (%) Projections by Consumer Orientation, 2024 to 2034
Figure 198: East Asia Market Value (US$ Million) Analysis by Packaging Type, 2019 to 2034
Figure 199: East Asia Market Volume (Unit Pack) Analysis by Packaging Type, 2019 to 2034
Figure 200: East Asia Market Value Share (%) and BPS Analysis by Packaging Type, 2024 to 2034
Figure 201: East Asia Market Y-o-Y Growth (%) Projections by Packaging Type, 2024 to 2034
Figure 202: East Asia Market Value (US$ Million) Analysis by Sales Channel, 2019 to 2034
Figure 203: East Asia Market Volume (Unit Pack) Analysis by Sales Channel, 2019 to 2034
Figure 204: East Asia Market Value Share (%) and BPS Analysis by Sales Channel, 2024 to 2034
Figure 205: East Asia Market Y-o-Y Growth (%) Projections by Sales Channel, 2024 to 2034
Figure 206: East Asia Market Attractiveness by Product Type, 2024 to 2034
Figure 207: East Asia Market Attractiveness by Consumer Orientation, 2024 to 2034
Figure 208: East Asia Market Attractiveness by Packaging Type, 2024 to 2034
Figure 209: East Asia Market Attractiveness by Sales Channel, 2024 to 2034
Figure 210: East Asia Market Attractiveness by Country, 2024 to 2034
Figure 211: Middle East and Africa Market Value (US$ Million) by Product Type, 2024 to 2034
Figure 212: Middle East and Africa Market Value (US$ Million) by Consumer Orientation, 2024 to 2034
Figure 213: Middle East and Africa Market Value (US$ Million) by Packaging Type, 2024 to 2034
Figure 214: Middle East and Africa Market Value (US$ Million) by Sales Channel, 2024 to 2034
Figure 215: Middle East and Africa Market Value (US$ Million) by Country, 2024 to 2034
Figure 216: Middle East and Africa Market Value (US$ Million) Analysis by Country, 2019 to 2034
Figure 217: Middle East and Africa Market Volume (Unit Pack) Analysis by Country, 2019 to 2034
Figure 218: Middle East and Africa Market Value Share (%) and BPS Analysis by Country, 2024 to 2034
Figure 219: Middle East and Africa Market Y-o-Y Growth (%) Projections by Country, 2024 to 2034
Figure 220: Middle East and Africa Market Value (US$ Million) Analysis by Product Type, 2019 to 2034
Figure 221: Middle East and Africa Market Volume (Unit Pack) Analysis by Product Type, 2019 to 2034
Figure 222: Middle East and Africa Market Value Share (%) and BPS Analysis by Product Type, 2024 to 2034
Figure 223: Middle East and Africa Market Y-o-Y Growth (%) Projections by Product Type, 2024 to 2034
Figure 224: Middle East and Africa Market Value (US$ Million) Analysis by Consumer Orientation, 2019 to 2034
Figure 225: Middle East and Africa Market Volume (Unit Pack) Analysis by Consumer Orientation, 2019 to 2034
Figure 226: Middle East and Africa Market Value Share (%) and BPS Analysis by Consumer Orientation, 2024 to 2034
Figure 227: Middle East and Africa Market Y-o-Y Growth (%) Projections by Consumer Orientation, 2024 to 2034
Figure 228: Middle East and Africa Market Value (US$ Million) Analysis by Packaging Type, 2019 to 2034
Figure 229: Middle East and Africa Market Volume (Unit Pack) Analysis by Packaging Type, 2019 to 2034
Figure 230: Middle East and Africa Market Value Share (%) and BPS Analysis by Packaging Type, 2024 to 2034
Figure 231: Middle East and Africa Market Y-o-Y Growth (%) Projections by Packaging Type, 2024 to 2034
Figure 232: Middle East and Africa Market Value (US$ Million) Analysis by Sales Channel, 2019 to 2034
Figure 233: Middle East and Africa Market Volume (Unit Pack) Analysis by Sales Channel, 2019 to 2034
Figure 234: Middle East and Africa Market Value Share (%) and BPS Analysis by Sales Channel, 2024 to 2034
Figure 235: Middle East and Africa Market Y-o-Y Growth (%) Projections by Sales Channel, 2024 to 2034
Figure 236: Middle East and Africa Market Attractiveness by Product Type, 2024 to 2034
Figure 237: Middle East and Africa Market Attractiveness by Consumer Orientation, 2024 to 2034
Figure 238: Middle East and Africa Market Attractiveness by Packaging Type, 2024 to 2034
Figure 239: Middle East and Africa Market Attractiveness by Sales Channel, 2024 to 2034
Figure 240: Middle East and Africa Market Attractiveness by Country, 2024 to 2034
The paraben free cosmetics market is set to secure a valuation of USD 10,684.90 million in 2024.
The market has the potential to accumulate a worth of USD 22,021.90 million by 2034.
The paraben free skin care market is in line to progress at a strong CAGR of 7.50% from 2024 to 2034.
Between 2019 and 2023, the market evolved at a robust CAGR of 6.70%.
The hair care segment is set to achieve a market share of 34.40% in 2024.
The female segment to possess a market share of 39.80% in 2024.
Explore Beauty & Wellness Insights
Thank you!
You will receive an email from our Business Development Manager. Please be sure to check your SPAM/JUNK folder too.