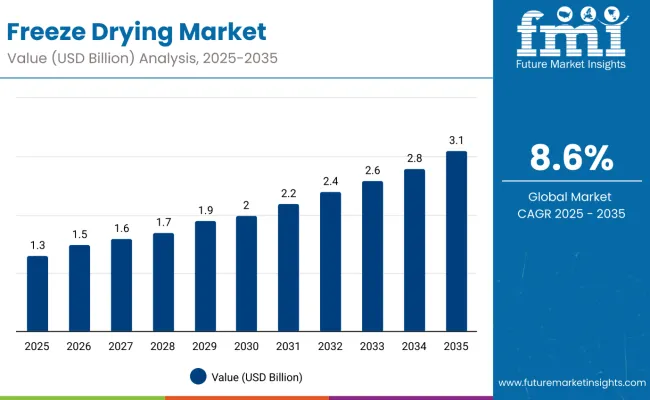
The freeze drying market is estimated to be valued at USD 1.3 billion in 2025 and is projected to reach USD 3.0 billion by 2035, registering a compound annual growth rate (CAGR) of 8.6% over the forecast period.
| Metric | Value |
|---|---|
| Estimated Size (2025E) | USD 1.3 billion |
| Projected Value (2035F) | USD 3 billion |
| CAGR (2025 to 2035) | 8.6% |
The market is expected to add an absolute dollar opportunity of USD 1.7 billion during this period. This reflects a 2.3 times growth at a compound annual growth rate of 8.6%. The market evolution is expected to be shaped by increasing adoption across pharmaceutical, biotechnology, and food processing industries, fueled by technological advancements and rising consumer preference for freeze-dried products offering longer shelf life, better nutrient retention, and enhanced flavor.
By 2030, the freeze drying market is likely to reach USD 2.0 billion, accounting for USD 0.7 billion in incremental value over the first half of the decade. The remaining USD 1.0 billion is expected during the second half, suggesting a back-loaded growth pattern driven by expanding pharmaceutical, biotechnology, and food processing applications in Asia-Pacific, particularly in China and India.
Companies in the market such as GEA Group Aktiengesellschaft (Germany), Azbil Corporation (Japan), Labconco Corporation (USA), Martin Christ Gefriertrocknungsanlagen GmbH (Germany), and SP Industries, Inc. (USA) are consolidating their positions by broadening product portfolios and advancing next-generation freeze drying technologies. These firms focus on energy-efficient, automated, and scalable freeze drying solutions that cater to pharmaceutical, biotechnology, and food sectors globally.
The market holds a strong position across its parent industries, reflecting its rising adoption in pharmaceuticals, biotechnology, and food processing applications. Within the pharmaceutical segment, freeze drying contributes significantly to stabilizing vaccines, biologics, and injectable drugs, with its share estimated at around 28%. In the biotechnology sector, its adoption is notable for preserving enzymes, proteins, and lab reagents, accounting for approximately 18% of relevant processes. Within the food processing industry, freeze-dried products such as fruits, vegetables, coffee, and ready-to-eat meals represent nearly 22% of applications, driven by demand for long shelf life and nutrient retention. Across these parent markets, its contribution underscores both healthcare necessity and consumer convenience.
The market is being driven by increasing demand for stable pharmaceuticals, rising biotechnological research, and growing consumer preference for long shelf-life food products. Innovations are being observed in advanced freeze-drying equipment, process optimization, and energy-efficient technologies. Developments include capacity expansions in North America, Europe, and Asia-Pacific to meet regional demand growth. Trends show a shift toward compact, automated systems and integration with cold-chain logistics; however, conventional freeze drying remains dominant due to reliability and effectiveness in preserving sensitive products. Increasing regulatory standards in pharmaceuticals and food safety are shaping R&D directions and influencing competitive positioning among global and regional players.
Freeze drying’s unique ability to preserve product integrity, extend shelf life, and maintain nutritional and sensory qualities across multiple industries is driving its adoption. Its functional properties make it indispensable in pharmaceuticals, biotechnology, and food processing, where stability, quality, and efficiency are critical for both production and end-use applications.
Technological advancements such as automation, energy-efficient freeze dryers, and integrated process controls are enhancing operational efficiency and scalability. The rising global population, busy lifestyles, and increasing health awareness especially in emerging markets like China and India are fueling demand for freeze-dried food and pharmaceuticals.
Moreover, rapid industrialization, expanding healthcare infrastructure, and rising disposable incomes further boost market growth. Key regions including North America, Europe, and Asia Pacific dominate the market, with Asia Pacific expected to show the highest growth rate due to strong food processing and pharmaceutical sectors.
The market is segmented by product, scale of operations, distribution channel, and region. By product, the market covers dryer (tray-style dryers, rotary freeze dryers, manifold freeze dryer) and accessories (drying chamber, vacuum system, CIP clean-in-place systems, and others. By scale of operations, the market includes pilot-scale, laboratory-scale, and industrial-scale. By distribution channel, the market comprises biopharmaceutical companies, food and beverage companies, academic and research institutes, CRO & CMO, hospitals, and research laboratories. regionally, the market spans across North America, Latin America, Western Europe, Eastern Europe, South Asia and Pacific, East Asia, and Middle East & Africa.
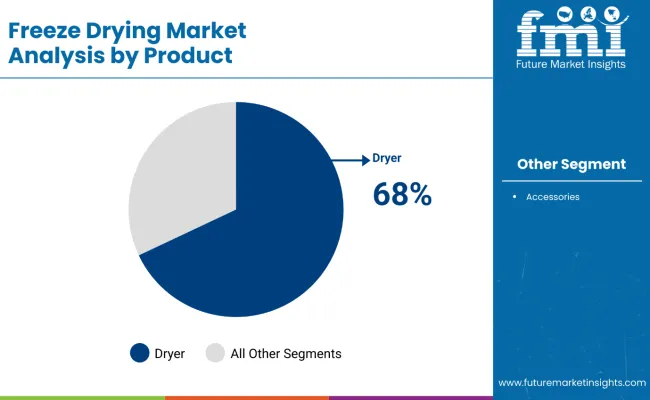
The dryer segment emerges as the most lucrative category in the freeze drying market, commanding a dominant 68% market share in 2025. Within this segment, industrial freeze dryers specifically account for 31.5% of total market revenue share, making them the leading product type. This segment's profitability stems from several critical factors driving high-value transactions and sustained demand.
Industrial freeze dryers represent the market's premium tier, with individual units requiring capital investments ranging from hundreds of thousands to several million dollars. Their dominance is attributed to expanding pharmaceutical manufacturing, particularly in biologics and vaccine production, where precise temperature and pressure control are essential.
The biotechnology sector’s growth further amplifies demand for large-scale, continuous processing capabilities that only industrial freeze dryers can provide. Additionally, rising demand from nutraceuticals, high-value food products, and specialty chemicals reinforces the segment’s leading position, highlighting its importance in high-value and precision-driven applications worldwide.
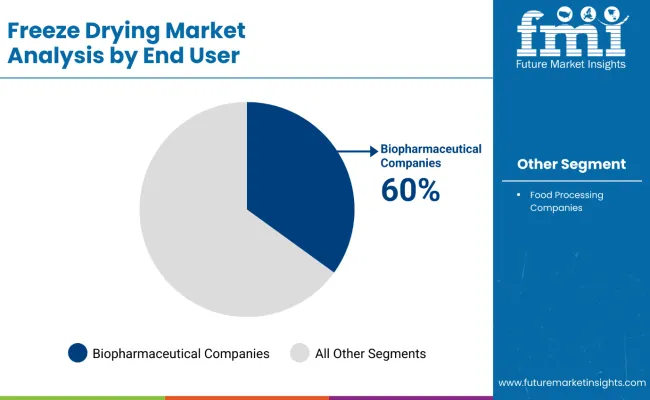
The biopharmaceutical companies segment emerges as the most lucrative distribution channel in the freeze drying market, commanding approximately 60% market share in 2025. This segment's dominance stems from the critical role freeze drying plays in pharmaceutical and biotechnology manufacturing, particularly in preserving temperature-sensitive biologics, vaccines, and therapeutic proteins that require precise moisture removal while maintaining structural integrity.
Biopharmaceutical companies drive premium demand due to their stringent requirements for GMP-compliant, validated freeze drying systems with advanced process controls, real-time monitoring, and regulatory documentation capabilities. The explosive growth in biologics manufacturing, personalized medicine, and vaccine production creates sustained high-value equipment purchases. These companies typically invest in large-scale, automated industrial freeze dryers costing millions of dollars, significantly outpacing other segments in revenue contribution.
The explosive growth in biologics manufacturing, personalized medicine, and vaccine production further sustains high-value equipment purchases. These companies typically invest in large-scale, automated industrial freeze dryers costing millions of dollars, significantly outpacing other segments in revenue contribution and reinforcing their dominance as a key distribution channel in the freeze drying market.
In 2024, the global freeze drying market witnessed significant growth, driven by rising demand from pharmaceutical, biotechnology, and food processing industries. Asia-Pacific accounted for a substantial share of total consumption due to expanding pharmaceutical manufacturing and increasing adoption in food preservation applications. Freeze drying is valued for its ability to preserve temperature-sensitive biologics, vaccines, therapeutic proteins, and perishable foods while maintaining structural integrity, nutrients, and flavor. Manufacturers are investing in energy-efficient, automated, and GMP-compliant freeze drying systems to meet regulatory standards and enhance production efficiency.
Growing Pharmaceutical and Food Industry Demand Drives Freeze Drying Adoption
The pharmaceutical, biotechnology, and food processing industries are the largest consumers of freeze drying systems, leveraging their ability to preserve temperature-sensitive biologics, vaccines, therapeutic proteins, and perishable foods while maintaining structural integrity, nutrients, and flavor. With global vaccine production, biologics manufacturing, and processed food demand on the rise, industrial and pilot-scale freeze dryers are witnessing expanded adoption. Freeze drying technology enhances product shelf life, reduces spoilage, and maintains quality, making it a critical process across these sectors. Increasing focus on high-value food exports and biologics manufacturing further strengthens growth prospects.
Regulatory and Cost Constraints Restrain Market Expansion
Despite strong demand, the freeze drying market faces constraints from high capital expenditure, complex validation requirements, and stringent regulatory compliance for pharmaceutical and food applications. Energy-intensive processes and high operational costs limit adoption among smaller manufacturers. Additionally, raw material volatility and maintenance requirements for industrial freeze dryers present challenges for large-scale deployment. These factors encourage ongoing R&D to improve efficiency, reduce costs, and develop more sustainable and compact freeze drying solutions.
| Countries | CAGR (%) |
|---|---|
| China | 11.9 |
| India | 11.5 |
| United Kingdom | 7.8 |
| Germany | 7.2 |
| United States | 6.8 |
| Japan | 6.5 |
| Australia | 6.1 |
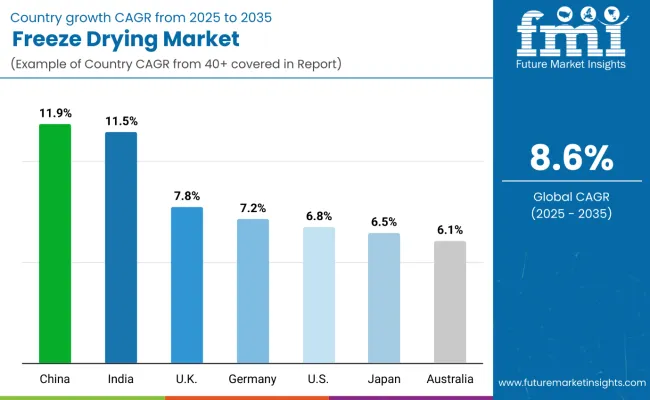
The freeze drying market shows varied growth trajectories across the top seven countries. China leads with the highest CAGR of 11.9%, backed by rapid industrial expansion, pharmaceutical manufacturing growth, and government backing. India follows closely at 11.5%, driven by increasing industrial capacity and urban consumer demand. The UK and Germany grow moderately at 7.8% and 7.2% respectively, benefiting from established pharmaceutical sectors and strict quality regulations. The US, representing a mature market, grows at 6.8%, emphasizing technological innovation and strong regulatory frameworks. Japan's steady 6.5% growth is propelled by demographic trends and energy-efficient technology adoption, while Australia’s 6.1% rate reflects its focus on organic food sectors and sustainable practices.
The report covers an in-depth analysis of 40+ countries; seven top-performing OECD countries are highlighted below.
Revenue from freeze drying in China is expected to grow at a CAGR of 11.9% from 2025 to 2035, driven by rapid industrial growth and expansion of pharmaceutical manufacturing capacity. Significant investments in biotechnology and food processing sectors provide strong demand for freeze drying technology. Government initiatives supporting sustainable preservation methods and R&D funding further boost growth. China's large population and rising health awareness accelerate consumer demand for freeze-dried products. The country's e-commerce platforms also enhance product accessibility, making China a key global hub for both manufacturing and consumption. Continuous technological advancements and competitive pricing strategies strengthen China's dominance in this market.
Sales for freeze drying in India is expected to projected to grow at a CAGR of 11.5% from 2025 to 2035, fueled primarily by its growing pharmaceutical and food processing sectors. Government programs aimed at enhancing cold chain infrastructure and localized production capacity support technology adoption. Urbanization and rising disposable incomes contribute to an expanding consumer base with higher demand for nutritious, ready-to-eat freeze-dried food products. SMEs and startups are also leveraging freeze drying to increase product shelf life and value for exports. Sustainable and energy-efficient equipment tailored for local needs are gaining traction. This overall industrial and consumer-driven expansion highlights India's market potential.
Demand for freeze drying in the UK is expected to grow at a CAGR of 7.8%from 2025 to 2035, backed by well-established pharmaceutical and food industries. Regulatory frameworks emphasizing product safety and quality standards drive investment in advanced freeze drying technologies. There is growing consumer preference for organic and natural freeze-dried foods, which fuels innovation and new product launches. Strong linkages between industries and academic research institutions facilitate development of novel processing techniques. Distribution channels are robust, allowing wide market penetration. Continued R&D and collaborations maintain the UK’s leadership within Europe’s freeze drying sector.
Sales for freeze drying in Germany is expected to grow at a CAGR of 7.2% from 2025 to 2035, driven by precision engineering leadership and innovation in freeze drying equipment manufacturing, supporting. The country’s thriving pharmaceutical and specialty food sectors require high-efficiency, automated freeze drying systems focused on energy conservation and sustainability. Strong export orientation, particularly to other European countries, enhances equipment demand. Emerging trends include incorporation of Industry 4.0 technologies and modular system designs. Government programs promoting energy-efficient manufacturing further spike investment. Germany remains a key player driving technological advancements in global freeze drying markets.
Revenue from freeze drying in the USA market is projected to grow at a CAGR of 6.8% from 2025 to 2035, supported by advanced pharmaceutical and biotechnology production infrastructure. The country is a pioneer in automated freeze drying equipment and digital controls, driving efficiency and compliance with FDA regulations. The food industry also contributes significantly with consumers increasingly seeking convenient and nutrient-enriched freeze dried products. Robust R&D funding and collaboration among manufacturers, academic centers, and research labs support continuous innovation. Regional hubs across different states support scalability and rapid technology adoption.
The freeze drying market in Japan is expected to expand at a CAGR of 6.5% from 2025 to 2035, stimulated by an aging population requiring nutritional and medicinal freeze dried products. Industrial focus on compact, energy-efficient, and miniaturized freeze drying technology supports market expansion. Japan’s high research intensity and adoption of new material sciences enhance biocompatible product drying innovations. Demand for exotic and premium freeze dried food products increases export opportunities. Government frameworks encourage food tech innovation and quality standards. Japan’s market growth reflects a synergy between demographic needs and technological prowess.
Revenue from freeze drying in Australia is expected to grow at a CAGR of 6.1% from 2025 to 2035, driven by rising demand in organic food production and growing food export sectors. Freeze drying is favored as a sustainable preservation method aligned with Australia’s clean and green brand image. The tourism sector’s preference for portable and lightweight foods also fuels domestic consumption. Government policies supporting agritech innovation and food industry optimization further promote adoption. Increasing industrial scaling and export quality requirements drive continuous investment in freeze drying equipment and technology.
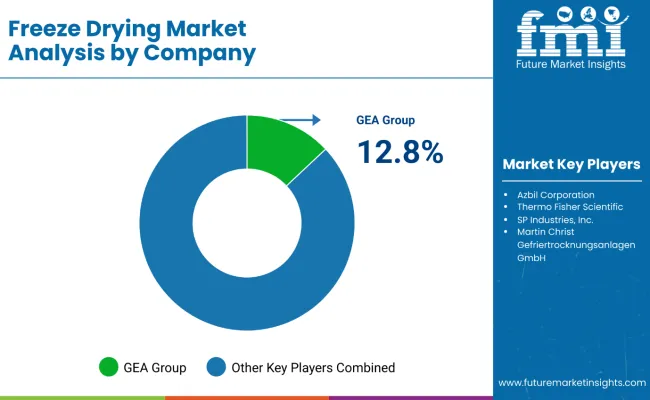
The market is moderately consolidated, featuring a mix of numerous established players competing across diverse product segments and geographic regions. Leading market participants include GEA Group Aktiengesellschaft, Azbil Corporation, SP Industries, Inc., Martin Christ Gefriertrocknungsanlagen GmbH, and Labconco Corporation, who collectively command significant market share through their comprehensive product portfolios and global distribution networks.
GEA Group maintains market leadership through its advanced industrial freeze dryers and comprehensive automation solutions, while Azbil Corporation leverages its Japanese engineering expertise to serve pharmaceutical and biotechnology sectors. German manufacturers like Martin Christ and HOF Sonderanlagenbau focus on precision engineering and customized solutions for pharmaceutical applications, establishing strong footholds in European markets.
The competitive dynamics are characterized by intensive R&D investments, with companies developing energy-efficient systems, IoT-enabled monitoring capabilities, and automated loading/unloading mechanisms to differentiate their offerings. Strategic partnerships with pharmaceutical manufacturers and contract research organizations strengthen market positioning, while expansion into emerging markets like China and India drives growth.
| Items | Values |
|---|---|
| Market Size (2025) | USD 1.3 billion |
| By Product Type | Dryer (Tray-Style Dryers, Rotary Freeze Dryers, Manifold Freeze Dryer) and Accessories (Drying Chamber, Vacuum System, CIP Systems, Others) |
| By Scale of Operations | Pilot-Scale, Laboratory-Scale, and Industrial-Scale |
| By Distribution Channel | Biopharmaceutical Companies, Food and Beverage Companies, Academic and Research Institutes, CRO & CMO, Hospitals, and Research Laboratories |
| Key Growth Regions | North America, Latin America, Western Europe, Eastern Europe, South Asia and Pacific, East Asia, and Middle East & Africa |
| Countries Covered | United States, Canada, United Kingdom, Germany, France, China, Japan, South Korea, India, Australia, Brazil, and 40+ countries |
| Key Companies Profiled | GEA Group; Azbil; SP Industries; Martin Christ Gefriertrocknungsanlagen; Labconco; Zirbus Technology; HOF Sonderanlagenbau; Millrock Technology; Cryotec (France); MechaTech Systems; Cuddon Freeze Dry; Neologic Engineers |
| Additional Attributes | Dollar sales by product type and scale of operations, adoption of energy-efficient and automated systems, expanding pharmaceutical manufacturing, advances in IoT-enabled monitoring, rising demand for biologics preservation, increasing food processing applications, growing contract manufacturing services |
The global freeze drying market is estimated to be valued at USD 1.3 billion in 2025.
The freeze drying market size is projected to reach USD 3.0 billion by 2035.
The freeze drying market is expected to grow at a 8.6% CAGR between 2025 and 2035.
The dryer segment is projected to lead in the freeze drying market with 68% market share in 2025.
In terms of distribution, the biopharmaceutical companies segment is expected to command 60% share in the freeze drying market in 2025.


Full Research Suite comprises of:
Market outlook & trends analysis
Interviews & case studies
Strategic recommendations
Vendor profiles & capabilities analysis
5-year forecasts
8 regions and 60+ country-level data splits
Market segment data splits
12 months of continuous data updates
DELIVERED AS:
PDF EXCEL ONLINE
Freeze Drying Equipment Market Size and Share Forecast Outlook 2025 to 2035
Freezer Label Market Size and Share Forecast Outlook 2025 to 2035
Freezer Liner Market Size and Share Forecast Outlook 2025 to 2035
Freeze Neutralising Kit Market Size and Share Forecast Outlook 2025 to 2035
Freeze Dried Fruit Powder Market Size and Share Forecast Outlook 2025 to 2035
Freeze-dried Food Market Analysis - Size, Growth, and Forecast 2025 to 2035
Freeze Dried Fruits Market Analysis - Size, Share, and Forecast Outlook 2025 to 2035
Freezer Paper Market Size and Share Forecast Outlook 2025 to 2035
Freeze Dried Fruits And Vegetables Market Size and Share Forecast Outlook 2025 to 2035
Freeze-Dried Vegetables Market Analysis - Size, Share, and Forecast Outlook 2025 to 2035
Freeze-Dried Pet Food Market Anlysis by Pet Type, Nature, Source, Process Type, and Sales Channel Through 2035
Freeze Dried Melt Market Analysis by Product Form, Fruit Type, Sales Channel, Packaging, , and Region Through 2035
Freezer Bags Market Growth, Trends and Demand from 2025 to 2035
Competitive Overview of Freeze Dried Fruits Market Share
Competitive Breakdown of Freezer Paper Manufacturers
Freezer Tape Market
UK Freeze Dried Fruits Market Insights – Size, Demand & Industry Growth 2025–2035
Antifreeze proteins Market Size and Share Forecast Outlook 2025 to 2035
Antifreeze Market Size and Share Forecast Outlook 2025 to 2035
USA Freeze Dried Fruits Market Growth – Innovations, Trends & Forecast 2025–2035

Thank you!
You will receive an email from our Business Development Manager. Please be sure to check your SPAM/JUNK folder too.
Chat With
MaRIA