Freeze-dried Food Market Size and Share Forecast Outlook 2025 to 2035

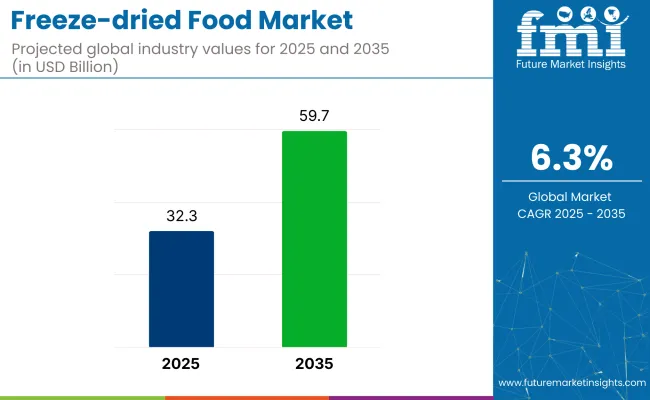
The global freeze-dried food market is valued at USD 32.3 billion in 2025 and is expected to reach USD 59.7 billion by 2035, registering a CAGR of 6.3%. The rising consumer demand for ready-to-eat and nutrient-dense food products with long shelf lives is driving the adoption of freeze-dried food globally.
Quick Stats for Freeze-Dried Food Market

  • Market Value (2025): USD 32.3 billion
  • Forecast Value (2035): USD 59.7 billion
  • Forecast CAGR: 6.3%
  • Form Leader in 2025: Powdered Freeze-Dried Fruits (48% Market Share)
  • Top Nature Segment: Conventional (85% Market Share)
  • Key Growth Region: North America (fastest-growing market in the USA with 5.3% CAGR)

Freeze Dried Food Market

Metric Value
Estimated Size (2025) USD 32.3 billion
Projected Value (2035) USD 59.7 billion
CAGR (2025 to 2035) 6.3%

Key factors supporting this growth include busy lifestyles, increasing reliance on emergency food supplies, and strong demand from sectors such as bakeries, beverages, and snacks. In particular, freeze-dried fruits and vegetables are gaining prominence due to their ability to retain most nutrients and flavor without refrigeration.

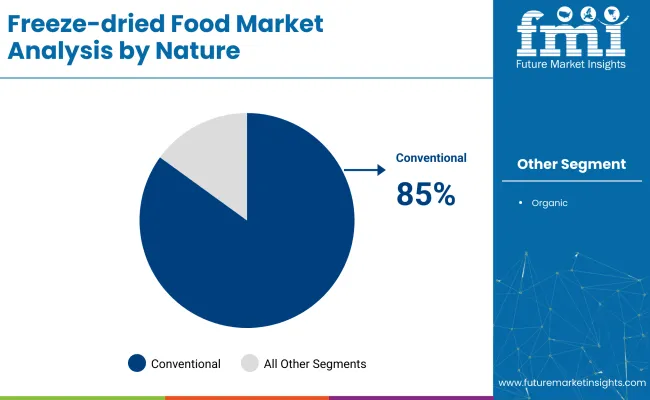
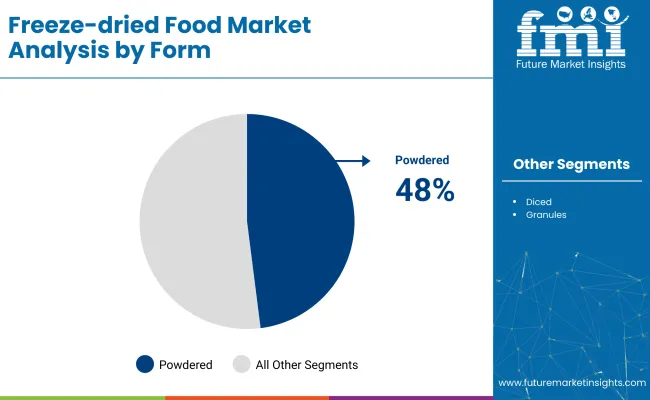
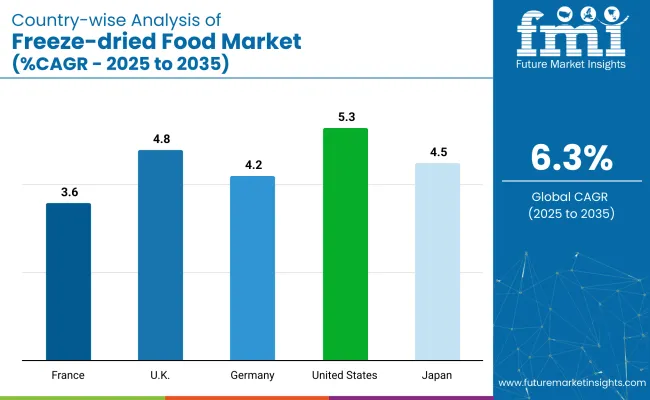
In 2025, the United States is projected to remain the largest market for freeze-dried food, contributing to North American sales. The market in the USA is expected to grow at a CAGR of 5.3%. Meanwhile, the UK and Japan closely follow this growth with CAGRs of 4.8% and 4.5% respectively. Powdered freeze-dried fruits are anticipated to maintain dominance in formtypewith 48% of the market share, while,by nature, conventional products hold a prominent share of 85% in 2025.

The market holds a notable share across several parent markets due to its unique advantages, like extended shelf life and nutrient retention. It accounts for approximately 6-8% of the global processed food market and nearly 10% of the convenience food segment, driven by rising demand for ready-to-eat options.

Within the functional food market, it represents around 4-5%, primarily through fortified freeze-dried fruits and vegetables. In the emergency and survival food market, freeze-dried products dominate with over 35% share, owing to their longevity and portability. Its share in the snack food category stands at an estimated 3-4%.

Analyzing Freeze-dried Food Market by Top Investment Segments

The global market is segmented into product type, nature, form, and region. Under product type, it includes fruits (strawberry, raspberry, pineapple, apple, mango, and other fruits), vegetables (carrot, potato, corn, pea, mushroom, and other vegetables), freeze-dried dairy products, freeze-dried meat & seafood, freeze-dried pet food, and prepared meals.

The nature segment comprises organic and conventional. The form segment includes powdered, granules, and diced. The regional analysis spans North America, Latin America, Europe, East Asia, South Asia, Oceania, the Middle East and Africa.

By Product Type, Fruits Account for 40% of the Market Share in 2025

Fruits are expected to remain the most lucrative product type, accounting for over 40% of market share in 2025. Their widespread use in snacks, cereals, bakery, and dietary products is driving adoption. Among fruits, strawberries and apples are preferred due to their versatility, natural sweetness, and long shelf life. These fruits retain flavor and nutritional value after freeze-drying, making them highly suitable for health-conscious consumers and foodservice applications.
  • High demand in B2B channels such as cereals and confectionery.
  • Strawberry and apple lead due to consumer familiarity and versatility.
  • Increasing use in functional and clean-label foods.

By Nature, Conventional Products Hold the Largest Share of 85% in 2025

The conventional segment is projected to retain dominance with a share of around 85% in 2025. Cost-effectiveness and wide availability make conventional freeze-dried food more accessible to large-scale manufacturers and foodservice providers. While organic products are gaining traction, their higher price point and limited sourcing still restrict widespread adoption across middle-income economies.
  • Broad availability and lower production cost are driving uptake.
  • The organic segment is growing, but is still niche in developing regions.
  • Health awareness is fueling a gradual shift to organic in developed markets.

Freeze Dried Food Market Analysis By Nature

By Form, Powdered Freeze-dried Food Accounts for 48% Market Share

Powdered freeze-dried food is set to lead the form segment with nearly 48% share in 2025, owing to its application in beverages, infant nutrition, and functional foods. Powders offer excellent solubility and shelf stability, making them a preferred format for both B2B and retail users. They are also easy to transport and mix with liquids or recipes, enhancing convenience.
  • Strong demand in health drinks, baby food, and supplements.
  • Excellent solubility and long shelf life.
  • Ideal for high-volume industrial applications.

Freeze Dried Food Market Analysis By Form

Top Freeze-dried Food Market Dynamics

Recent Trends in the Freeze-dried Food Market

  • Rising adoption of eco-friendly and compostable packaging is driven by sustainability goals.
  • Increased demand for whole freeze-dried fruits in B2B applications such as cereal, bakery, and confectionery.
  • Integration of culinary traditions and global flavors in freeze-dried meat and protein products.
  • Advancements in freeze-drying technologies like vacuum freeze-drying and controlled ice nucleation for better product quality.

Key Challenges in the Freeze-dried Food Market

  • High energy costs and the capital-intensive nature of freeze-drying technology.
  • Price sensitivity in developing regions limits the adoption of premium freeze-dried products.
  • Stringent environmental regulations around production and packaging in Europe.
  • Limited consumer awareness in rural and low-income areas about freeze-dried food benefits.

Analyzing Top Countries Producing and Supplying Freeze-dried Food

Country Wise Analysis Of Freeze Dried Food Market

Among the top five countries, the USA leads the freeze-dried food market with a CAGR of 5.3% from 2025 to 2035, supported by a robust food processing industry and demand for emergency and clean-label products. Japan follows with a 4.5% CAGR, driven by innovation and demand for convenience foods.

The UK posts steady growth at 4.8%, fueled by plant-based and minimally processed food trends. Germany shows a 4.2% CAGR, backed by advanced manufacturing capabilities, while France exhibits the slowest growth at 3.6%, due to a national preference for fresh and refrigerated food options.

The report covers an in-depth analysis of 40+ countries; five top-performing OECD countries are highlighted below.

United States Freeze-dried Food Market Analysis

The freeze-dried food revenue in the USA is projected to grow at a CAGR of 5.3% from 2025 to 2035. The USA continues to lead the global market owing to a mature food processing industry, high demand for emergency and long-shelf-life foods, and increasing consumer preference for clean-label, preservative-free ingredients.

Widespread adoption of freeze-dried products in meal kits, snacks, and beverages is fueling market expansion. Additionally, strong B2B demand from bakeries and health food manufacturers is contributing to steady growth.

  • Growing awareness of health and fitness among the population.
  • Robust demand from bakery, nutrition, and camping food sectors.
  • Expanding retail presence through e-commerce platforms.

Freeze-dried Food Demand Analysis in the UK

The UK freeze-dried food market is anticipated to expand at a CAGR of 4.8% between 2025 and 2035. Growth is being driven by increasing consumption of ready-to-eat and shelf-stable foods, particularly in urban areas. The UK’s growing vegan and health-conscious population prefers freeze-dried fruit and vegetable ingredients in cereals, smoothies, and snacks. Regulatory emphasis on sustainable packaging and reduced food waste is pushing innovation.

  • Increasing demand for clean-label, minimally processed foods.
  • Consumer interest in plant-based and vegan snack options.
  • Strong innovation in eco-conscious food packaging.

Germany Freeze-dried Food Sales Analysis

The revenue from freeze-dried food in Germany is forecasted to register a CAGR of 4.2% during the 2025 to 2035 period. A well-established processed food industry, combined with growing demand for nutrient-rich snack alternatives, is supporting market growth. Freeze-dried fruits and vegetables are being widely adopted in dairy products, breakfast cereals, and sports nutrition. Germany’s technological edge in food manufacturing supports high-quality output.

  • Advanced food processing capabilities ensure consistent product quality.
  • Consumer shift toward natural, additive-free nutrition.
  • Strict environmental compliance promoting green production.

Freeze-dried Food Demand Analysis in France

The sales of freeze-dried food in France are expected to grow at a CAGR of 3.6% from 2025 to 2035. France’s market remains moderate due to a strong preference for fresh and refrigerated foods. Nonetheless, rising interest in organic and functional food options is gradually increasing the demand for freeze-dried fruits and vegetables. Growth is also supported by innovation in gourmet freeze-dried products and France’s participation in international food aid and emergency supply programs.

  • Increasing demand for organic and clean-label foods.
  • Export-oriented manufacturers supporting emergency food sectors.
  • Steady innovation in gourmet freeze-dried meal offerings.

Japan Freeze-dried Food Industry Analysis

The freeze-dried food market in Japan is projected to flourish at a CAGR of 4.5% between 2025 and 2035. The country’s strong emphasis on technology, quality, and convenience has driven widespread adoption of freeze-dried foods in soups, instant meals, and health snacks.
  • High adoption of freeze-dried soups and functional snacks.
  • Favorable market for single-serve, long-lasting food formats.
  • Technological innovation ensures flavor and texture retention.

Leading Freeze-dried Food Suppliers

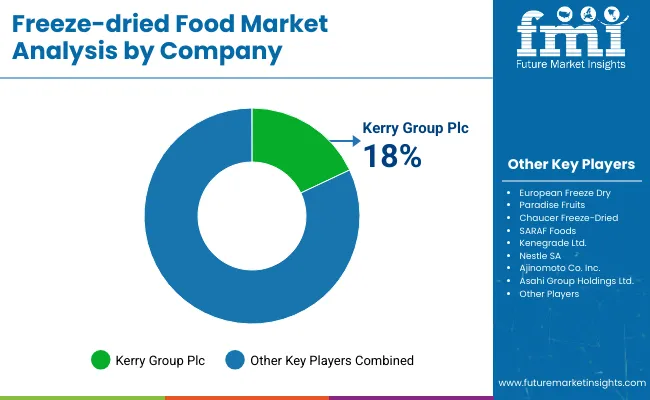
The market is highly fragmented, with a mix of multinational corporations, mid-sized regional players, and niche-focused startups competing for share. Top-tier companies like Nestlé SA, Kerry Group Plc, Mondelez International, and Unilever Group hold a significant portion of the market by leveraging extensive distribution networks, product diversification, and global manufacturing capabilities. Mid-level firms such as European Freeze Dry and Mercer Foods are building regional dominance by focusing on specific consumer segments and contract manufacturing services.

Competitive strategies in this space revolve around product innovation, clean-label offerings, pricing efficiency, and sustainability initiatives. Leading brands are enhancing their freeze-drying capabilities to improve flavor retention, nutrient preservation, and shelf stability.

Firms are also investing in eco-friendly packaging and organic sourcing to meet growing consumer demand for sustainable, health-conscious options. Partnerships, new product launches for dietary and emergency-preparedness markets, and geographical expansion into emerging economies are driving competitive advantage among the top players.

Recent Freeze-dried Food Industry News

In December 2024, Unilever unveiled an agreement to acquire Unox and Zwan brands. It secured a binding offer from Zwanenberg Food Group.

Freeze-dried Food Market Report Scope

Report Attributes Details
Current Total Market Size (2025) USD 32.3 billion
Projected Market Size (2035) USD 59.7 billion
CAGR (2025 to 2035) 6.3%
Base Year for Estimation 2024
Historical Period 2020 to 2024
Projections Period 2025 to 2035
Market Analysis Parameters Revenue in USD billions/Volume in kilotons
By Product Type Fruits (Strawberry, Raspberry, Pineapple, Apple, Mango, Others), Vegetables (Carrot, Potato, Corn, Pea, Mushroom, Others), Freeze-Dried Dairy Products, Freeze-Dried Meat & Seafood, Freeze-Dried Pet Food, Prepared Meals
By Nature Organic, Conventional
By Form Powdered, Granules, Diced
Regions Covered North America, Latin America, Europe, East Asia, South Asia, Oceania, the Middle East and Africa
Countries Covered United States, Canada, United Kingdom, Germany, France, China, Japan, South Korea, Brazil, Australia
Key Players Kerry Group Plc, European Freeze Dry, Paradise Fruits, Chaucer Freeze-Dried, SARAF Foods, Kenegrade Ltd., Nestle SA, Ajinomoto Co. Inc., Asahi Group Holdings Ltd., Harmony House Foods Inc., Lyofood Sp. zo.o ., Mercer Foods LLC, Nuts.com, The Kraft Heinz Co., Freeze Dry Foods LLC, Mondelez International Inc., SouthAm Freeze Dry, The Hain Celestial Group Inc., Molda AG, Unilever Group
Additional Attributes Dollar sales by value, market share analysis by region, and country-wise analysis

Key Segmentation

By Product Type:

Global freeze-dried food category is segmented as Fruits (Strawberry, Raspberry, Pineapple, Apple, Mango, Other Fruits), Vegetables (Carrot, Potato, Corn, Pea, Mushroom, Other Vegetables), Freeze-Dried Dairy Product, Freeze-Dried Meat and Seafood, Freeze-Dried Pet Food, Prepared Meal

By Nature:

The industry is further segmented as Organic and Conventional

By Form:

The segment further includes as Powdered, Granules and Diced

By End Use:

This segment further includes Food & Beverages Products (Breakfast Cereals, Dairy Products, Bakery & Confectionery, Nutritional Bars & Supplements, Powdered Beverages, and Snacks) and Retail (household)

By Distribution Channel:

By distribution channel it is further segmented as B2B and B2C (Hypermarkets/Supermarkets, Convenience Store, Specialty Store, Food & Drinks Specialty Store, Independent Small Grocery Store, Online Retail)

By Region:

Industry analysis has been carried out in key countries of North America, Latin America, Europe, East Asia, South Asia, Oceania and Middle East & Africa

Table of Content

  1. Executive Summary
    • Global Market Outlook
    • Demand-side Trends
    • Supply-side Trends
    • Technology Roadmap Analysis
    • Analysis and Recommendations
  2. Market Overview
    • Market Coverage/Taxonomy
    • Market Definition/Scope/Limitations
  3. Market Background
    • Market Dynamics
      • Drivers
      • Restraints
      • Opportunity
      • Trends
    • Scenario Forecast
      • Demand in Optimistic Scenario
      • Demand in Likely Scenario
      • Demand in Conservative Scenario
    • Opportunity Map Analysis
    • Product Life Cycle Analysis
    • Supply Chain Analysis
      • Supply Side Participants and their Roles
        • Producers
        • Mid-Level Participants (Traders/ Agents/ Brokers)
        • Wholesalers and Distributors
      • Value Added and Value Created at Node in the Supply Chain
      • List of Raw Material Suppliers
      • List of Existing and Potential Buyer’s
    • Investment Feasibility Matrix
    • Value Chain Analysis
      • Profit Margin Analysis
      • Wholesalers and Distributors
      • Retailers
    • PESTLE and Porter’s Analysis
    • Regulatory Landscape
      • By Key Regions
      • By Key Countries
    • Regional Parent Market Outlook
    • Production and Consumption Statistics
    • Import and Export Statistics
  4. Global Market Analysis 2020 to 2024 and Forecast, 2025 to 2035
    • Historical Market Size Value (USD Billion) & Volume (Kilotons) Analysis, 2020 to 2024
    • Current and Future Market Size Value (USD Billion) & Volume (Kilotons) Projections, 2025 to 2035
      • Y-o-Y Growth Trend Analysis
      • Absolute $ Opportunity Analysis
  5. Global Market Pricing Analysis 2020 to 2024 and Forecast 2025 to 2035
  6. Global Market Analysis 2020 to 2024 and Forecast 2025 to 2035, By Product Type
    • Introduction/Key Findings
    • Historical Market Size Value (USD Billion) & Volume (Kilotons) Analysis By Product Type, 2020 to 2024
    • Current and Future Market Size Value (USD Billion) & Volume (Kilotons) Analysis and Forecast By Product Type, 2025 to 2035
      • Fruits
        • Strawberry
        • Raspberry
        • Pineapple
        • Apple
        • Mango
        • Other Fruits
      • Vegetables
        • Carrot
        • Potato
        • Corn
        • Pea
        • Mushroom
        • Other Vegetables
      • Freeze-Dried Dairy Products
      • Freeze-Dried Meat & Seafood
      • Freeze-Dried Pet Food
      • Prepared Meal
    • Y-o-Y Growth Trend Analysis By Product Type, 2020 to 2024
    • Absolute $ Opportunity Analysis By Product Type, 2025 to 2035
  7. Global Market Analysis 2020 to 2024 and Forecast 2025 to 2035, By Nature
    • Introduction/Key Findings
    • Historical Market Size Value (USD Billion) & Volume (Kilotons) Analysis By Nature, 2020 to 2024
    • Current and Future Market Size Value (USD Billion) & Volume (Kilotons) Analysis and Forecast By Nature, 2025 to 2035
      • Organic
      • Conventional
    • Y-o-Y Growth Trend Analysis By Nature, 2020 to 2024
    • Absolute $ Opportunity Analysis By Nature, 2025 to 2035
  8. Global Market Analysis 2020 to 2024 and Forecast 2025 to 2035, By Form
    • Introduction/Key Findings
    • Historical Market Size Value (USD Billion) & Volume (Kilotons) Analysis By Form, 2020 to 2024
    • Current and Future Market Size Value (USD Billion) & Volume (Kilotons) Analysis and Forecast By Form, 2025 to 2035
      • Powdered
      • Granules
      • Diced
    • Y-o-Y Growth Trend Analysis By Form, 2020 to 2024
    • Absolute $ Opportunity Analysis By Form, 2025 to 2035
  9. Global Market Analysis 2020 to 2024 and Forecast 2025 to 2035, By Region
    • Introduction
    • Historical Market Size Value (USD Billion) & Volume (Kilotons) Analysis By Region, 2020 to 2024
    • Current Market Size Value (USD Billion) & Volume (Kilotons) Analysis and Forecast By Region, 2025 to 2035
      • North America
      • Latin America
      • Western Europe
      • Eastern Europe
      • East Asia
      • South Asia & Pacific
      • Middle East and Africa
    • Market Attractiveness Analysis By Region
  10. North America Market Analysis 2020 to 2024 and Forecast 2025 to 2035, By Country
    • Historical Market Size Value (USD Billion) & Volume (Kilotons) Trend Analysis By Market Taxonomy, 2020 to 2024
    • Market Size Value (USD Billion) & Volume (Kilotons) Forecast By Market Taxonomy, 2025 to 2035
      • By Country
        • USA
        • Canada
        • Mexico
      • By Product Type
      • By Nature
      • By Form
    • Market Attractiveness Analysis
      • By Country
      • By Product Type
      • By Nature
      • By Form
    • Key Takeaways
  11. Latin America Market Analysis 2020 to 2024 and Forecast 2025 to 2035, By Country
    • Historical Market Size Value (USD Billion) & Volume (Kilotons) Trend Analysis By Market Taxonomy, 2020 to 2024
    • Market Size Value (USD Billion) & Volume (Kilotons) Forecast By Market Taxonomy, 2025 to 2035
      • By Country
        • Brazil
        • Argentina
        • Rest of LATAM
      • By Product Type
      • By Nature
      • By Form
    • Market Attractiveness Analysis
      • By Country
      • By Product Type
      • By Nature
      • By Form
    • Key Takeaways
  12. Western Europe Market Analysis 2020 to 2024 and Forecast 2025 to 2035, By Country
    • Historical Market Size Value (USD Billion) & Volume (Kilotons) Trend Analysis By Market Taxonomy, 2020 to 2024
    • Market Size Value (USD Billion) & Volume (Kilotons) Forecast By Market Taxonomy, 2025 to 2035
      • By Country
        • Germany
        • Italy
        • France
        • UK
        • Spain
        • BENELUX
        • Nordic
        • Rest of W.Europe
      • By Product Type
      • By Nature
      • By Form
    • Market Attractiveness Analysis
      • By Country
      • By Product Type
      • By Nature
      • By Form
    • Key Takeaways
  13. Eastern Europe Market Analysis 2020 to 2024 and Forecast 2025 to 2035, By Country
    • Historical Market Size Value (USD Billion) & Volume (Kilotons) Trend Analysis By Market Taxonomy, 2020 to 2024
    • Market Size Value (USD Billion) & Volume (Kilotons) Forecast By Market Taxonomy, 2025 to 2035
      • By Country
        • Russia
        • Hungary
        • Poland
        • Balkan & Baltics
        • Rest of E. Europe
      • By Product Type
      • By Nature
      • By Form
    • Market Attractiveness Analysis
      • By Country
      • By Product Type
      • By Nature
      • By Form
    • Key Takeaways
  14. East Asia Market Analysis 2020 to 2024 and Forecast 2025 to 2035, By Country
    • Historical Market Size Value (USD Billion) & Volume (Kilotons) Trend Analysis By Market Taxonomy, 2020 to 2024
    • Market Size Value (USD Billion) & Volume (Kilotons) Forecast By Market Taxonomy, 2025 to 2035
      • By Country
        • China
        • Japan
        • South Korea
      • By Product Type
      • By Nature
      • By Form
    • Market Attractiveness Analysis
      • By Country
      • By Product Type
      • By Nature
      • By Form
    • Key Takeaways
  15. South Asia & Pacific Market Analysis 2020 to 2024 and Forecast 2025 to 2035, By Country
    • Historical Market Size Value (USD Billion) & Volume (Kilotons) Trend Analysis By Market Taxonomy, 2020 to 2024
    • Market Size Value (USD Billion) & Volume (Kilotons) Forecast By Market Taxonomy, 2025 to 2035
      • By Country
        • India
        • Australia & New Zealand
        • ASEAN
        • Rest of SAP
      • By Product Type
      • By Nature
      • By Form
    • Market Attractiveness Analysis
      • By Country
      • By Product Type
      • By Nature
      • By Form
    • Key Takeaways
  16. Middle East and Africa Market Analysis 2020 to 2024 and Forecast 2025 to 2035, By Country
    • Historical Market Size Value (USD Billion) & Volume (Kilotons) Trend Analysis By Market Taxonomy, 2020 to 2024
    • Market Size Value (USD Billion) & Volume (Kilotons) Forecast By Market Taxonomy, 2025 to 2035
      • By Country
        • GCC Countries
        • Northern Africa
        • South Africa
        • Turkiye
        • Rest of MEA
      • By Product Type
      • By Nature
      • By Form
    • Market Attractiveness Analysis
      • By Country
      • By Product Type
      • By Nature
      • By Form
    • Key Takeaways
  17. Key Countries Market Analysis
    • USA
      • Pricing Analysis
      • Market Share Analysis, 2024
        • By Product Type
        • By Nature
        • By Form
    • Canada
      • Pricing Analysis
      • Market Share Analysis, 2024
        • By Product Type
        • By Nature
        • By Form
    • Brazil
      • Pricing Analysis
      • Market Share Analysis, 2024
        • By Product Type
        • By Nature
        • By Form
    • Mexico
      • Pricing Analysis
      • Market Share Analysis, 2024
        • By Product Type
        • By Nature
        • By Form
    • Argentina
      • Pricing Analysis
      • Market Share Analysis, 2024
        • By Product Type
        • By Nature
        • By Form
  18. Market Structure Analysis
    • Competition Dashboard
    • Competition Benchmarking
    • Market Share Analysis of Top Players
      • By Regional
      • By Product Type
      • By Nature
      • By Form
  19. Competition Analysis
    • Competition Deep Dive
      • Kerry Group Plc
        • Overview
        • Product Portfolio
        • Profitability by Market Segments (Product/Age /Sales Channel/Region)
        • Sales Footprint
        • Strategy Overview
          • Marketing Strategy
          • Product Strategy
          • Channel Strategy
      • European Freeze Dry
        • Overview
        • Product Portfolio
        • Profitability by Market Segments (Product/Age /Sales Channel/Region)
        • Sales Footprint
        • Strategy Overview
          • Marketing Strategy
          • Product Strategy
          • Channel Strategy
      • Paradise Fruits
        • Overview
        • Product Portfolio
        • Profitability by Market Segments (Product/Age /Sales Channel/Region)
        • Sales Footprint
        • Strategy Overview
          • Marketing Strategy
          • Product Strategy
          • Channel Strategy
      • Chaucer Freeze-Dried
        • Overview
        • Product Portfolio
        • Profitability by Market Segments (Product/Age /Sales Channel/Region)
        • Sales Footprint
        • Strategy Overview
          • Marketing Strategy
          • Product Strategy
          • Channel Strategy
      • SARAF Foods
        • Overview
        • Product Portfolio
        • Profitability by Market Segments (Product/Age /Sales Channel/Region)
        • Sales Footprint
        • Strategy Overview
          • Marketing Strategy
          • Product Strategy
          • Channel Strategy
      • Kenegrade Ltd.
        • Overview
        • Product Portfolio
        • Profitability by Market Segments (Product/Age /Sales Channel/Region)
        • Sales Footprint
        • Strategy Overview
          • Marketing Strategy
          • Product Strategy
          • Channel Strategy
      • Nestle SA
        • Overview
        • Product Portfolio
        • Profitability by Market Segments (Product/Age /Sales Channel/Region)
        • Sales Footprint
        • Strategy Overview
          • Marketing Strategy
          • Product Strategy
          • Channel Strategy
      • Ajinomoto Co. Inc.
        • Overview
        • Product Portfolio
        • Profitability by Market Segments (Product/Age /Sales Channel/Region)
        • Sales Footprint
        • Strategy Overview
          • Marketing Strategy
          • Product Strategy
          • Channel Strategy
      • Asahi Group Holdings Ltd.
        • Overview
        • Product Portfolio
        • Profitability by Market Segments (Product/Age /Sales Channel/Region)
        • Sales Footprint
        • Strategy Overview
          • Marketing Strategy
          • Product Strategy
          • Channel Strategy
      • Harmony House Foods Inc.
        • Overview
        • Product Portfolio
        • Profitability by Market Segments (Product/Age /Sales Channel/Region)
        • Sales Footprint
        • Strategy Overview
          • Marketing Strategy
          • Product Strategy
          • Channel Strategy
      • Lyofood Sp. z o.o.
        • Overview
        • Product Portfolio
        • Profitability by Market Segments (Product/Age /Sales Channel/Region)
        • Sales Footprint
        • Strategy Overview
          • Marketing Strategy
          • Product Strategy
          • Channel Strategy
      • Mercer Foods LLC
        • Overview
        • Product Portfolio
        • Profitability by Market Segments (Product/Age /Sales Channel/Region)
        • Sales Footprint
        • Strategy Overview
          • Marketing Strategy
          • Product Strategy
          • Channel Strategy
      • Nuts.com
        • Overview
        • Product Portfolio
        • Profitability by Market Segments (Product/Age /Sales Channel/Region)
        • Sales Footprint
        • Strategy Overview
          • Marketing Strategy
          • Product Strategy
          • Channel Strategy
      • The Kraft Heinz Co.
        • Overview
        • Product Portfolio
        • Profitability by Market Segments (Product/Age /Sales Channel/Region)
        • Sales Footprint
        • Strategy Overview
          • Marketing Strategy
          • Product Strategy
          • Channel Strategy
      • Freeze Dry Foods LLC
        • Overview
        • Product Portfolio
        • Profitability by Market Segments (Product/Age /Sales Channel/Region)
        • Sales Footprint
        • Strategy Overview
          • Marketing Strategy
          • Product Strategy
          • Channel Strategy
      • Mondelez International Inc.
        • Overview
        • Product Portfolio
        • Profitability by Market Segments (Product/Age /Sales Channel/Region)
        • Sales Footprint
        • Strategy Overview
          • Marketing Strategy
          • Product Strategy
          • Channel Strategy
      • SouthAm Freeze Dry
        • Overview
        • Product Portfolio
        • Profitability by Market Segments (Product/Age /Sales Channel/Region)
        • Sales Footprint
        • Strategy Overview
          • Marketing Strategy
          • Product Strategy
          • Channel Strategy
      • The Hain Celestial Group Inc.
        • Overview
        • Product Portfolio
        • Profitability by Market Segments (Product/Age /Sales Channel/Region)
        • Sales Footprint
        • Strategy Overview
          • Marketing Strategy
          • Product Strategy
          • Channel Strategy
      • Molda AG
        • Overview
        • Product Portfolio
        • Profitability by Market Segments (Product/Age /Sales Channel/Region)
        • Sales Footprint
        • Strategy Overview
          • Marketing Strategy
          • Product Strategy
          • Channel Strategy
      • Unilever Group
        • Overview
        • Product Portfolio
        • Profitability by Market Segments (Product/Age /Sales Channel/Region)
        • Sales Footprint
        • Strategy Overview
          • Marketing Strategy
          • Product Strategy
          • Channel Strategy
  20. Assumptions & Acronyms Used
  21. Research Methodology

List of Tables

  • Table 1: Global Market Value (USD Billion) Forecast by Region, 2020-2035
  • Table 2: Global Market Volume (Kilotons) Forecast by Region, 2020-2035
  • Table 3: Global Market Value (USD Billion) Forecast by Product Type, 2020-2035
  • Table 4: Global Market Volume (Kilotons) Forecast by Product Type, 2020-2035
  • Table 5: Global Market Value (USD Billion) Forecast by Nature, 2020-2035
  • Table 6: Global Market Volume (Kilotons) Forecast by Nature, 2020-2035
  • Table 7: Global Market Value (USD Billion) Forecast by Form, 2020-2035
  • Table 8: Global Market Volume (Kilotons) Forecast by Form, 2020-2035
  • Table 9: North America Market Value (USD Billion) Forecast by Country, 2020-2035
  • Table 10: North America Market Volume (Kilotons) Forecast by Country, 2020-2035
  • Table 11: North America Market Value (USD Billion) Forecast by Product Type, 2020-2035
  • Table 12: North America Market Volume (Kilotons) Forecast by Product Type, 2020-2035
  • Table 13: North America Market Value (USD Billion) Forecast by Nature, 2020-2035
  • Table 14: North America Market Volume (Kilotons) Forecast by Nature, 2020-2035
  • Table 15: North America Market Value (USD Billion) Forecast by Form, 2020-2035
  • Table 16: North America Market Volume (Kilotons) Forecast by Form, 2020-2035
  • Table 17: Latin America Market Value (USD Billion) Forecast by Country, 2020-2035
  • Table 18: Latin America Market Volume (Kilotons) Forecast by Country, 2020-2035
  • Table 19: Latin America Market Value (USD Billion) Forecast by Product Type, 2020-2035
  • Table 20: Latin America Market Volume (Kilotons) Forecast by Product Type, 2020-2035
  • Table 21: Latin America Market Value (USD Billion) Forecast by Nature, 2020-2035
  • Table 22: Latin America Market Volume (Kilotons) Forecast by Nature, 2020-2035
  • Table 23: Latin America Market Value (USD Billion) Forecast by Form, 2020-2035
  • Table 24: Latin America Market Volume (Kilotons) Forecast by Form, 2020-2035
  • Table 25: Western Europe Market Value (USD Billion) Forecast by Country, 2020-2035
  • Table 26: Western Europe Market Volume (Kilotons) Forecast by Country, 2020-2035
  • Table 27: Western Europe Market Value (USD Billion) Forecast by Product Type, 2020-2035
  • Table 28: Western Europe Market Volume (Kilotons) Forecast by Product Type, 2020-2035
  • Table 29: Western Europe Market Value (USD Billion) Forecast by Nature, 2020-2035
  • Table 30: Western Europe Market Volume (Kilotons) Forecast by Nature, 2020-2035
  • Table 31: Western Europe Market Value (USD Billion) Forecast by Form, 2020-2035
  • Table 32: Western Europe Market Volume (Kilotons) Forecast by Form, 2020-2035
  • Table 33: Eastern Europe Market Value (USD Billion) Forecast by Country, 2020-2035
  • Table 34: Eastern Europe Market Volume (Kilotons) Forecast by Country, 2020-2035
  • Table 35: Eastern Europe Market Value (USD Billion) Forecast by Product Type, 2020-2035
  • Table 36: Eastern Europe Market Volume (Kilotons) Forecast by Product Type, 2020-2035
  • Table 37: Eastern Europe Market Value (USD Billion) Forecast by Nature, 2020-2035
  • Table 38: Eastern Europe Market Volume (Kilotons) Forecast by Nature, 2020-2035
  • Table 39: Eastern Europe Market Value (USD Billion) Forecast by Form, 2020-2035
  • Table 40: Eastern Europe Market Volume (Kilotons) Forecast by Form, 2020-2035
  • Table 41: East Asia Market Value (USD Billion) Forecast by Country, 2020-2035
  • Table 42: East Asia Market Volume (Kilotons) Forecast by Country, 2020-2035
  • Table 43: East Asia Market Value (USD Billion) Forecast by Product Type, 2020-2035
  • Table 44: East Asia Market Volume (Kilotons) Forecast by Product Type, 2020-2035
  • Table 45: East Asia Market Value (USD Billion) Forecast by Nature, 2020-2035
  • Table 46: East Asia Market Volume (Kilotons) Forecast by Nature, 2020-2035
  • Table 47: East Asia Market Value (USD Billion) Forecast by Form, 2020-2035
  • Table 48: East Asia Market Volume (Kilotons) Forecast by Form, 2020-2035
  • Table 49: South Asia & Pacific Market Value (USD Billion) Forecast by Country, 2020-2035
  • Table 50: South Asia & Pacific Market Volume (Kilotons) Forecast by Country, 2020-2035
  • Table 51: South Asia & Pacific Market Value (USD Billion) Forecast by Product Type, 2020-2035
  • Table 52: South Asia & Pacific Market Volume (Kilotons) Forecast by Product Type, 2020-2035
  • Table 53: South Asia & Pacific Market Value (USD Billion) Forecast by Nature, 2020-2035
  • Table 54: South Asia & Pacific Market Volume (Kilotons) Forecast by Nature, 2020-2035
  • Table 55: South Asia & Pacific Market Value (USD Billion) Forecast by Form, 2020-2035
  • Table 56: South Asia & Pacific Market Volume (Kilotons) Forecast by Form, 2020-2035
  • Table 57: Middle East and Africa Market Value (USD Billion) Forecast by Country, 2020-2035
  • Table 58: Middle East and Africa Market Volume (Kilotons) Forecast by Country, 2020-2035
  • Table 59: Middle East and Africa Market Value (USD Billion) Forecast by Product Type, 2020-2035
  • Table 60: Middle East and Africa Market Volume (Kilotons) Forecast by Product Type, 2020-2035
  • Table 61: Middle East and Africa Market Value (USD Billion) Forecast by Nature, 2020-2035
  • Table 62: Middle East and Africa Market Volume (Kilotons) Forecast by Nature, 2020-2035
  • Table 63: Middle East and Africa Market Value (USD Billion) Forecast by Form, 2020-2035
  • Table 64: Middle East and Africa Market Volume (Kilotons) Forecast by Form, 2020-2035

List of Figures

  • Figure 1: Global Market Volume (Kilotons) Forecast 2020-2035
  • Figure 2: Global Market Pricing Analysis
  • Figure 3: Global Market Value (USD Billion) Forecast 2020-2035
  • Figure 4: Global Market Value Share and BPS Analysis by Product Type, 2025 and 2035
  • Figure 5: Global Market Y-o-Y Growth Comparison by Product Type, 2025-2035
  • Figure 6: Global Market Attractiveness Analysis by Product Type
  • Figure 7: Global Market Value Share and BPS Analysis by Nature, 2025 and 2035
  • Figure 8: Global Market Y-o-Y Growth Comparison by Nature, 2025-2035
  • Figure 9: Global Market Attractiveness Analysis by Nature
  • Figure 10: Global Market Value Share and BPS Analysis by Form, 2025 and 2035
  • Figure 11: Global Market Y-o-Y Growth Comparison by Form, 2025-2035
  • Figure 12: Global Market Attractiveness Analysis by Form
  • Figure 13: Global Market Value (USD Billion) Share and BPS Analysis by Region, 2025 and 2035
  • Figure 14: Global Market Y-o-Y Growth Comparison by Region, 2025-2035
  • Figure 15: Global Market Attractiveness Analysis by Region
  • Figure 16: North America Market Incremental $ Opportunity, 2025-2035
  • Figure 17: Latin America Market Incremental $ Opportunity, 2025-2035
  • Figure 18: Western Europe Market Incremental $ Opportunity, 2025-2035
  • Figure 19: Eastern Europe Market Incremental $ Opportunity, 2025-2035
  • Figure 20: East Asia Market Incremental $ Opportunity, 2025-2035
  • Figure 21: South Asia & Pacific Market Incremental $ Opportunity, 2025-2035
  • Figure 22: Middle East and Africa Market Incremental $ Opportunity, 2025-2035
  • Figure 23: North America Market Value Share and BPS Analysis by Country, 2025 and 2035
  • Figure 24: North America Market Value Share and BPS Analysis by Product Type, 2025 and 2035
  • Figure 25: North America Market Y-o-Y Growth Comparison by Product Type, 2025-2035
  • Figure 26: North America Market Attractiveness Analysis by Product Type
  • Figure 27: North America Market Value Share and BPS Analysis by Nature, 2025 and 2035
  • Figure 28: North America Market Y-o-Y Growth Comparison by Nature, 2025-2035
  • Figure 29: North America Market Attractiveness Analysis by Nature
  • Figure 30: North America Market Value Share and BPS Analysis by Form, 2025 and 2035
  • Figure 31: North America Market Y-o-Y Growth Comparison by Form, 2025-2035
  • Figure 32: North America Market Attractiveness Analysis by Form
  • Figure 33: Latin America Market Value Share and BPS Analysis by Country, 2025 and 2035
  • Figure 34: Latin America Market Value Share and BPS Analysis by Product Type, 2025 and 2035
  • Figure 35: Latin America Market Y-o-Y Growth Comparison by Product Type, 2025-2035
  • Figure 36: Latin America Market Attractiveness Analysis by Product Type
  • Figure 37: Latin America Market Value Share and BPS Analysis by Nature, 2025 and 2035
  • Figure 38: Latin America Market Y-o-Y Growth Comparison by Nature, 2025-2035
  • Figure 39: Latin America Market Attractiveness Analysis by Nature
  • Figure 40: Latin America Market Value Share and BPS Analysis by Form, 2025 and 2035
  • Figure 41: Latin America Market Y-o-Y Growth Comparison by Form, 2025-2035
  • Figure 42: Latin America Market Attractiveness Analysis by Form
  • Figure 43: Western Europe Market Value Share and BPS Analysis by Country, 2025 and 2035
  • Figure 44: Western Europe Market Value Share and BPS Analysis by Product Type, 2025 and 2035
  • Figure 45: Western Europe Market Y-o-Y Growth Comparison by Product Type, 2025-2035
  • Figure 46: Western Europe Market Attractiveness Analysis by Product Type
  • Figure 47: Western Europe Market Value Share and BPS Analysis by Nature, 2025 and 2035
  • Figure 48: Western Europe Market Y-o-Y Growth Comparison by Nature, 2025-2035
  • Figure 49: Western Europe Market Attractiveness Analysis by Nature
  • Figure 50: Western Europe Market Value Share and BPS Analysis by Form, 2025 and 2035
  • Figure 51: Western Europe Market Y-o-Y Growth Comparison by Form, 2025-2035
  • Figure 52: Western Europe Market Attractiveness Analysis by Form
  • Figure 53: Eastern Europe Market Value Share and BPS Analysis by Country, 2025 and 2035
  • Figure 54: Eastern Europe Market Value Share and BPS Analysis by Product Type, 2025 and 2035
  • Figure 55: Eastern Europe Market Y-o-Y Growth Comparison by Product Type, 2025-2035
  • Figure 56: Eastern Europe Market Attractiveness Analysis by Product Type
  • Figure 57: Eastern Europe Market Value Share and BPS Analysis by Nature, 2025 and 2035
  • Figure 58: Eastern Europe Market Y-o-Y Growth Comparison by Nature, 2025-2035
  • Figure 59: Eastern Europe Market Attractiveness Analysis by Nature
  • Figure 60: Eastern Europe Market Value Share and BPS Analysis by Form, 2025 and 2035
  • Figure 61: Eastern Europe Market Y-o-Y Growth Comparison by Form, 2025-2035
  • Figure 62: Eastern Europe Market Attractiveness Analysis by Form
  • Figure 63: East Asia Market Value Share and BPS Analysis by Country, 2025 and 2035
  • Figure 64: East Asia Market Value Share and BPS Analysis by Product Type, 2025 and 2035
  • Figure 65: East Asia Market Y-o-Y Growth Comparison by Product Type, 2025-2035
  • Figure 66: East Asia Market Attractiveness Analysis by Product Type
  • Figure 67: East Asia Market Value Share and BPS Analysis by Nature, 2025 and 2035
  • Figure 68: East Asia Market Y-o-Y Growth Comparison by Nature, 2025-2035
  • Figure 69: East Asia Market Attractiveness Analysis by Nature
  • Figure 70: East Asia Market Value Share and BPS Analysis by Form, 2025 and 2035
  • Figure 71: East Asia Market Y-o-Y Growth Comparison by Form, 2025-2035
  • Figure 72: East Asia Market Attractiveness Analysis by Form
  • Figure 73: South Asia & Pacific Market Value Share and BPS Analysis by Country, 2025 and 2035
  • Figure 74: South Asia & Pacific Market Value Share and BPS Analysis by Product Type, 2025 and 2035
  • Figure 75: South Asia & Pacific Market Y-o-Y Growth Comparison by Product Type, 2025-2035
  • Figure 76: South Asia & Pacific Market Attractiveness Analysis by Product Type
  • Figure 77: South Asia & Pacific Market Value Share and BPS Analysis by Nature, 2025 and 2035
  • Figure 78: South Asia & Pacific Market Y-o-Y Growth Comparison by Nature, 2025-2035
  • Figure 79: South Asia & Pacific Market Attractiveness Analysis by Nature
  • Figure 80: South Asia & Pacific Market Value Share and BPS Analysis by Form, 2025 and 2035
  • Figure 81: South Asia & Pacific Market Y-o-Y Growth Comparison by Form, 2025-2035
  • Figure 82: South Asia & Pacific Market Attractiveness Analysis by Form
  • Figure 83: Middle East and Africa Market Value Share and BPS Analysis by Country, 2025 and 2035
  • Figure 84: Middle East and Africa Market Value Share and BPS Analysis by Product Type, 2025 and 2035
  • Figure 85: Middle East and Africa Market Y-o-Y Growth Comparison by Product Type, 2025-2035
  • Figure 86: Middle East and Africa Market Attractiveness Analysis by Product Type
  • Figure 87: Middle East and Africa Market Value Share and BPS Analysis by Nature, 2025 and 2035
  • Figure 88: Middle East and Africa Market Y-o-Y Growth Comparison by Nature, 2025-2035
  • Figure 89: Middle East and Africa Market Attractiveness Analysis by Nature
  • Figure 90: Middle East and Africa Market Value Share and BPS Analysis by Form, 2025 and 2035
  • Figure 91: Middle East and Africa Market Y-o-Y Growth Comparison by Form, 2025-2035
  • Figure 92: Middle East and Africa Market Attractiveness Analysis by Form
  • Figure 93: Global Market - Tier Structure Analysis
  • Figure 94: Global Market - Company Share Analysis

Frequently Asked Questions

What is the projected size of the freeze-dried food market in 2025?

The market is valued at USD 32.3 billion in 2025.

What is the outlook on freeze-dried food demand by 2035?

The market is forecasted to reach USD 59.7 billion by 2035, reflecting a CAGR of 6.3%.

Which product type leads the freeze-dried food market in 2025?

The fruits are expected to lead the market with a 40% share in 2025.

What is the projected share of conventional products in the freeze-dried food market by 2025?

The conventional products are expected to hold an 85% market share in 2025.

Which country is projected to have the fastest-growing freeze-dried food market?

The USA is anticipated to be the fastest-growing market with a CAGR of 5.3% from 2025 to 2035.

Explore Similar Insights

Future Market Insights

Freeze-Dried Food Market