Reports

- Global Locations -

Headquarters

Future Market Insights, Inc.

Christiana Corporate, 200
Continental Drive, Suite 401,
Newark, Delaware - 19713,
United States

T: +1-845-579-5705

Americas

Future Market Insights, Inc.

616 Corporate Way, Suite 2-9018,
Valley Cottage, NY 10989, United States

T: +1-347-918-3531

MEA

Future Market Insights

1602-6 Jumeirah Bay X2 Tower, Plot No: JLT-PH2-X2A,
Jumeirah Lakes Towers, Dubai,
United Arab Emirates

Europe

Future Market Insights

3rd Floor, 207 Regent Street,
W1B 3HH London
United Kingdom

T: + 44 (0) 20 8123 9659
D: +44 (0) 20 3287 4268

Asia Pacific

Future Market Insights

IndiaLand Global Tech Park, Unit UG-1, Behind Grand HighStreet, Phase 1, Hinjawadi, MH, Pune – 411057, India

Planetary Mixer Market Outlook (2023 to 2033)

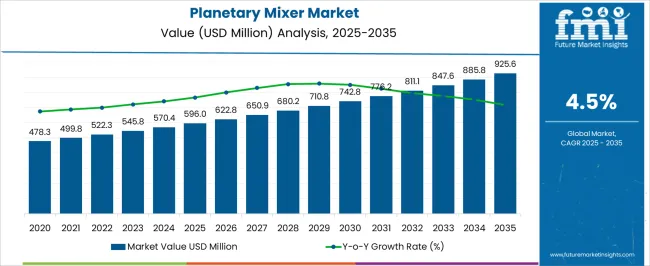
A valuation of more than US$ 545.8 million is predicted for the global planetary mixer market in 2023. A moderate CAGR of 4.5% is expected to accelerate the market during the 2023 to 2033 period and increase its valuation to US$ 847.6 million by the end of 2033.

One of the main advantages of using a planetary mixer is that they are very easy to use. The user simply needs to add all of the ingredients into the bowl, turn on the machine, and let it do its job. Another advantage of these mixers is that they are very versatile and can be used for a variety of tasks, such as kneading dough, mixing batter, or even whipping cream.

Planetary machines are gaining high popularity among consumers for a variety of reasons. They are packed with features that make them ideal for a wide range of tasks, right from simple cleaning to more complex jobs like polishing and waxing. Apart from that, they are easy to utilize and require little maintenance.

Planetary machines also offer a number of advantages over traditional models. For one, they are much more powerful, making them capable of tackling even the stubbornest dirt and grime. Additionally, they are much quieter than their traditional counterparts, meaning the user would not have to endure loud noise while using them. Finally, they tend to be more lightweight and compact, making them easier to store and transport.

Increasing demand for baked goods and ceramic doughs from various industries is projected to drive the market. Some of the renowned baked goods producers across the globe are set to launch state-of-the-art products to attract a large consumer base.

In September 2022, for instance, St Pierre Bakery declared that it will be launching a premium range of bake-at-home products in 2023 across the US It is expected to include its first non-brioche rolls and baguettes in its product range. It would also feature a four-count of crusty French dinner rolls, a single French baguette, and a twin-packed French baguette.

Attributes Key Insights
Global Planetary Mixer Market Estimated Size (2023E) US$ 545.8 Million
Projected Market Valuation (2033F) US$ 847.6 Million
Value-based CAGR (2023 to 2033) 4.5%
Market Share of the UK 6.1%

Don't pay for what you don't need

Customize your report by selecting specific countries or regions and save 30%!

2018 to 2022 Planetary Mixer Market Outlook Compared to 2023 to 2033 Demand Forecast

The global planetary mixer market was valued at US$ 545.8 Million in 2023 and is expected to reach US$ 847.6 million by 2033, growing at a CAGR of 4.5% during the forecast period from 2023 to 2033. The historical outlook for the global planetary mixer market has been positive, with the market growing at a CAGR of 4.2% from 2018 to 2022. This growth can be attributed to the increasing demand for food mixers from the food and beverage industry and the rising popularity of planetary mixers in home kitchens.

In June 2022, for instance, RSPL Group introduced Baker By Chance, a new brand to offer bakery products to fulfill the high demand from evolving consumers. It would provide baked goods made of quality and fresh ingredients. Such new brand launches by renowned conglomerates are estimated to augur well for planetary mixer sales.

Market-o-nomics - Highlighting the Key Trends

Various factors are responsible for propelling growth in the planetary mixer market. Lead analysts at Future Market Insights have conducted extensive research work to find out upcoming trends, threats, growth opportunities, driving factors, obstacles, and recent developments that can affect the market in the given time frame.

The drivers, restraints, opportunities, and threats (DROTs) identified are as follows:

DRIVERS

  • Increasing consumption of ready-to-eat products like biscuits, cakes, frozen pizzas, tortillas, cookies, and bread owing to fast-paced lifestyles would aid sales.
  • The surging need for convenient food items with high spending capacity is likely to bolster demand for planetary mixers.

RESTRAINTS

  • Though bread is considered to be the most consumed bakery product, its sale may decline in the forecast period amid growing concerns regarding weight gain.
  • Refined flours present in the majority of baked products can lead to various health issues such as obesity, which may impact demand.

OPPORTUNITIES

  • Key bakers are likely to come up with healthy options such as whole-grain and oats-containing cookies, which would drive demand.
  • An increasing number of supermarkets across the globe and the expansion of online presence by leading bakers would create new opportunities.

THREATS

  • The high content of carbohydrates and sugar in bakery products can cause diabetes and heart diseases, which may obstruct demand in the market.
  • Increasing demand for gluten-free and fat-free baked products among health-conscious consumers can hamper sales.
Nandini Roy Choudhury

Principal Consultant

Talk to Analyst

Find your sweet spots for generating winning opportunities in this market.

Country-wise Insights

Why are Sales of Planetary Mixers Skyrocketing in the US?

“Bakery Machinery Manufacturers across the US Focus on Providing FDA-Compliant Products”

In the US, planetary mixers are extensively used in a variety of settings, from bakeries and restaurants to laboratories and manufacturing facilities. In most cases, these mixers are affected by the same issues that any other type of mixer would be affected by such as power outages or equipment failures. However, there are some specific issues that can impact sales of planetary mixers in the US such as the Food and Drug Administration’s (FDA) regulation associated with food contact surfaces.

As per this regulation, all surfaces that come into contact with food must be made of materials that are safe for human consumption. This includes mixing bowls, paddles, and other attachments. As a result, many mixer manufacturers have had to change the materials they use to make their products compliant with this regulation.

Will India Create New Growth Opportunities for Planetary Mixer Manufacturers?

“Industry Development Projects across India to Propel Sales of Heavy Duty Planetary Mixers”

India is set to be a land of opportunity for those looking to start or expand their businesses in the planetary mixer industry. With a population of over 1.3 billion people, there is a large potential customer base for businesses to tap into.

The Indian government is also supportive of businesses in this sector, offering various incentives and tax breaks to encourage investment. Additionally, with many development projects underway in the country, there is a growing demand for bakery equipment, which presents an opportunity for businesses supplying planetary mixers.

In order to take advantage of new opportunities available in India, businesses need to have a good understanding of the local market. They should be able to adapt their products and services to meet the needs of Indian customers. Those that are able to do this successfully can reap the rewards of doing business in one of the most populous and rapidly growing countries in the world.

Why is China Emerging as a High-potential Hub for Planetary Mixer Manufacturers?

“Low Cost of Labor to Help Chinese Bakery Equipment Manufacturers Open their Facilities”

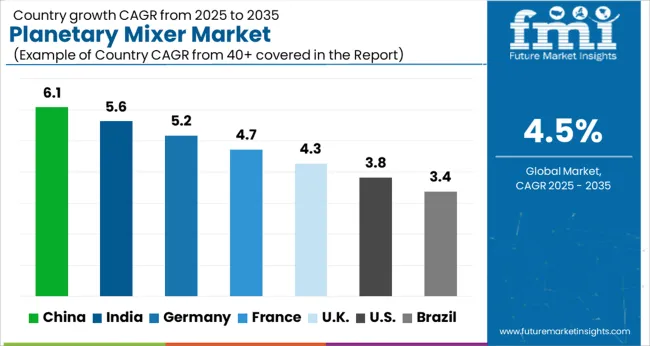
According to FMI, the planetary mixer market in China is rising at a peak stage. The evolution pace is set to be the most rapid in 2023 when imports are projected to surge by a CAGR of 5.8%. The country has a large population and thus will have easy access to a vast potential customer base. Additionally, China's economy is growing rapidly. The country's GDP exceeded nearly US$10 trillion by 2020. This will further provide a significant boost to businesses operating in China.

Another reason why China is an attractive market for planetary mixer companies is its low labor costs. Wages in China are much lower than in other developed countries, making it an attractive destination for manufacturing and other labor-intensive industries.

Additionally, the Chinese government is increasingly investing in infrastructure projects, which would create new opportunities for businesses involved in baking. Finally, China's culture and history would offer a unique opportunity for businesses looking to tap into the vast potential market.

Category-wise Insights

Who is the Leading End User of Planetary Mixers Worldwide?

“Launch of New Baked Snacks to Propel Demand for Planetary Cooking Mixers”

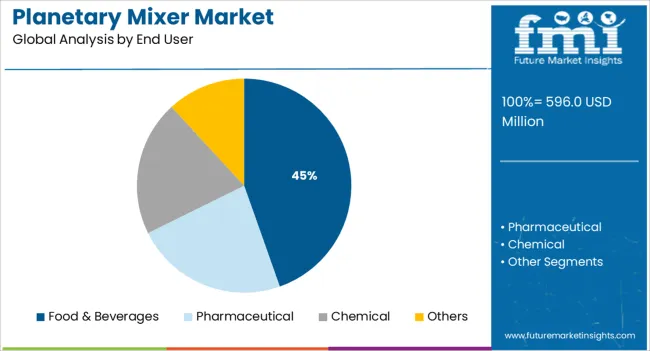
Based on end users, the food and beverage segment is anticipated to dominate the global planetary mixer market in the next ten years. Increasing usage of these mixers in the bakery industry for making cookies, cakes, bread, and pastries is projected to drive sales. Besides, numerous bakeries in various parts of the globe are striving to attract a large consumer base by coming up with unique products, which would aid growth.

In October 2021, for instance, Crazy Snacks Private Limited, which is a renowned manufacturer of bakery products based in India, launched cupcakes and layer cakes to enter the cake segment. The company aims to offer affordable and delicious snack options to price-conscious consumers across the country. Thus, such product launches are likely to enable key players to boost sales of planetary mixers.
Get the data you need at a Fraction of the cost

Personalize your report by choosing insights you need
and save 40%!

Competitive Landscape

Some of the most popular brands in the global planetary mixer industry include Hobart, KitchenAid, and Cuisinart. The majority of the key companies are focusing on growth strategies such as product approvals, product launches, participating in events, and bagging patents. A few other key players are engaging in inorganic growth strategies like partnerships and collaborations, as well as mergers and acquisitions.

For instance,

  • In December 2022, Crate & Barrel, leading furniture, and home décor retail store based in the US launched its new GE Profile Smart Mixer. It features auto sense and is designed to provide smart solutions that would simplify today’s modern life. It utilizes state-of-the-art technology to provide consumers with the confidence to emulsify, whip cream, and mix to perfection to refine the joy of baking.

Scope of the Report

Attribute Details
Estimated Market Size (2023) US$ 545.8 Million
Projected Market Valuation (2033) US$ 847.6 Million
Value-based CAGR (2023 to 2033) 4.5%
Forecast Period 2023 to 2033
Historical Data Available for 2018 to 2022
Market Analysis Value (US$ Million)
Key Regions Covered
  • North America
  • Latin America
  • Europe
  • Asia Pacific
  • Oceania
  • Middle East & Africa (MEA)
Key Countries Covered
  • The US
  • Canada
  • Mexico
  • Germany
  • The UK
  • France
  • Italy
  • Spain
  • China
  • Japan
  • India
  • South Korea
  • Australia
  • Brazil
  • Argentina
  • South Africa
  • UAE
Key Segments Covered
  • Product Type
  • End User
  • Region
Key Companies Profiled
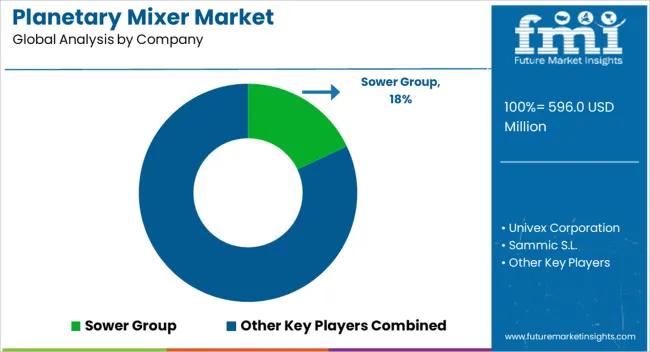
  • Sower Group
  • Univex Corporation
  • Sammic S.L.,
  • VMI, Li Yuan Machine Industrial Co. Ltd.
  • Dito Sama
Report Coverage Market Forecast, Company Share Analysis, Competitive Landscape, DROT Analysis, Market Dynamics and Challenges, and Strategic Growth Initiatives

Planetary Mixer Market Outlook by Category

By Product Type:

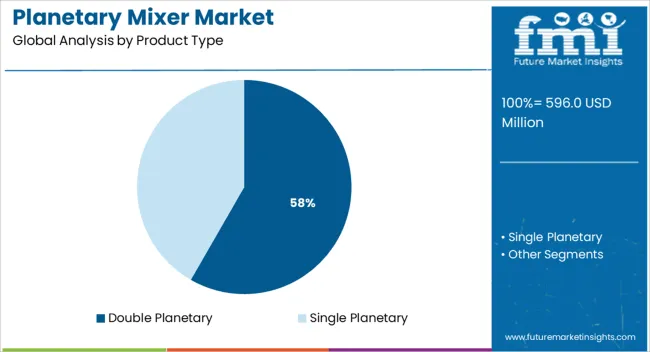
  • Single Planetary
  • Double Planetary

By End User:

  • Pharmaceutical
  • Chemical
  • Food & Beverages
  • Others

By Region:

  • North America
  • Latin America
  • Europe
  • East Asia
  • South Asia
  • Oceania
  • Middle East & Africa (MEA)

Frequently Asked Questions

How big is the planetary mixer industry?

The planetary mixer industry is expected to reach a valuation of US$ 545.8 Million by 2023.

At what rate is the planetary mixer industry expected to rise?

The planetary mixer industry is expected to rise at a CAGR of 4.5% in the forecast period.

What is the North America planetary mixer industry outlook?

The North American planetary mixer industry is expected to register a 38% CAGR between 2023 and 2033.

Which are the major countries driving demand for planetary mixers?

The US, China, Canada, Germany, and Mexico are the major countries driving demand for planetary mixers.

At what rate will the China planetary mixer industry grow?

The China planetary mixer industry is projected to grow at a CAGR of 5.8% in the next ten years.

At what rate will the UK planetary mixer industry grow?

The UK planetary mixer industry is projected to grow at a CAGR of 6.1% in the evaluation period.

At what rate will the India planetary mixer demand grow?

The India planetary mixer industry is projected to grow at a CAGR of 6.0% throughout the estimated time frame.

At what rate will planetary mixer demand grow in the US?

Demand for planetary mixers in Europe is expected to grow at 35.6% CAGR in 2023.

At what rate will planetary mixer demand grow in Japan?

Demand for planetary mixers in Japan is expected to grow at 24.5% CAGR by 2023.

At what rate will planetary mixer demand grow in Australia?

Demand for planetary mixers in Australia is expected to grow at 3.2% CAGR in 2023.

What is the demand outlook forecast for the planetary mixer industry?

The global planetary mixer industry is set to surpass US$ 847.6 Million by the end of 2033.

Table of Content

1. Executive Summary | Planetary Mixer Market

    1.1. Global Market Outlook

    1.2. Demand-side Trends

    1.3. Supply-side Trends

    1.4. Technology Roadmap Analysis

    1.5. Analysis and Recommendations

2. Market Overview

    2.1. Market Coverage / Taxonomy

    2.2. Market Definition / Scope / Limitations

3. Market Background

    3.1. Market Dynamics

        3.1.1. Drivers

        3.1.2. Restraints

        3.1.3. Opportunity

        3.1.4. Trends

    3.2. Scenario Forecast

        3.2.1. Demand in Optimistic Scenario

        3.2.2. Demand in Likely Scenario

        3.2.3. Demand in Conservative Scenario

    3.3. Product launches & Recent Developments

    3.4. Product Life Cycle Analysis

    3.5. Value Chain Analysis

        3.5.1. Supply Side Participants and their Roles

            3.5.1.1. Producers

            3.5.1.2. Mid-Level Participants (Traders / Agents / Brokers)

            3.5.1.3. Wholesalers and Distributors

        3.5.2. % of Operating Margin Analysis

        3.5.3. List of Raw Material Suppliers

        3.5.4. List of Existing and Potential Buyers

    3.6. Global Market - Pricing Analysis

        3.6.1. Price Point Assessment by Region

        3.6.2. Price Point Assessment by Product Type

        3.6.3. Price Forecast till 2033

        3.6.4. Factors affecting pricing

    3.7. Forecast Factors - Relevance & Impact

    3.8. PESTLE and Porter’s Analysis

    3.9. Regulatory Landscape

        3.9.1. Packaging & Labelling Regulations

        3.9.2. Certifications and Certifying Agency Overview

        3.9.3. Import/Export Policies

    3.10. Regional Parent Market Outlook

    3.11. Production and Consumption Statistics

    3.12. Import and Export Statistics

    3.13. Consumers Survey Analysis

    3.14. Macro-Economic Factors

    3.15. Product Claims & Nutritional Information scanned by Buyers

4. Global Market Analysis 2018 to 2023 and Forecast, 2023 to 2033

    4.1. Historical Market Size Value (US$ Million) & Volume (MT) Analysis, 2018 to 2023

    4.2. Current and Future Market Size Value (US$ Million) & Volume (MT) Projections, 2023 to 2033

        4.2.1. Y-o-Y Growth Trend Analysis

        4.2.2. Absolute $ Opportunity Analysis

5. Global Market Analysis 2018 to 2023 and Forecast 2023 to 2033, By Product Type

    5.1. Introduction / Key Findings

    5.2. Historical Market Size Value (US$ Million) & Volume (MT) Analysis By Product Type, 2018 to 2023

    5.3. Current and Future Market Size Value (US$ Million) & Volume (MT) Analysis and Forecast By Product Type, 2023 to 2033

        5.3.1. Single Planetary

        5.3.2. Double Planetary

    5.4. Y-o-Y Growth Trend Analysis By Product Type, 2018 to 2023

    5.5. Absolute $ Opportunity Analysis By Product Type, 2023 to 2033

6. Global Market Analysis 2018 to 2023 and Forecast 2023 to 2033, By End User

    6.1. Introduction / Key Findings

    6.2. Historical Market Size Value (US$ Million) & Volume (MT) Analysis By End User, 2018 to 2023

    6.3. Current and Future Market Size Value (US$ Million) & Volume (MT) Analysis and Forecast By End User, 2023 to 2033

        6.3.1. Pharmaceutical

        6.3.2. Chemical

        6.3.3. Food and Beverage

        6.3.4. Other

    6.4. Y-o-Y Growth Trend Analysis By End User, 2018 to 2023

    6.5. Absolute $ Opportunity Analysis By End User, 2023 to 2033

7. Global Market Analysis 2018 to 2023 and Forecast 2023 to 2033, By Region

    7.1. Introduction

    7.2. Historical Market Size Value (US$ Million) & Volume (MT) Analysis By Region, 2018 to 2023

    7.3. Current Market Size Value (US$ Million) & Volume (MT) Analysis and Forecast By Region, 2023 to 2033

        7.3.1. North America

        7.3.2. Latin America

        7.3.3. Europe

        7.3.4. East Asia

        7.3.5. South Asia

        7.3.6. Oceania

        7.3.7. Middle East & Africa (MEA)

    7.4. Market Attractiveness Analysis By Region

8. North America Market Analysis 2018 to 2023 and Forecast 2023 to 2033, By Country

    8.1. Historical Market Size Value (US$ Million) & Volume (MT) Trend Analysis By Market Taxonomy, 2018 to 2023

    8.2. Market Size Value (US$ Million) & Volume (MT) Forecast By Market Taxonomy, 2023 to 2033

        8.2.1. By Country

            8.2.1.1. The US

            8.2.1.2. Canada

        8.2.2. By Product Type

        8.2.3. By End User

    8.3. Market Attractiveness Analysis

        8.3.1. By Country

        8.3.2. By Product Type

        8.3.3. By End User

    8.4. Key Takeaways

9. Latin America Market Analysis 2018 to 2023 and Forecast 2023 to 2033, By Country

    9.1. Historical Market Size Value (US$ Million) & Volume (MT) Trend Analysis By Market Taxonomy, 2018 to 2023

    9.2. Market Size Value (US$ Million) & Volume (MT) Forecast By Market Taxonomy, 2023 to 2033

        9.2.1. By Country

            9.2.1.1. Brazil

            9.2.1.2. Mexico

            9.2.1.3. Argentina

            9.2.1.4. Chile

            9.2.1.5. Peru

            9.2.1.6. Rest of Latin America

        9.2.2. By Product Type

        9.2.3. By End User

    9.3. Market Attractiveness Analysis

        9.3.1. By Country

        9.3.2. By Product Type

        9.3.3. By End User

    9.4. Key Takeaways

10. Europe Market Analysis 2018 to 2023 and Forecast 2023 to 2033, By Country

    10.1. Historical Market Size Value (US$ Million) & Volume (MT) Trend Analysis By Market Taxonomy, 2018 to 2023

    10.2. Market Size Value (US$ Million) & Volume (MT) Forecast By Market Taxonomy, 2023 to 2033

        10.2.1. By Country

            10.2.1.1. Germany

            10.2.1.2. Italy

            10.2.1.3. France

            10.2.1.4. The UK

            10.2.1.5. Spain

            10.2.1.6. Russia

            10.2.1.7. BENELUX

            10.2.1.8. Poland

            10.2.1.9. Nordic Countries

            10.2.1.10. Rest of Europe

        10.2.2. By Product Type

        10.2.3. By End User

    10.3. Market Attractiveness Analysis

        10.3.1. By Country

        10.3.2. By Product Type

        10.3.3. By End User

    10.4. Key Takeaways

11. East Asia Market Analysis 2018 to 2023 and Forecast 2023 to 2033, By Country

    11.1. Historical Market Size Value (US$ Million) & Volume (MT) Trend Analysis By Market Taxonomy, 2018 to 2023

    11.2. Market Size Value (US$ Million) & Volume (MT) Forecast By Market Taxonomy, 2023 to 2033

        11.2.1. By Country

            11.2.1.1. China

            11.2.1.2. Japan

            11.2.1.3. South Korea

        11.2.2. By Product Type

        11.2.3. By End User

    11.3. Market Attractiveness Analysis

        11.3.1. By Country

        11.3.2. By Product Type

        11.3.3. By End User

    11.4. Key Takeaways

12. South Asia Market Analysis 2018 to 2023 and Forecast 2023 to 2033, By Country

    12.1. Historical Market Size Value (US$ Million) & Volume (MT) Trend Analysis By Market Taxonomy, 2018 to 2023

    12.2. Market Size Value (US$ Million) & Volume (MT) Forecast By Market Taxonomy, 2023 to 2033

        12.2.1. By Country

            12.2.1.1. India

            12.2.1.2. Thailand

            12.2.1.3. Malaysia

            12.2.1.4. Indonesia

            12.2.1.5. Singapore

            12.2.1.6. Rest of South Asia

        12.2.2. By Product Type

        12.2.3. By End User

    12.3. Market Attractiveness Analysis

        12.3.1. By Country

        12.3.2. By Product Type

        12.3.3. By End User

    12.4. Key Takeaways

13. Oceania Market Analysis 2018 to 2023 and Forecast 2023 to 2033, By Country

    13.1. Historical Market Size Value (US$ Million) & Volume (MT) Trend Analysis By Market Taxonomy, 2018 to 2023

    13.2. Market Size Value (US$ Million) & Volume (MT) Forecast By Market Taxonomy, 2023 to 2033

        13.2.1. By Country

            13.2.1.1. Australia

            13.2.1.2. New Zealand

        13.2.2. By Product Type

        13.2.3. By End User

    13.3. Market Attractiveness Analysis

        13.3.1. By Country

        13.3.2. By Product Type

        13.3.3. By End User

    13.4. Key Takeaways

14. MEA Market Analysis 2018 to 2023 and Forecast 2023 to 2033, By Country

    14.1. Historical Market Size Value (US$ Million) & Volume (MT) Trend Analysis By Market Taxonomy, 2018 to 2023

    14.2. Market Size Value (US$ Million) & Volume (MT) Forecast By Market Taxonomy, 2023 to 2033

        14.2.1. By Country

            14.2.1.1. GCC Countries

            14.2.1.2. South Africa

            14.2.1.3. Central Africa

            14.2.1.4. North Africa

        14.2.2. By Product Type

        14.2.3. By End User

    14.3. Market Attractiveness Analysis

        14.3.1. By Country

        14.3.2. By Product Type

        14.3.3. By End User

    14.4. Key Takeaways

15. Key Countries Market Analysis

    15.1. The U.S.

        15.1.1. Pricing Analysis

        15.1.2. Market Share Analysis, 2022

            15.1.2.1. By Product Type

            15.1.2.2. By End User

    15.2. Canada

        15.2.1. Pricing Analysis

        15.2.2. Market Share Analysis, 2022

            15.2.2.1. By Product Type

            15.2.2.2. By End User

    15.3. Brazil

        15.3.1. Pricing Analysis

        15.3.2. Market Share Analysis, 2022

            15.3.2.1. By Product Type

            15.3.2.2. By End User

    15.4. Mexico

        15.4.1. Pricing Analysis

        15.4.2. Market Share Analysis, 2022

            15.4.2.1. By Product Type

            15.4.2.2. By End User

    15.5. Argentina

        15.5.1. Pricing Analysis

        15.5.2. Market Share Analysis, 2022

            15.5.2.1. By Product Type

            15.5.2.2. By End User

    15.6. Chile

        15.6.1. Pricing Analysis

        15.6.2. Market Share Analysis, 2022

            15.6.2.1. By Product Type

            15.6.2.2. By End User

    15.7. Peru

        15.7.1. Pricing Analysis

        15.7.2. Market Share Analysis, 2022

            15.7.2.1. By Product Type

            15.7.2.2. By End User

    15.8. Germany

        15.8.1. Pricing Analysis

        15.8.2. Market Share Analysis, 2022

            15.8.2.1. By Product Type

            15.8.2.2. By End User

    15.9. Italy

        15.9.1. Pricing Analysis

        15.9.2. Market Share Analysis, 2022

            15.9.2.1. By Product Type

            15.9.2.2. By End User

    15.10. France

        15.10.1. Pricing Analysis

        15.10.2. Market Share Analysis, 2022

            15.10.2.1. By Product Type

            15.10.2.2. By End User

    15.11. Spain

        15.11.1. Pricing Analysis

        15.11.2. Market Share Analysis, 2022

            15.11.2.1. By Product Type

            15.11.2.2. By End User

    15.12. The U.K.

        15.12.1. Pricing Analysis

        15.12.2. Market Share Analysis, 2022

            15.12.2.1. By Product Type

            15.12.2.2. By End User

    15.13. Russia

        15.13.1. Pricing Analysis

        15.13.2. Market Share Analysis, 2022

            15.13.2.1. By Product Type

            15.13.2.2. By End User

    15.14. Poland

        15.14.1. Pricing Analysis

        15.14.2. Market Share Analysis, 2022

            15.14.2.1. By Product Type

            15.14.2.2. By End User

    15.15. BENELUX

        15.15.1. Pricing Analysis

        15.15.2. Market Share Analysis, 2022

            15.15.2.1. By Product Type

            15.15.2.2. By End User

    15.16. Nordic Countries

        15.16.1. Pricing Analysis

        15.16.2. Market Share Analysis, 2022

            15.16.2.1. By Product Type

            15.16.2.2. By End User

    15.17. China

        15.17.1. Pricing Analysis

        15.17.2. Market Share Analysis, 2022

            15.17.2.1. By Product Type

            15.17.2.2. By End User

    15.18. Japan

        15.18.1. Pricing Analysis

        15.18.2. Market Share Analysis, 2022

            15.18.2.1. By Product Type

            15.18.2.2. By End User

    15.19. South Korea

        15.19.1. Pricing Analysis

        15.19.2. Market Share Analysis, 2022

            15.19.2.1. By Product Type

            15.19.2.2. By End User

    15.20. India

        15.20.1. Pricing Analysis

        15.20.2. Market Share Analysis, 2022

            15.20.2.1. By Product Type

            15.20.2.2. By End User

    15.21. Thailand

        15.21.1. Pricing Analysis

        15.21.2. Market Share Analysis, 2022

            15.21.2.1. By Product Type

            15.21.2.2. By End User

    15.22. Indonesia

        15.22.1. Pricing Analysis

        15.22.2. Market Share Analysis, 2022

            15.22.2.1. By Product Type

            15.22.2.2. By End User

    15.23. Malaysia

        15.23.1. Pricing Analysis

        15.23.2. Market Share Analysis, 2022

            15.23.2.1. By Product Type

            15.23.2.2. By End User

    15.24. Singapore

        15.24.1. Pricing Analysis

        15.24.2. Market Share Analysis, 2022

            15.24.2.1. By Product Type

            15.24.2.2. By End User

    15.25. Australia

        15.25.1. Pricing Analysis

        15.25.2. Market Share Analysis, 2022

            15.25.2.1. By Product Type

            15.25.2.2. By End User

    15.26. New Zealand

        15.26.1. Pricing Analysis

        15.26.2. Market Share Analysis, 2022

            15.26.2.1. By Product Type

            15.26.2.2. By End User

    15.27. GCC Countries

        15.27.1. Pricing Analysis

        15.27.2. Market Share Analysis, 2022

            15.27.2.1. By Product Type

            15.27.2.2. By End User

    15.28. South Africa

        15.28.1. Pricing Analysis

        15.28.2. Market Share Analysis, 2022

            15.28.2.1. By Product Type

            15.28.2.2. By End User

    15.29. North Africa

        15.29.1. Pricing Analysis

        15.29.2. Market Share Analysis, 2022

            15.29.2.1. By Product Type

            15.29.2.2. By End User

    15.30. Central Africa

        15.30.1. Pricing Analysis

        15.30.2. Market Share Analysis, 2022

            15.30.2.1. By Product Type

            15.30.2.2. By End User

16. Market Structure Analysis

    16.1. Competition Dashboard

    16.2. Competition Benchmarking

    16.3. Market Share Analysis of Top Players

        16.3.1. By Regional

        16.3.2. By Product Type

        16.3.3. By End User

17. Competition Analysis

    17.1. Competition Deep Dive

        17.1.1. Sower Group

            17.1.1.1. Overview

            17.1.1.2. Product Portfolio

            17.1.1.3. Profitability by Market Segments (Product / Age / Sales Channel / Region)

            17.1.1.4. Sales Footprint

            17.1.1.5. Strategy Overview

                17.1.1.5.1. Marketing Strategy

                17.1.1.5.2. Product Strategy

                17.1.1.5.3. Channel Strategy

        17.1.2. Univex Corporation

            17.1.2.1. Overview

            17.1.2.2. Product Portfolio

            17.1.2.3. Profitability by Market Segments (Product / Age / Sales Channel / Region)

            17.1.2.4. Sales Footprint

            17.1.2.5. Strategy Overview

                17.1.2.5.1. Marketing Strategy

                17.1.2.5.2. Product Strategy

                17.1.2.5.3. Channel Strategy

        17.1.3. Sammic S.L.

            17.1.3.1. Overview

            17.1.3.2. Product Portfolio

            17.1.3.3. Profitability by Market Segments (Product / Age / Sales Channel / Region)

            17.1.3.4. Sales Footprint

            17.1.3.5. Strategy Overview

                17.1.3.5.1. Marketing Strategy

                17.1.3.5.2. Product Strategy

                17.1.3.5.3. Channel Strategy

        17.1.4. VMI, Li Yuan Machine Industrial Co. Ltd.

            17.1.4.1. Overview

            17.1.4.2. Product Portfolio

            17.1.4.3. Profitability by Market Segments (Product / Age / Sales Channel / Region)

            17.1.4.4. Sales Footprint

            17.1.4.5. Strategy Overview

                17.1.4.5.1. Marketing Strategy

                17.1.4.5.2. Product Strategy

                17.1.4.5.3. Channel Strategy

        17.1.5. Dito Sama

            17.1.5.1. Overview

            17.1.5.2. Product Portfolio

            17.1.5.3. Profitability by Market Segments (Product / Age / Sales Channel / Region)

            17.1.5.4. Sales Footprint

            17.1.5.5. Strategy Overview

                17.1.5.5.1. Marketing Strategy

                17.1.5.5.2. Product Strategy

                17.1.5.5.3. Channel Strategy

18. Assumptions & Acronyms Used

19. Research Methodology

Don't pay for what you don't need

Customize your report by selecting specific countries or regions and save 30%!

List of Tables

Table 1: Global Market Value (US$ Million) Forecast by Region, 2018 to 2033

Table 2: Global Market Volume (MT) Forecast by Region, 2018 to 2033

Table 3: Global Market Value (US$ Million) Forecast by Product Type, 2018 to 2033

Table 4: Global Market Volume (MT) Forecast by Product Type, 2018 to 2033

Table 5: Global Market Value (US$ Million) Forecast by End User, 2018 to 2033

Table 6: Global Market Volume (MT) Forecast by End User, 2018 to 2033

Table 7: North America Market Value (US$ Million) Forecast by Country, 2018 to 2033

Table 8: North America Market Volume (MT) Forecast by Country, 2018 to 2033

Table 9: North America Market Value (US$ Million) Forecast by Product Type, 2018 to 2033

Table 10: North America Market Volume (MT) Forecast by Product Type, 2018 to 2033

Table 11: North America Market Value (US$ Million) Forecast by End User, 2018 to 2033

Table 12: North America Market Volume (MT) Forecast by End User, 2018 to 2033

Table 13: Latin America Market Value (US$ Million) Forecast by Country, 2018 to 2033

Table 14: Latin America Market Volume (MT) Forecast by Country, 2018 to 2033

Table 15: Latin America Market Value (US$ Million) Forecast by Product Type, 2018 to 2033

Table 16: Latin America Market Volume (MT) Forecast by Product Type, 2018 to 2033

Table 17: Latin America Market Value (US$ Million) Forecast by End User, 2018 to 2033

Table 18: Latin America Market Volume (MT) Forecast by End User, 2018 to 2033

Table 19: Europe Market Value (US$ Million) Forecast by Country, 2018 to 2033

Table 20: Europe Market Volume (MT) Forecast by Country, 2018 to 2033

Table 21: Europe Market Value (US$ Million) Forecast by Product Type, 2018 to 2033

Table 22: Europe Market Volume (MT) Forecast by Product Type, 2018 to 2033

Table 23: Europe Market Value (US$ Million) Forecast by End User, 2018 to 2033

Table 24: Europe Market Volume (MT) Forecast by End User, 2018 to 2033

Table 25: East Asia Market Value (US$ Million) Forecast by Country, 2018 to 2033

Table 26: East Asia Market Volume (MT) Forecast by Country, 2018 to 2033

Table 27: East Asia Market Value (US$ Million) Forecast by Product Type, 2018 to 2033

Table 28: East Asia Market Volume (MT) Forecast by Product Type, 2018 to 2033

Table 29: East Asia Market Value (US$ Million) Forecast by End User, 2018 to 2033

Table 30: East Asia Market Volume (MT) Forecast by End User, 2018 to 2033

Table 31: South Asia Market Value (US$ Million) Forecast by Country, 2018 to 2033

Table 32: South Asia Market Volume (MT) Forecast by Country, 2018 to 2033

Table 33: South Asia Market Value (US$ Million) Forecast by Product Type, 2018 to 2033

Table 34: South Asia Market Volume (MT) Forecast by Product Type, 2018 to 2033

Table 35: South Asia Market Value (US$ Million) Forecast by End User, 2018 to 2033

Table 36: South Asia Market Volume (MT) Forecast by End User, 2018 to 2033

Table 37: Oceania Market Value (US$ Million) Forecast by Country, 2018 to 2033

Table 38: Oceania Market Volume (MT) Forecast by Country, 2018 to 2033

Table 39: Oceania Market Value (US$ Million) Forecast by Product Type, 2018 to 2033

Table 40: Oceania Market Volume (MT) Forecast by Product Type, 2018 to 2033

Table 41: Oceania Market Value (US$ Million) Forecast by End User, 2018 to 2033

Table 42: Oceania Market Volume (MT) Forecast by End User, 2018 to 2033

Table 43: MEA Market Value (US$ Million) Forecast by Country, 2018 to 2033

Table 44: MEA Market Volume (MT) Forecast by Country, 2018 to 2033

Table 45: MEA Market Value (US$ Million) Forecast by Product Type, 2018 to 2033

Table 46: MEA Market Volume (MT) Forecast by Product Type, 2018 to 2033

Table 47: MEA Market Value (US$ Million) Forecast by End User, 2018 to 2033

Table 48: MEA Market Volume (MT) Forecast by End User, 2018 to 2033
Nandini Roy Choudhury

Principal Consultant

Talk to Analyst

Find your sweet spots for generating winning opportunities in this market.

List of Charts

Figure 1: Global Market Value (US$ Million) by Product Type, 2023 to 2033

Figure 2: Global Market Value (US$ Million) by End User, 2023 to 2033

Figure 3: Global Market Value (US$ Million) by Region, 2023 to 2033

Figure 4: Global Market Value (US$ Million) Analysis by Region, 2018 to 2033

Figure 5: Global Market Volume (MT) Analysis by Region, 2018 to 2033

Figure 6: Global Market Value Share (%) and BPS Analysis by Region, 2023 to 2033

Figure 7: Global Market Y-o-Y Growth (%) Projections by Region, 2023 to 2033

Figure 8: Global Market Value (US$ Million) Analysis by Product Type, 2018 to 2033

Figure 9: Global Market Volume (MT) Analysis by Product Type, 2018 to 2033

Figure 10: Global Market Value Share (%) and BPS Analysis by Product Type, 2023 to 2033

Figure 11: Global Market Y-o-Y Growth (%) Projections by Product Type, 2023 to 2033

Figure 12: Global Market Value (US$ Million) Analysis by End User, 2018 to 2033

Figure 13: Global Market Volume (MT) Analysis by End User, 2018 to 2033

Figure 14: Global Market Value Share (%) and BPS Analysis by End User, 2023 to 2033

Figure 15: Global Market Y-o-Y Growth (%) Projections by End User, 2023 to 2033

Figure 16: Global Market Attractiveness by Product Type, 2023 to 2033

Figure 17: Global Market Attractiveness by End User, 2023 to 2033

Figure 18: Global Market Attractiveness by Region, 2023 to 2033

Figure 19: North America Market Value (US$ Million) by Product Type, 2023 to 2033

Figure 20: North America Market Value (US$ Million) by End User, 2023 to 2033

Figure 21: North America Market Value (US$ Million) by Country, 2023 to 2033

Figure 22: North America Market Value (US$ Million) Analysis by Country, 2018 to 2033

Figure 23: North America Market Volume (MT) Analysis by Country, 2018 to 2033

Figure 24: North America Market Value Share (%) and BPS Analysis by Country, 2023 to 2033

Figure 25: North America Market Y-o-Y Growth (%) Projections by Country, 2023 to 2033

Figure 26: North America Market Value (US$ Million) Analysis by Product Type, 2018 to 2033

Figure 27: North America Market Volume (MT) Analysis by Product Type, 2018 to 2033

Figure 28: North America Market Value Share (%) and BPS Analysis by Product Type, 2023 to 2033

Figure 29: North America Market Y-o-Y Growth (%) Projections by Product Type, 2023 to 2033

Figure 30: North America Market Value (US$ Million) Analysis by End User, 2018 to 2033

Figure 31: North America Market Volume (MT) Analysis by End User, 2018 to 2033

Figure 32: North America Market Value Share (%) and BPS Analysis by End User, 2023 to 2033

Figure 33: North America Market Y-o-Y Growth (%) Projections by End User, 2023 to 2033

Figure 34: North America Market Attractiveness by Product Type, 2023 to 2033

Figure 35: North America Market Attractiveness by End User, 2023 to 2033

Figure 36: North America Market Attractiveness by Country, 2023 to 2033

Figure 37: Latin America Market Value (US$ Million) by Product Type, 2023 to 2033

Figure 38: Latin America Market Value (US$ Million) by End User, 2023 to 2033

Figure 39: Latin America Market Value (US$ Million) by Country, 2023 to 2033

Figure 40: Latin America Market Value (US$ Million) Analysis by Country, 2018 to 2033

Figure 41: Latin America Market Volume (MT) Analysis by Country, 2018 to 2033

Figure 42: Latin America Market Value Share (%) and BPS Analysis by Country, 2023 to 2033

Figure 43: Latin America Market Y-o-Y Growth (%) Projections by Country, 2023 to 2033

Figure 44: Latin America Market Value (US$ Million) Analysis by Product Type, 2018 to 2033

Figure 45: Latin America Market Volume (MT) Analysis by Product Type, 2018 to 2033

Figure 46: Latin America Market Value Share (%) and BPS Analysis by Product Type, 2023 to 2033

Figure 47: Latin America Market Y-o-Y Growth (%) Projections by Product Type, 2023 to 2033

Figure 48: Latin America Market Value (US$ Million) Analysis by End User, 2018 to 2033

Figure 49: Latin America Market Volume (MT) Analysis by End User, 2018 to 2033

Figure 50: Latin America Market Value Share (%) and BPS Analysis by End User, 2023 to 2033

Figure 51: Latin America Market Y-o-Y Growth (%) Projections by End User, 2023 to 2033

Figure 52: Latin America Market Attractiveness by Product Type, 2023 to 2033

Figure 53: Latin America Market Attractiveness by End User, 2023 to 2033

Figure 54: Latin America Market Attractiveness by Country, 2023 to 2033

Figure 55: Europe Market Value (US$ Million) by Product Type, 2023 to 2033

Figure 56: Europe Market Value (US$ Million) by End User, 2023 to 2033

Figure 57: Europe Market Value (US$ Million) by Country, 2023 to 2033

Figure 58: Europe Market Value (US$ Million) Analysis by Country, 2018 to 2033

Figure 59: Europe Market Volume (MT) Analysis by Country, 2018 to 2033

Figure 60: Europe Market Value Share (%) and BPS Analysis by Country, 2023 to 2033

Figure 61: Europe Market Y-o-Y Growth (%) Projections by Country, 2023 to 2033

Figure 62: Europe Market Value (US$ Million) Analysis by Product Type, 2018 to 2033

Figure 63: Europe Market Volume (MT) Analysis by Product Type, 2018 to 2033

Figure 64: Europe Market Value Share (%) and BPS Analysis by Product Type, 2023 to 2033

Figure 65: Europe Market Y-o-Y Growth (%) Projections by Product Type, 2023 to 2033

Figure 66: Europe Market Value (US$ Million) Analysis by End User, 2018 to 2033

Figure 67: Europe Market Volume (MT) Analysis by End User, 2018 to 2033

Figure 68: Europe Market Value Share (%) and BPS Analysis by End User, 2023 to 2033

Figure 69: Europe Market Y-o-Y Growth (%) Projections by End User, 2023 to 2033

Figure 70: Europe Market Attractiveness by Product Type, 2023 to 2033

Figure 71: Europe Market Attractiveness by End User, 2023 to 2033

Figure 72: Europe Market Attractiveness by Country, 2023 to 2033

Figure 73: East Asia Market Value (US$ Million) by Product Type, 2023 to 2033

Figure 74: East Asia Market Value (US$ Million) by End User, 2023 to 2033

Figure 75: East Asia Market Value (US$ Million) by Country, 2023 to 2033

Figure 76: East Asia Market Value (US$ Million) Analysis by Country, 2018 to 2033

Figure 77: East Asia Market Volume (MT) Analysis by Country, 2018 to 2033

Figure 78: East Asia Market Value Share (%) and BPS Analysis by Country, 2023 to 2033

Figure 79: East Asia Market Y-o-Y Growth (%) Projections by Country, 2023 to 2033

Figure 80: East Asia Market Value (US$ Million) Analysis by Product Type, 2018 to 2033

Figure 81: East Asia Market Volume (MT) Analysis by Product Type, 2018 to 2033

Figure 82: East Asia Market Value Share (%) and BPS Analysis by Product Type, 2023 to 2033

Figure 83: East Asia Market Y-o-Y Growth (%) Projections by Product Type, 2023 to 2033

Figure 84: East Asia Market Value (US$ Million) Analysis by End User, 2018 to 2033

Figure 85: East Asia Market Volume (MT) Analysis by End User, 2018 to 2033

Figure 86: East Asia Market Value Share (%) and BPS Analysis by End User, 2023 to 2033

Figure 87: East Asia Market Y-o-Y Growth (%) Projections by End User, 2023 to 2033

Figure 88: East Asia Market Attractiveness by Product Type, 2023 to 2033

Figure 89: East Asia Market Attractiveness by End User, 2023 to 2033

Figure 90: East Asia Market Attractiveness by Country, 2023 to 2033

Figure 91: South Asia Market Value (US$ Million) by Product Type, 2023 to 2033

Figure 92: South Asia Market Value (US$ Million) by End User, 2023 to 2033

Figure 93: South Asia Market Value (US$ Million) by Country, 2023 to 2033

Figure 94: South Asia Market Value (US$ Million) Analysis by Country, 2018 to 2033

Figure 95: South Asia Market Volume (MT) Analysis by Country, 2018 to 2033

Figure 96: South Asia Market Value Share (%) and BPS Analysis by Country, 2023 to 2033

Figure 97: South Asia Market Y-o-Y Growth (%) Projections by Country, 2023 to 2033

Figure 98: South Asia Market Value (US$ Million) Analysis by Product Type, 2018 to 2033

Figure 99: South Asia Market Volume (MT) Analysis by Product Type, 2018 to 2033

Figure 100: South Asia Market Value Share (%) and BPS Analysis by Product Type, 2023 to 2033

Figure 101: South Asia Market Y-o-Y Growth (%) Projections by Product Type, 2023 to 2033

Figure 102: South Asia Market Value (US$ Million) Analysis by End User, 2018 to 2033

Figure 103: South Asia Market Volume (MT) Analysis by End User, 2018 to 2033

Figure 104: South Asia Market Value Share (%) and BPS Analysis by End User, 2023 to 2033

Figure 105: South Asia Market Y-o-Y Growth (%) Projections by End User, 2023 to 2033

Figure 106: South Asia Market Attractiveness by Product Type, 2023 to 2033

Figure 107: South Asia Market Attractiveness by End User, 2023 to 2033

Figure 108: South Asia Market Attractiveness by Country, 2023 to 2033

Figure 109: Oceania Market Value (US$ Million) by Product Type, 2023 to 2033

Figure 110: Oceania Market Value (US$ Million) by End User, 2023 to 2033

Figure 111: Oceania Market Value (US$ Million) by Country, 2023 to 2033

Figure 112: Oceania Market Value (US$ Million) Analysis by Country, 2018 to 2033

Figure 113: Oceania Market Volume (MT) Analysis by Country, 2018 to 2033

Figure 114: Oceania Market Value Share (%) and BPS Analysis by Country, 2023 to 2033

Figure 115: Oceania Market Y-o-Y Growth (%) Projections by Country, 2023 to 2033

Figure 116: Oceania Market Value (US$ Million) Analysis by Product Type, 2018 to 2033

Figure 117: Oceania Market Volume (MT) Analysis by Product Type, 2018 to 2033

Figure 118: Oceania Market Value Share (%) and BPS Analysis by Product Type, 2023 to 2033

Figure 119: Oceania Market Y-o-Y Growth (%) Projections by Product Type, 2023 to 2033

Figure 120: Oceania Market Value (US$ Million) Analysis by End User, 2018 to 2033

Figure 121: Oceania Market Volume (MT) Analysis by End User, 2018 to 2033

Figure 122: Oceania Market Value Share (%) and BPS Analysis by End User, 2023 to 2033

Figure 123: Oceania Market Y-o-Y Growth (%) Projections by End User, 2023 to 2033

Figure 124: Oceania Market Attractiveness by Product Type, 2023 to 2033

Figure 125: Oceania Market Attractiveness by End User, 2023 to 2033

Figure 126: Oceania Market Attractiveness by Country, 2023 to 2033

Figure 127: MEA Market Value (US$ Million) by Product Type, 2023 to 2033

Figure 128: MEA Market Value (US$ Million) by End User, 2023 to 2033

Figure 129: MEA Market Value (US$ Million) by Country, 2023 to 2033

Figure 130: MEA Market Value (US$ Million) Analysis by Country, 2018 to 2033

Figure 131: MEA Market Volume (MT) Analysis by Country, 2018 to 2033

Figure 132: MEA Market Value Share (%) and BPS Analysis by Country, 2023 to 2033

Figure 133: MEA Market Y-o-Y Growth (%) Projections by Country, 2023 to 2033

Figure 134: MEA Market Value (US$ Million) Analysis by Product Type, 2018 to 2033

Figure 135: MEA Market Volume (MT) Analysis by Product Type, 2018 to 2033

Figure 136: MEA Market Value Share (%) and BPS Analysis by Product Type, 2023 to 2033

Figure 137: MEA Market Y-o-Y Growth (%) Projections by Product Type, 2023 to 2033

Figure 138: MEA Market Value (US$ Million) Analysis by End User, 2018 to 2033

Figure 139: MEA Market Volume (MT) Analysis by End User, 2018 to 2033

Figure 140: MEA Market Value Share (%) and BPS Analysis by End User, 2023 to 2033

Figure 141: MEA Market Y-o-Y Growth (%) Projections by End User, 2023 to 2033

Figure 142: MEA Market Attractiveness by Product Type, 2023 to 2033

Figure 143: MEA Market Attractiveness by End User, 2023 to 2033

Figure 144: MEA Market Attractiveness by Country, 2023 to 2033

Recommendations

Food and Beverage

Home Brew Boiler Market

Published : December 2022

Food and Beverage

Draught Beer Chiller Market

Published : December 2022

Food and Beverage

Stock Tank Market

Published : December 2022

Food and Beverage

Continuous Fryer Machine Market

Published : December 2022

Explore Food and Beverage Insights

View Reports