Private Tutoring Market Size and Share Forecast Outlook (2024 to 2034)

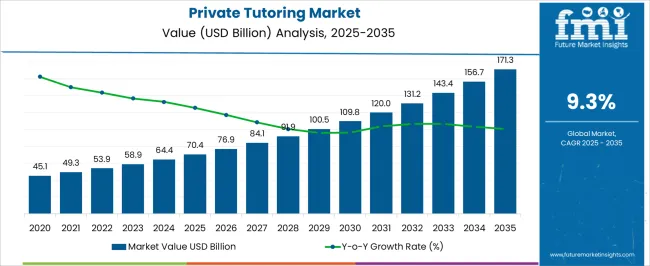
The private tutoring market is marked to progress at a CAGR of 9.3% through 2034. Parents' trust in private tutors for their children's education boosts their demand. A variety of lessons offered by private tutors enhances the market outlook. Online booking of private tutors adds a new dimension to the market as well. Depending on these trends, the market is riding the wave of proliferation, reaching USD 157.0 billion by 2034 from USD 64.4 billion in 2024.

Investment Opportunities in the Private Tutoring Market

  • Investing in AI technology for personalized learning experiences and adaptive tutoring systems to enhance the effectiveness of private tutoring services.
  • Spending in robust online tutoring platforms with interactive features and seamless user experience to cater to the demand for remote learning.
  • Participating in niche and high-demand areas such as test preparation and language tutoring to satisfy specific market segments.
Attributes Details
Market Size, 2024 USD 64.4 billion
Market Size, 2034 USD 157.0 billion
Value CAGR (2024 to 2034) 9.3%

Drivers Shaping the Expansion of the Private Tutoring Industry

Reforming Education System and Technological Developments

Adoption of private tutoring surges due to changes in the education system all over the world. Several countries are reforming their education system by changing educational infrastructure and academics. By implementing a more competitive and examination-oriented education system, market players are offering additional support for students for a better understanding of their studies.

Integration of the latest technological advancements is proving fruitful for the market. Private tutors started providing digital tutorial platforms to students for a better understanding. Private tutoring companies have gained more potential in recent years by integrating artificial intelligence (AI) into educational studies.

Increased Competition and Income

In every field, increased competition can be observed, and private tutoring is no exception. Competition in admissions in reputed universities and jobs is driving the demand for private tutoring. Their students are looking for ways to sustain themselves in the competition by appointing private tutors for their studies and educational purposes.

The surge in Income of the middle-class segment is providing benefits to the market in the current period. Higher Income has made private tutoring more affordable to people in recent years. Social media culture is on the rise, where people are seeking new learnings. Thus, private tutoring is gaining popularity in the sector.

Challenges Impacting the Growth of the Private Tutoring Market

  • An intense competition is visible in the market. Various key players are expanding their offerings according to consumer preferences which makes it challenging for emerging companies to sustain the market competition.
  • The high cost of these tutors is hampering the growth of the market. People having lower income and lower-middle-class people are not able to afford these private tutors. Therefore, those who cannot afford private tutoring are relying on the government for their primary learning.
  • Popularity of educational platforms such as YouTube, Google, and others are hindering market growth in the current period. People are more attracted to these platforms as they provide learning free of cost and at a very low price.

Private Tutoring Industry Analysis by Top Investment Segments

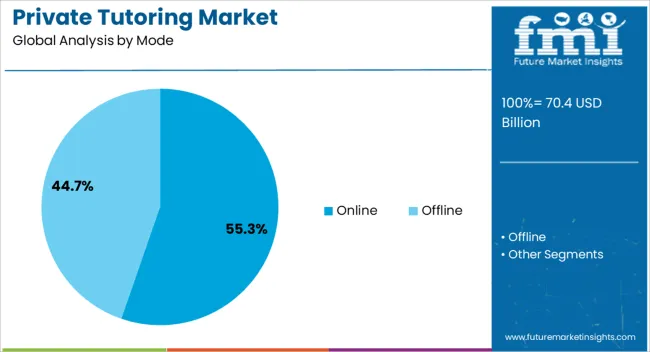
The Offline Segment is Dominating the Market by Mode

Attributes Details
Mode of Transportation Offline
Market CAGR from 2024 to 2034 9.1%

Need for personalized and targeted education is anticipated to optimize the outlook of this segment during the forecast period. The offline segment has gained popularity over the years by offering one-to-one interaction and a more personalized learning experience. However, a rise in focused and targeted learning environments is leading the segment's growth. Students can learn without any disturbance in the online environment.

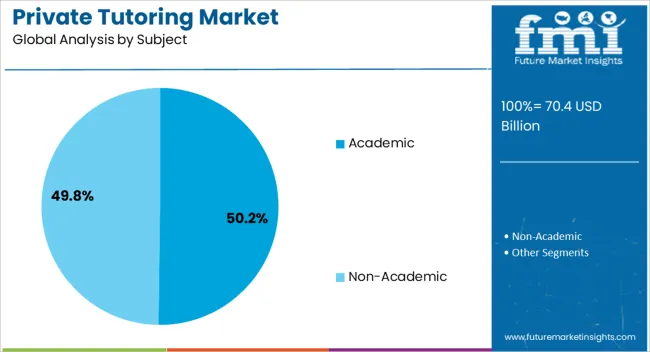
The Academic Segment is Gaining popularity in the Market by Subject

Attributes Details
Product Type Academic
Market CAGR from 2024 to 2034 8.9%

The changing structure of the education system and increasing competition among students in academics leads to the growth of the segment. In recent years, students have been getting support from private tutors for a better understanding of their studies. Also, private tutoring services have been seen as providing a greater understanding of the syllabus and studies over the school and colleges; thus, students prefer private tutoring for their academic purposes.

Analysis of Top Countries Advancing Private Tutoring Services

Countries CAGR from 2024 to 2034
United States 9.6%
China 9.9%
United Kingdom 10.3%
Japan 10.9%
South Korea 11.1%

United States

The United States is one of the most technologically advanced region in the world. The government of the United States is actively spending on its education infrastructure.

The government collaborates with schools, colleges, and other educational institutes to improve the condition of education. Also, private tutoring companies are leveraging the benefits, by building partnerships and collaborations with government educational schemes and others. Parents are increasingly investing in their student education to support their children.

Families that have higher incomes frequently spending more on their children's education in the United States. These families are increasingly able to give special facilities to their children such as appointing private tutors, home-based educational facilities, and others. For instance, Chegg Inc., a United States-based Edtech company launched a new feature called Learn with Chegg. It provides customized learning options to students integrating with AI support.

China

Private tutoring companies in China are heavily investing in research and development activities. They are launching new features and software that prioritize student convenience. Also, the modern lifestyle is making a huge contribution to the market share in the current period. Parents are aware of the benefits of providing a smart education system to their children. Private tutoring companies are offering more facilities than public institutes in China.

Online private tutoring is gaining popularity in the country, providing students with many facilities on their own devices or wherever they are. However, despite these benefits providing a solid structure to the education system, there are also concerns restraining market growth in the country, such as high costs of this system, stringent government policies, and others.

United Kingdom

Private tutoring trends in the United Kingdom have been increasing in recent years. Students are rigorously opting for home tuition more than public tuition such as college or school. Private tutoring companies are expanding their facilities in the United Kingdom.

Ethnic background is contributing to market growth in the United Kingdom. According to the report, students of Asian ethnicities have received home tuition at some point in recent years in the United Kingdom, which is higher than the overall national average of 25%.

Japan

Competition in academics has rapidly increased in Japan. Securing admission to reputable universities is seen as a challenging aspect in the country. Thus the demand for private tutoring institutes has increased in recent years in the country. Parents are seeking better educational facilities for their children in the country.

South Korea

The educational reform has played a major role in the growth of the market in South Korea. With the introduction of the new curriculum and several changes in the examinations thus, parents and students are seeking additional support for their studies. This is encouraging the private tutoring market growth in Japan.
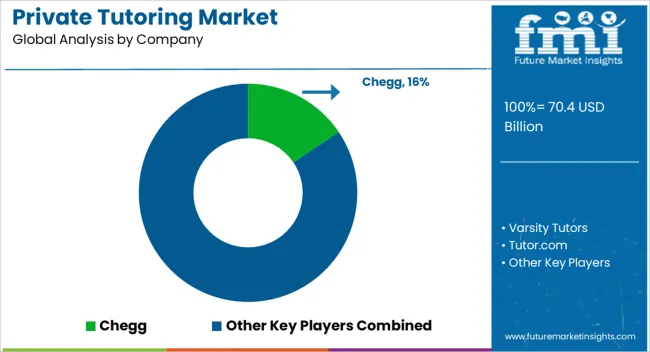
Competitive Landscape of the Private Tutoring Market

Private tutoring companies are looking to improve consumer experience by implementing new marketing strategies in the current period. The market is anticipated to experience exponential growth during the forecast period owing to innovations and research. Key players are investing in their educational infrastructure and services to gain maximum market share. Many governments are collaborating with private tutoring institutions to provide better facilities to their citizens.

Partnerships and Collaborations

In 2023, Chegg Inc. expanded its offerings by acquiring Mathway, a platform that specializes in solving mathematical problems. Its latest acquisition of Mathway, a popular mathematics-focused problem-solving platform, expands its reach in the STEM field. Mathway has been helping students solve complex math problems for over a decade, and its acquisition by Chegg is expected to provide students with an even wider range of resources to improve their academic performance.

Recent Developments

  • In 2022, LEO (Learner Engagements Online), an innovative institutional tutoring platform, was launched by Tutor.com, a New York-based online tutoring company. This platform is designed to provide 24/7 academic support services to both institutions and students. LEO offers actionable analytics and scheduling tools that centralize academic support services, making it easier for students to access them. With LEO, institutions can provide personalized learning experiences, track progress, and measure outcomes, while students can receive on-demand support and get insights about their academic performance. This platform is a great solution for anyone looking to improve their learning outcomes and achieve academic success.
  • In 2020, an Indian EdTech Company called Byju's launched a new online tutoring service. This service is designed to provide after-school tuition to students via live sessions. It is aimed at helping students with their studies and providing them with additional support outside of their regular school hours. Byju's is known for its innovative approach to education and has become a popular choice among students in India. The company is committed to making education more accessible and affordable to all, and this new service is just one of the ways it is working towards that goal.

Leading Players in the Private Tutoring Sector

  • Chegg
  • Club Z!
  • Varsity Tutors
  • Wyzant
  • TutorMe
  • Skooli
  • Preply
  • Tutor Doctor
  • Tutor.com
  • Sylvan Learning.

Scope and Coverage of the Private Tutoring Market Report

  • Online Private Tutoring Industry Market Report
  • Tutoring Services Market Analysis
  • Tutoring Industry Trends Assessment
  • United States Tutoring Industry Overview
  • Tutoring Industry Revenue Outlook

Overview of Analytical Coverage and Study Boundaries for the Private Tutoring Industry

By Mode:

  • Offline
  • Online

By Application:

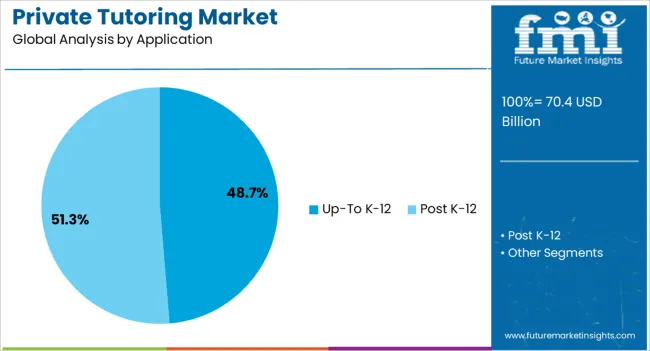
  • Up-to K-12
  • Post K-12

By Subject:

  • Academic
  • Non-academic

By Duration:

  • Short-term Courses
  • Long-term Courses

By Tutoring Style:

  • Test Preparation Service
  • Subject Tutoring Service

By Region:

  • North America
  • Latin America
  • Western Europe
  • Eastern Europe
  • Asia Pacific Excluding Japan
  • Japan
  • Middle East & Africa

Table of Content

  • 1. Executive Summary
  • 2. Market Overview
  • 3. Market Background
  • 4. Global Market Analysis 2019 to 2023 and Forecast, 2024 to 2034
  • 5. Global Market Analysis 2019 to 2023 and Forecast 2024 to 2034, By Mode
    • 5.1. Offline
    • 5.2. Online
  • 6. Global Market Analysis 2019 to 2023 and Forecast 2024 to 2034, By Application
    • 6.1. Up-to K-12
    • 6.2. Post K-12
  • 7. Global Market Analysis 2019 to 2023 and Forecast 2024 to 2034, By Subject
    • 7.1. Academic
    • 7.2. Non-Academic
  • 8. Global Market Analysis 2019 to 2023 and Forecast 2024 to 2034, By Duration
    • 8.1. Short-Term Courses
    • 8.2. Long-Term Courses
  • 9. Global Market Analysis 2019 to 2023 and Forecast 2024 to 2034, By Tutoring Style
    • 9.1. Test Preparation Service
    • 9.2. Subject Tutoring Service
  • 10. Global Market Analysis 2019 to 2023 and Forecast 2024 to 2034, By Region
    • 10.1. North America
    • 10.2. Latin America
    • 10.3. Western Europe
    • 10.4. Eastern Europe
    • 10.5. South Asia and Pacific
    • 10.6. East Asia
    • 10.7. Middle East and Africa
  • 11. North America Market Analysis 2019 to 2023 and Forecast 2024 to 2034, By Country
  • 12. Latin America Market Analysis 2019 to 2023 and Forecast 2024 to 2034, By Country
  • 13. Western Europe Market Analysis 2019 to 2023 and Forecast 2024 to 2034, By Country
  • 14. Eastern Europe Market Analysis 2019 to 2023 and Forecast 2024 to 2034, By Country
  • 15. South Asia and Pacific Market Analysis 2019 to 2023 and Forecast 2024 to 2034, By Country
  • 16. East Asia Market Analysis 2019 to 2023 and Forecast 2024 to 2034, By Country
  • 17. Middle East and Africa Market Analysis 2019 to 2023 and Forecast 2024 to 2034, By Country
  • 18. Key Countries Market Analysis
  • 19. Market Structure Analysis
  • 20. Competition Analysis
    • 20.1. Chegg, Inc.
    • 20.2. Mathnasium LLC
    • 20.3. Educomp Solutions Ltd.
    • 20.4. Sylvan Learning, LLC
    • 20.5. Daekyo Co., Ltd.
    • 20.6. Kumon Institute of Education Co., Ltd.
    • 20.7. Kaplan Inc.
    • 20.8. Action Tutoring
    • 20.9. Varsity Tutors
    • 20.10. Tutors International
  • 21. Assumptions & Acronyms Used
  • 22. Research Methodology

List of Tables

Table 1: Global Market Value (US$ Million) Forecast by Region, 2019 to 2034

Table 2: Global Market Value (US$ Million) Forecast by Mode, 2019 to 2034

Table 3: Global Market Value (US$ Million) Forecast by Application, 2019 to 2034

Table 4: Global Market Value (US$ Million) Forecast by Subject, 2019 to 2034

Table 5: Global Market Value (US$ Million) Forecast by Duration, 2019 to 2034

Table 6: Global Market Value (US$ Million) Forecast by Tutoring Style, 2019 to 2034

Table 7: North America Market Value (US$ Million) Forecast by Country, 2019 to 2034

Table 8: North America Market Value (US$ Million) Forecast by Mode, 2019 to 2034

Table 9: North America Market Value (US$ Million) Forecast by Application, 2019 to 2034

Table 10: North America Market Value (US$ Million) Forecast by Subject, 2019 to 2034

Table 11: North America Market Value (US$ Million) Forecast by Duration, 2019 to 2034

Table 12: North America Market Value (US$ Million) Forecast by Tutoring Style, 2019 to 2034

Table 13: Latin America Market Value (US$ Million) Forecast by Country, 2019 to 2034

Table 14: Latin America Market Value (US$ Million) Forecast by Mode, 2019 to 2034

Table 15: Latin America Market Value (US$ Million) Forecast by Application, 2019 to 2034

Table 16: Latin America Market Value (US$ Million) Forecast by Subject, 2019 to 2034

Table 17: Latin America Market Value (US$ Million) Forecast by Duration, 2019 to 2034

Table 18: Latin America Market Value (US$ Million) Forecast by Tutoring Style, 2019 to 2034

Table 19: Western Europe Market Value (US$ Million) Forecast by Country, 2019 to 2034

Table 20: Western Europe Market Value (US$ Million) Forecast by Mode, 2019 to 2034

Table 21: Western Europe Market Value (US$ Million) Forecast by Application, 2019 to 2034

Table 22: Western Europe Market Value (US$ Million) Forecast by Subject, 2019 to 2034

Table 23: Western Europe Market Value (US$ Million) Forecast by Duration, 2019 to 2034

Table 24: Western Europe Market Value (US$ Million) Forecast by Tutoring Style, 2019 to 2034

Table 25: Eastern Europe Market Value (US$ Million) Forecast by Country, 2019 to 2034

Table 26: Eastern Europe Market Value (US$ Million) Forecast by Mode, 2019 to 2034

Table 27: Eastern Europe Market Value (US$ Million) Forecast by Application, 2019 to 2034

Table 28: Eastern Europe Market Value (US$ Million) Forecast by Subject, 2019 to 2034

Table 29: Eastern Europe Market Value (US$ Million) Forecast by Duration, 2019 to 2034

Table 30: Eastern Europe Market Value (US$ Million) Forecast by Tutoring Style, 2019 to 2034

Table 31: South Asia and Pacific Market Value (US$ Million) Forecast by Country, 2019 to 2034

Table 32: South Asia and Pacific Market Value (US$ Million) Forecast by Mode, 2019 to 2034

Table 33: South Asia and Pacific Market Value (US$ Million) Forecast by Application, 2019 to 2034

Table 34: South Asia and Pacific Market Value (US$ Million) Forecast by Subject, 2019 to 2034

Table 35: South Asia and Pacific Market Value (US$ Million) Forecast by Duration, 2019 to 2034

Table 36: South Asia and Pacific Market Value (US$ Million) Forecast by Tutoring Style, 2019 to 2034

Table 37: East Asia Market Value (US$ Million) Forecast by Country, 2019 to 2034

Table 38: East Asia Market Value (US$ Million) Forecast by Mode, 2019 to 2034

Table 39: East Asia Market Value (US$ Million) Forecast by Application, 2019 to 2034

Table 40: East Asia Market Value (US$ Million) Forecast by Subject, 2019 to 2034

Table 41: East Asia Market Value (US$ Million) Forecast by Duration, 2019 to 2034

Table 42: East Asia Market Value (US$ Million) Forecast by Tutoring Style, 2019 to 2034

Table 43: Middle East and Africa Market Value (US$ Million) Forecast by Country, 2019 to 2034

Table 44: Middle East and Africa Market Value (US$ Million) Forecast by Mode, 2019 to 2034

Table 45: Middle East and Africa Market Value (US$ Million) Forecast by Application, 2019 to 2034

Table 46: Middle East and Africa Market Value (US$ Million) Forecast by Subject, 2019 to 2034

Table 47: Middle East and Africa Market Value (US$ Million) Forecast by Duration, 2019 to 2034

Table 48: Middle East and Africa Market Value (US$ Million) Forecast by Tutoring Style, 2019 to 2034

List of Figures

Figure 1: Global Market Value (US$ Million) by Mode, 2024 to 2034

Figure 2: Global Market Value (US$ Million) by Application, 2024 to 2034

Figure 3: Global Market Value (US$ Million) by Subject, 2024 to 2034

Figure 4: Global Market Value (US$ Million) by Duration, 2024 to 2034

Figure 5: Global Market Value (US$ Million) by Tutoring Style, 2024 to 2034

Figure 6: Global Market Value (US$ Million) by Region, 2024 to 2034

Figure 7: Global Market Value (US$ Million) Analysis by Region, 2019 to 2034

Figure 8: Global Market Value Share (%) and BPS Analysis by Region, 2024 to 2034

Figure 9: Global Market Y-o-Y Growth (%) Projections by Region, 2024 to 2034

Figure 10: Global Market Value (US$ Million) Analysis by Mode, 2019 to 2034

Figure 11: Global Market Value Share (%) and BPS Analysis by Mode, 2024 to 2034

Figure 12: Global Market Y-o-Y Growth (%) Projections by Mode, 2024 to 2034

Figure 13: Global Market Value (US$ Million) Analysis by Application, 2019 to 2034

Figure 14: Global Market Value Share (%) and BPS Analysis by Application, 2024 to 2034

Figure 15: Global Market Y-o-Y Growth (%) Projections by Application, 2024 to 2034

Figure 16: Global Market Value (US$ Million) Analysis by Subject, 2019 to 2034

Figure 17: Global Market Value Share (%) and BPS Analysis by Subject, 2024 to 2034

Figure 18: Global Market Y-o-Y Growth (%) Projections by Subject, 2024 to 2034

Figure 19: Global Market Value (US$ Million) Analysis by Duration, 2019 to 2034

Figure 20: Global Market Value Share (%) and BPS Analysis by Duration, 2024 to 2034

Figure 21: Global Market Y-o-Y Growth (%) Projections by Duration, 2024 to 2034

Figure 22: Global Market Value (US$ Million) Analysis by Tutoring Style, 2019 to 2034

Figure 23: Global Market Value Share (%) and BPS Analysis by Tutoring Style, 2024 to 2034

Figure 24: Global Market Y-o-Y Growth (%) Projections by Tutoring Style, 2024 to 2034

Figure 25: Global Market Attractiveness by Mode, 2024 to 2034

Figure 26: Global Market Attractiveness by Application, 2024 to 2034

Figure 27: Global Market Attractiveness by Subject, 2024 to 2034

Figure 28: Global Market Attractiveness by Duration, 2024 to 2034

Figure 29: Global Market Attractiveness by Tutoring Style, 2024 to 2034

Figure 30: Global Market Attractiveness by Region, 2024 to 2034

Figure 31: North America Market Value (US$ Million) by Mode, 2024 to 2034

Figure 32: North America Market Value (US$ Million) by Application, 2024 to 2034

Figure 33: North America Market Value (US$ Million) by Subject, 2024 to 2034

Figure 34: North America Market Value (US$ Million) by Duration, 2024 to 2034

Figure 35: North America Market Value (US$ Million) by Tutoring Style, 2024 to 2034

Figure 36: North America Market Value (US$ Million) by Country, 2024 to 2034

Figure 37: North America Market Value (US$ Million) Analysis by Country, 2019 to 2034

Figure 38: North America Market Value Share (%) and BPS Analysis by Country, 2024 to 2034

Figure 39: North America Market Y-o-Y Growth (%) Projections by Country, 2024 to 2034

Figure 40: North America Market Value (US$ Million) Analysis by Mode, 2019 to 2034

Figure 41: North America Market Value Share (%) and BPS Analysis by Mode, 2024 to 2034

Figure 42: North America Market Y-o-Y Growth (%) Projections by Mode, 2024 to 2034

Figure 43: North America Market Value (US$ Million) Analysis by Application, 2019 to 2034

Figure 44: North America Market Value Share (%) and BPS Analysis by Application, 2024 to 2034

Figure 45: North America Market Y-o-Y Growth (%) Projections by Application, 2024 to 2034

Figure 46: North America Market Value (US$ Million) Analysis by Subject, 2019 to 2034

Figure 47: North America Market Value Share (%) and BPS Analysis by Subject, 2024 to 2034

Figure 48: North America Market Y-o-Y Growth (%) Projections by Subject, 2024 to 2034

Figure 49: North America Market Value (US$ Million) Analysis by Duration, 2019 to 2034

Figure 50: North America Market Value Share (%) and BPS Analysis by Duration, 2024 to 2034

Figure 51: North America Market Y-o-Y Growth (%) Projections by Duration, 2024 to 2034

Figure 52: North America Market Value (US$ Million) Analysis by Tutoring Style, 2019 to 2034

Figure 53: North America Market Value Share (%) and BPS Analysis by Tutoring Style, 2024 to 2034

Figure 54: North America Market Y-o-Y Growth (%) Projections by Tutoring Style, 2024 to 2034

Figure 55: North America Market Attractiveness by Mode, 2024 to 2034

Figure 56: North America Market Attractiveness by Application, 2024 to 2034

Figure 57: North America Market Attractiveness by Subject, 2024 to 2034

Figure 58: North America Market Attractiveness by Duration, 2024 to 2034

Figure 59: North America Market Attractiveness by Tutoring Style, 2024 to 2034

Figure 60: North America Market Attractiveness by Country, 2024 to 2034

Figure 61: Latin America Market Value (US$ Million) by Mode, 2024 to 2034

Figure 62: Latin America Market Value (US$ Million) by Application, 2024 to 2034

Figure 63: Latin America Market Value (US$ Million) by Subject, 2024 to 2034

Figure 64: Latin America Market Value (US$ Million) by Duration, 2024 to 2034

Figure 65: Latin America Market Value (US$ Million) by Tutoring Style, 2024 to 2034

Figure 66: Latin America Market Value (US$ Million) by Country, 2024 to 2034

Figure 67: Latin America Market Value (US$ Million) Analysis by Country, 2019 to 2034

Figure 68: Latin America Market Value Share (%) and BPS Analysis by Country, 2024 to 2034

Figure 69: Latin America Market Y-o-Y Growth (%) Projections by Country, 2024 to 2034

Figure 70: Latin America Market Value (US$ Million) Analysis by Mode, 2019 to 2034

Figure 71: Latin America Market Value Share (%) and BPS Analysis by Mode, 2024 to 2034

Figure 72: Latin America Market Y-o-Y Growth (%) Projections by Mode, 2024 to 2034

Figure 73: Latin America Market Value (US$ Million) Analysis by Application, 2019 to 2034

Figure 74: Latin America Market Value Share (%) and BPS Analysis by Application, 2024 to 2034

Figure 75: Latin America Market Y-o-Y Growth (%) Projections by Application, 2024 to 2034

Figure 76: Latin America Market Value (US$ Million) Analysis by Subject, 2019 to 2034

Figure 77: Latin America Market Value Share (%) and BPS Analysis by Subject, 2024 to 2034

Figure 78: Latin America Market Y-o-Y Growth (%) Projections by Subject, 2024 to 2034

Figure 79: Latin America Market Value (US$ Million) Analysis by Duration, 2019 to 2034

Figure 80: Latin America Market Value Share (%) and BPS Analysis by Duration, 2024 to 2034

Figure 81: Latin America Market Y-o-Y Growth (%) Projections by Duration, 2024 to 2034

Figure 82: Latin America Market Value (US$ Million) Analysis by Tutoring Style, 2019 to 2034

Figure 83: Latin America Market Value Share (%) and BPS Analysis by Tutoring Style, 2024 to 2034

Figure 84: Latin America Market Y-o-Y Growth (%) Projections by Tutoring Style, 2024 to 2034

Figure 85: Latin America Market Attractiveness by Mode, 2024 to 2034

Figure 86: Latin America Market Attractiveness by Application, 2024 to 2034

Figure 87: Latin America Market Attractiveness by Subject, 2024 to 2034

Figure 88: Latin America Market Attractiveness by Duration, 2024 to 2034

Figure 89: Latin America Market Attractiveness by Tutoring Style, 2024 to 2034

Figure 90: Latin America Market Attractiveness by Country, 2024 to 2034

Figure 91: Western Europe Market Value (US$ Million) by Mode, 2024 to 2034

Figure 92: Western Europe Market Value (US$ Million) by Application, 2024 to 2034

Figure 93: Western Europe Market Value (US$ Million) by Subject, 2024 to 2034

Figure 94: Western Europe Market Value (US$ Million) by Duration, 2024 to 2034

Figure 95: Western Europe Market Value (US$ Million) by Tutoring Style, 2024 to 2034

Figure 96: Western Europe Market Value (US$ Million) by Country, 2024 to 2034

Figure 97: Western Europe Market Value (US$ Million) Analysis by Country, 2019 to 2034

Figure 98: Western Europe Market Value Share (%) and BPS Analysis by Country, 2024 to 2034

Figure 99: Western Europe Market Y-o-Y Growth (%) Projections by Country, 2024 to 2034

Figure 100: Western Europe Market Value (US$ Million) Analysis by Mode, 2019 to 2034

Figure 101: Western Europe Market Value Share (%) and BPS Analysis by Mode, 2024 to 2034

Figure 102: Western Europe Market Y-o-Y Growth (%) Projections by Mode, 2024 to 2034

Figure 103: Western Europe Market Value (US$ Million) Analysis by Application, 2019 to 2034

Figure 104: Western Europe Market Value Share (%) and BPS Analysis by Application, 2024 to 2034

Figure 105: Western Europe Market Y-o-Y Growth (%) Projections by Application, 2024 to 2034

Figure 106: Western Europe Market Value (US$ Million) Analysis by Subject, 2019 to 2034

Figure 107: Western Europe Market Value Share (%) and BPS Analysis by Subject, 2024 to 2034

Figure 108: Western Europe Market Y-o-Y Growth (%) Projections by Subject, 2024 to 2034

Figure 109: Western Europe Market Value (US$ Million) Analysis by Duration, 2019 to 2034

Figure 110: Western Europe Market Value Share (%) and BPS Analysis by Duration, 2024 to 2034

Figure 111: Western Europe Market Y-o-Y Growth (%) Projections by Duration, 2024 to 2034

Figure 112: Western Europe Market Value (US$ Million) Analysis by Tutoring Style, 2019 to 2034

Figure 113: Western Europe Market Value Share (%) and BPS Analysis by Tutoring Style, 2024 to 2034

Figure 114: Western Europe Market Y-o-Y Growth (%) Projections by Tutoring Style, 2024 to 2034

Figure 115: Western Europe Market Attractiveness by Mode, 2024 to 2034

Figure 116: Western Europe Market Attractiveness by Application, 2024 to 2034

Figure 117: Western Europe Market Attractiveness by Subject, 2024 to 2034

Figure 118: Western Europe Market Attractiveness by Duration, 2024 to 2034

Figure 119: Western Europe Market Attractiveness by Tutoring Style, 2024 to 2034

Figure 120: Western Europe Market Attractiveness by Country, 2024 to 2034

Figure 121: Eastern Europe Market Value (US$ Million) by Mode, 2024 to 2034

Figure 122: Eastern Europe Market Value (US$ Million) by Application, 2024 to 2034

Figure 123: Eastern Europe Market Value (US$ Million) by Subject, 2024 to 2034

Figure 124: Eastern Europe Market Value (US$ Million) by Duration, 2024 to 2034

Figure 125: Eastern Europe Market Value (US$ Million) by Tutoring Style, 2024 to 2034

Figure 126: Eastern Europe Market Value (US$ Million) by Country, 2024 to 2034

Figure 127: Eastern Europe Market Value (US$ Million) Analysis by Country, 2019 to 2034

Figure 128: Eastern Europe Market Value Share (%) and BPS Analysis by Country, 2024 to 2034

Figure 129: Eastern Europe Market Y-o-Y Growth (%) Projections by Country, 2024 to 2034

Figure 130: Eastern Europe Market Value (US$ Million) Analysis by Mode, 2019 to 2034

Figure 131: Eastern Europe Market Value Share (%) and BPS Analysis by Mode, 2024 to 2034

Figure 132: Eastern Europe Market Y-o-Y Growth (%) Projections by Mode, 2024 to 2034

Figure 133: Eastern Europe Market Value (US$ Million) Analysis by Application, 2019 to 2034

Figure 134: Eastern Europe Market Value Share (%) and BPS Analysis by Application, 2024 to 2034

Figure 135: Eastern Europe Market Y-o-Y Growth (%) Projections by Application, 2024 to 2034

Figure 136: Eastern Europe Market Value (US$ Million) Analysis by Subject, 2019 to 2034

Figure 137: Eastern Europe Market Value Share (%) and BPS Analysis by Subject, 2024 to 2034

Figure 138: Eastern Europe Market Y-o-Y Growth (%) Projections by Subject, 2024 to 2034

Figure 139: Eastern Europe Market Value (US$ Million) Analysis by Duration, 2019 to 2034

Figure 140: Eastern Europe Market Value Share (%) and BPS Analysis by Duration, 2024 to 2034

Figure 141: Eastern Europe Market Y-o-Y Growth (%) Projections by Duration, 2024 to 2034

Figure 142: Eastern Europe Market Value (US$ Million) Analysis by Tutoring Style, 2019 to 2034

Figure 143: Eastern Europe Market Value Share (%) and BPS Analysis by Tutoring Style, 2024 to 2034

Figure 144: Eastern Europe Market Y-o-Y Growth (%) Projections by Tutoring Style, 2024 to 2034

Figure 145: Eastern Europe Market Attractiveness by Mode, 2024 to 2034

Figure 146: Eastern Europe Market Attractiveness by Application, 2024 to 2034

Figure 147: Eastern Europe Market Attractiveness by Subject, 2024 to 2034

Figure 148: Eastern Europe Market Attractiveness by Duration, 2024 to 2034

Figure 149: Eastern Europe Market Attractiveness by Tutoring Style, 2024 to 2034

Figure 150: Eastern Europe Market Attractiveness by Country, 2024 to 2034

Figure 151: South Asia and Pacific Market Value (US$ Million) by Mode, 2024 to 2034

Figure 152: South Asia and Pacific Market Value (US$ Million) by Application, 2024 to 2034

Figure 153: South Asia and Pacific Market Value (US$ Million) by Subject, 2024 to 2034

Figure 154: South Asia and Pacific Market Value (US$ Million) by Duration, 2024 to 2034

Figure 155: South Asia and Pacific Market Value (US$ Million) by Tutoring Style, 2024 to 2034

Figure 156: South Asia and Pacific Market Value (US$ Million) by Country, 2024 to 2034

Figure 157: South Asia and Pacific Market Value (US$ Million) Analysis by Country, 2019 to 2034

Figure 158: South Asia and Pacific Market Value Share (%) and BPS Analysis by Country, 2024 to 2034

Figure 159: South Asia and Pacific Market Y-o-Y Growth (%) Projections by Country, 2024 to 2034

Figure 160: South Asia and Pacific Market Value (US$ Million) Analysis by Mode, 2019 to 2034

Figure 161: South Asia and Pacific Market Value Share (%) and BPS Analysis by Mode, 2024 to 2034

Figure 162: South Asia and Pacific Market Y-o-Y Growth (%) Projections by Mode, 2024 to 2034

Figure 163: South Asia and Pacific Market Value (US$ Million) Analysis by Application, 2019 to 2034

Figure 164: South Asia and Pacific Market Value Share (%) and BPS Analysis by Application, 2024 to 2034

Figure 165: South Asia and Pacific Market Y-o-Y Growth (%) Projections by Application, 2024 to 2034

Figure 166: South Asia and Pacific Market Value (US$ Million) Analysis by Subject, 2019 to 2034

Figure 167: South Asia and Pacific Market Value Share (%) and BPS Analysis by Subject, 2024 to 2034

Figure 168: South Asia and Pacific Market Y-o-Y Growth (%) Projections by Subject, 2024 to 2034

Figure 169: South Asia and Pacific Market Value (US$ Million) Analysis by Duration, 2019 to 2034

Figure 170: South Asia and Pacific Market Value Share (%) and BPS Analysis by Duration, 2024 to 2034

Figure 171: South Asia and Pacific Market Y-o-Y Growth (%) Projections by Duration, 2024 to 2034

Figure 172: South Asia and Pacific Market Value (US$ Million) Analysis by Tutoring Style, 2019 to 2034

Figure 173: South Asia and Pacific Market Value Share (%) and BPS Analysis by Tutoring Style, 2024 to 2034

Figure 174: South Asia and Pacific Market Y-o-Y Growth (%) Projections by Tutoring Style, 2024 to 2034

Figure 175: South Asia and Pacific Market Attractiveness by Mode, 2024 to 2034

Figure 176: South Asia and Pacific Market Attractiveness by Application, 2024 to 2034

Figure 177: South Asia and Pacific Market Attractiveness by Subject, 2024 to 2034

Figure 178: South Asia and Pacific Market Attractiveness by Duration, 2024 to 2034

Figure 179: South Asia and Pacific Market Attractiveness by Tutoring Style, 2024 to 2034

Figure 180: South Asia and Pacific Market Attractiveness by Country, 2024 to 2034

Figure 181: East Asia Market Value (US$ Million) by Mode, 2024 to 2034

Figure 182: East Asia Market Value (US$ Million) by Application, 2024 to 2034

Figure 183: East Asia Market Value (US$ Million) by Subject, 2024 to 2034

Figure 184: East Asia Market Value (US$ Million) by Duration, 2024 to 2034

Figure 185: East Asia Market Value (US$ Million) by Tutoring Style, 2024 to 2034

Figure 186: East Asia Market Value (US$ Million) by Country, 2024 to 2034

Figure 187: East Asia Market Value (US$ Million) Analysis by Country, 2019 to 2034

Figure 188: East Asia Market Value Share (%) and BPS Analysis by Country, 2024 to 2034

Figure 189: East Asia Market Y-o-Y Growth (%) Projections by Country, 2024 to 2034

Figure 190: East Asia Market Value (US$ Million) Analysis by Mode, 2019 to 2034

Figure 191: East Asia Market Value Share (%) and BPS Analysis by Mode, 2024 to 2034

Figure 192: East Asia Market Y-o-Y Growth (%) Projections by Mode, 2024 to 2034

Figure 193: East Asia Market Value (US$ Million) Analysis by Application, 2019 to 2034

Figure 194: East Asia Market Value Share (%) and BPS Analysis by Application, 2024 to 2034

Figure 195: East Asia Market Y-o-Y Growth (%) Projections by Application, 2024 to 2034

Figure 196: East Asia Market Value (US$ Million) Analysis by Subject, 2019 to 2034

Figure 197: East Asia Market Value Share (%) and BPS Analysis by Subject, 2024 to 2034

Figure 198: East Asia Market Y-o-Y Growth (%) Projections by Subject, 2024 to 2034

Figure 199: East Asia Market Value (US$ Million) Analysis by Duration, 2019 to 2034

Figure 200: East Asia Market Value Share (%) and BPS Analysis by Duration, 2024 to 2034

Figure 201: East Asia Market Y-o-Y Growth (%) Projections by Duration, 2024 to 2034

Figure 202: East Asia Market Value (US$ Million) Analysis by Tutoring Style, 2019 to 2034

Figure 203: East Asia Market Value Share (%) and BPS Analysis by Tutoring Style, 2024 to 2034

Figure 204: East Asia Market Y-o-Y Growth (%) Projections by Tutoring Style, 2024 to 2034

Figure 205: East Asia Market Attractiveness by Mode, 2024 to 2034

Figure 206: East Asia Market Attractiveness by Application, 2024 to 2034

Figure 207: East Asia Market Attractiveness by Subject, 2024 to 2034

Figure 208: East Asia Market Attractiveness by Duration, 2024 to 2034

Figure 209: East Asia Market Attractiveness by Tutoring Style, 2024 to 2034

Figure 210: East Asia Market Attractiveness by Country, 2024 to 2034

Figure 211: Middle East and Africa Market Value (US$ Million) by Mode, 2024 to 2034

Figure 212: Middle East and Africa Market Value (US$ Million) by Application, 2024 to 2034

Figure 213: Middle East and Africa Market Value (US$ Million) by Subject, 2024 to 2034

Figure 214: Middle East and Africa Market Value (US$ Million) by Duration, 2024 to 2034

Figure 215: Middle East and Africa Market Value (US$ Million) by Tutoring Style, 2024 to 2034

Figure 216: Middle East and Africa Market Value (US$ Million) by Country, 2024 to 2034

Figure 217: Middle East and Africa Market Value (US$ Million) Analysis by Country, 2019 to 2034

Figure 218: Middle East and Africa Market Value Share (%) and BPS Analysis by Country, 2024 to 2034

Figure 219: Middle East and Africa Market Y-o-Y Growth (%) Projections by Country, 2024 to 2034

Figure 220: Middle East and Africa Market Value (US$ Million) Analysis by Mode, 2019 to 2034

Figure 221: Middle East and Africa Market Value Share (%) and BPS Analysis by Mode, 2024 to 2034

Figure 222: Middle East and Africa Market Y-o-Y Growth (%) Projections by Mode, 2024 to 2034

Figure 223: Middle East and Africa Market Value (US$ Million) Analysis by Application, 2019 to 2034

Figure 224: Middle East and Africa Market Value Share (%) and BPS Analysis by Application, 2024 to 2034

Figure 225: Middle East and Africa Market Y-o-Y Growth (%) Projections by Application, 2024 to 2034

Figure 226: Middle East and Africa Market Value (US$ Million) Analysis by Subject, 2019 to 2034

Figure 227: Middle East and Africa Market Value Share (%) and BPS Analysis by Subject, 2024 to 2034

Figure 228: Middle East and Africa Market Y-o-Y Growth (%) Projections by Subject, 2024 to 2034

Figure 229: Middle East and Africa Market Value (US$ Million) Analysis by Duration, 2019 to 2034

Figure 230: Middle East and Africa Market Value Share (%) and BPS Analysis by Duration, 2024 to 2034

Figure 231: Middle East and Africa Market Y-o-Y Growth (%) Projections by Duration, 2024 to 2034

Figure 232: Middle East and Africa Market Value (US$ Million) Analysis by Tutoring Style, 2019 to 2034

Figure 233: Middle East and Africa Market Value Share (%) and BPS Analysis by Tutoring Style, 2024 to 2034

Figure 234: Middle East and Africa Market Y-o-Y Growth (%) Projections by Tutoring Style, 2024 to 2034

Figure 235: Middle East and Africa Market Attractiveness by Mode, 2024 to 2034

Figure 236: Middle East and Africa Market Attractiveness by Application, 2024 to 2034

Figure 237: Middle East and Africa Market Attractiveness by Subject, 2024 to 2034

Figure 238: Middle East and Africa Market Attractiveness by Duration, 2024 to 2034

Figure 239: Middle East and Africa Market Attractiveness by Tutoring Style, 2024 to 2034

Figure 240: Middle East and Africa Market Attractiveness by Country, 2024 to 2034

Frequently Asked Questions

How will the Private Tutoring Market Progress in the United States?

The CAGR of the private tutoring market in the United States from 2024 to 2034 is estimated to be 9.6%.

What is the Scope of the Private Tutoring Market?

The private tutoring market is expected to develop at a CAGR of 9.3% from 2024 to 2034.

How is the Private Tutoring Market?

The private tutoring market size is expected to be worth USD 64.4 billion in 2024.

How will the Private Tutoring Market Progress in China?

The CAGR of the private tutoring market in China from 2024 to 2034 is estimated to be 9.9%.

How Big Will the Private Tutoring Market be by 2034?

The private tutoring market is estimated to get as big as USD 157.0 billion by 2034.

What are the Segments of the Private Tutoring Market?

The private tutoring market is categorized by mode, application, subject, duration, tutoring style, and region.

Explore Similar Insights

Future Market Insights

Private Tutoring Market