This site uses cookies, including third-party cookies, that help us to provide and improve our services.

Privacy Policy
- Global Locations -
Headquarters
Future Market Insights, Inc.
Christiana Corporate, 200 Continental Drive, Suite 401, Newark, Delaware - 19713, United States
T: +1-845-579-5705
MEA
Market Access DMCC

1602-6 Jumeirah Bay X2 Tower, Plot No: JLT-PH2-X2A,

Jumeirah Lakes Towers, Dubai,

United Arab Emirates

Americas
Future Market Insights
616 Corporate Way, Suite 2-9018,
Valley Cottage, NY 10989,
United States
T: +1-347-918-3531
Europe
Future Market Insights
3rd Floor, 207 Regent Street,
London W1B 3HH
United Kingdom
T: + 44 (0) 20 8123 9659
D: +44 (0) 20 3287 4268
APAC
Future Market Insights
Office No. 401-A, 4th Floor,
VANTAGE 9, S.No. 36/1/1,
Baner, Pune 411045 India

Private Security Market

Private Security Deployment to rise amid rising Vulnerabilities to Personal Safety

Private Security Market by Service, End User & Region | Forecast 2022 to 2032.

Private Security Market Outlook (2022 to 2032)

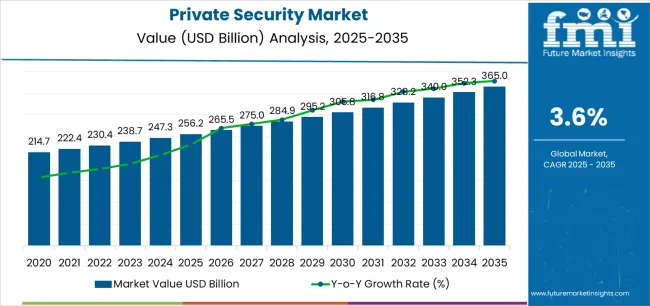
Based on the findings of the latest research carried out by Future Market Insights, it is predicted that the private security market will grow at a CAGR of 3.7% during the years 2022 to 2032. By 2032, the global private security market is estimated to generate a value of US$ 115,047.6 Million and is expected to reach US$ 80,000 Million by 2022.

The rapid growth of the private banking sector and expansion of the ATM network, along with growing concerns regarding the security of female employees at their workplaces, all of these factors have significantly increased the market demand for private security services. From 2016 to 2021, the market displayed a growth rate of 3.2%.

There has been a great deal of evolution in the globalization of the world and its market, which has offered new opportunities to several private sector businesses.

Due to advances in technology, many of the new players have proven that their services are worth more than the cash they have invested in them when it comes to market value, and that has boosted the world economy to a new level of success owing to the success of these new players in the global market.

As a result of the emergence of these private sectors in the economy, many aspiring and qualified workers now have the opportunity to gain employment as a means of helping to develop the gross value of the economy.

In the current climate, where crimes are on the rise, relying solely on the police is not an easy task, increasing crime rates and threats are all causing people to rely on their personal security, which in turn is driving the global security industry to continuously grow.

Private security companies are becoming more prominent at home at almost the same rate as global companies are using them. As a result of its prospects for rapid growth and increasing numbers of players, the business sector is regarded as one of the most attractive business sectors at present.

As a result of the burgeoning demand from the corporate sector, the private security industry has developed into a major industry that employs large numbers of skilled and unskilled labor. Growing concern over national security is becoming a greater priority, and the ratio of police to citizens has decreased in the country.

Private security, with its substantial manpower, is able to provide a valuable extension for law enforcement agencies. As a result, the police force will be relieved of non-critical duties so that they can focus on the core functions of the force.

There is also a need for proper enforcement of the regulatory framework that governs this industry. There are a lot of unorganized segments that have gone largely unchecked, and players, including employees and customers, often do not meet mandatory compliance requirements.

Governments must, therefore, make sure that the regulations are strictly enforced so that quality levels of service can be improved and employment conditions in the security industry can be enhanced.

Data Points

Key Statistics

Expected Base Year Value (2022)

US$ 80,000 Million

Anticipated Forecast Value (2032)

US$ 115,047.6 Million

Estimated Growth (2022 to 2032)

3.7% CAGR

Don't pay for what you don't need

Customize your report by selecting specific countries or regions and save 30%!

What are the Factors Driving the Demand for Private Security?

Security is becoming increasingly important in schools, offices, college campuses, and industries. It is commonly used in organizations and companies to issue identification cards or badges in order for them to be tracked and identified. Therefore, players can take advantage of this excellent opportunity to enhance their security and position in a competitive market.

There is a growing trend of hiring a personal security guard for modern-class families, public figures, VIPs, major witnesses, and high-profile individuals. The safety of one's home, child, possessions, and money is the most pressing concern for middle-class families. This concern, however, has been mitigated through the Internet of Things (IoT).

A large number of private security firms offer CCTV surveillance, private alarms, emergency flashlights, portable door locks, and other related services. Providing a cost-effective way to access personal safety devices encourages customers to use these devices and draws more attention to this type of product, generating more revenue and making the company more successful in the market.

As part of the security and surveillance services, players also provide robots and drones that perform surveillance tasks. As a result of the enormous crowds at sports events and music concerts - as well as other programs involving large crowds - it is extremely difficult to track the activities of each individual in these events and programs. To decrease the dangers of violence and public disorder, all of these programs employ drones to track the movements of individuals.

It is easier now for parties providing services to exchange information using technology. This has made the industry more reliable as key market players provide supportive security services to various businesses in the market. Online communications are efficiently conducted using mobile devices and other gadgets. Private banking sector growth and an increase in capital transportation to ATM locations have further stimulated the private security industry.

A secure online portal is used to send updates, and statements about incidents, and to conduct corrective and preventive actions. Due to improvisation in the private security market, technology has evolved and modified services. Among the significant trends observed in the global private security service market is the use of automation and robotics for security objects.

How is the Private Security Market Limiting Business Growth?

Private security firms have a number of disadvantages when it comes to the quality of service that they provide to various businesses. An employee who works for a third-party business on a contract basis tends to be less loyal to them. It's easier for them to comply with standards set by third parties since they're usually paid less than career security workers.

Even though they are employed by the same organization as career staff, there may be plenty of resentment among them due to the fact they are not offered the same benefits as career staff. In addition to affecting overall performance, high turnover can be a disadvantage. Security personnel with high levels of training and experience often prefer to work on a career basis rather than on a contractual basis.

As part of the contract security industry, there are also few to no advancement opportunities for security professionals within this industry. Therefore, businesses may not be able to provide the highest quality of service to their customers. Further, these factors inhibit the growth of this business.

Sneha Verghese
Sneha Verghese
Principal Consultant
LinkedIn
Talk to Analyst

Find your sweet spots for generating winning opportunities in this market.

Talk to Analyst

Country-wise Insight

What Makes North America the World's Leading Private Security Sector?

The private security market in North America is expected to grow exponentially over the next few years. Several factors are contributing to this growth including the growing demand for the protection of celebrities and events, as well as the growth of offices in this region. According to estimates, North American private security's market share will grow by 28.7% by 2022. Businesses will have ample opportunity to capitalize on this growth.

There has been a rapid expansion in the personal security sector over the past few years. The USA and Canada place a great deal of emphasis on security because it plays such an important role in safeguarding the safety of their citizens.

The job of a security officer entails more than simply keeping tabs on hospitals, institutions, individuals, and organizations. It involves taking responsibility for intellectual property and privacy as well as protecting the assets entrusted to the organization.

Threats from domestic and foreign sources as well as an increase in criminal activity explain the growth in USA and Canadian security. A combination of violent crimes (including rape, domestic violence, robbery, homicide, murder, and non-negligent manslaughter), along with property crimes (including burglary, auto theft, larceny, arson, etc.), have been on the rise.

For players in the region, it is an excellent opportunity to expand their businesses. For instance, GardaWorld provides citizens in Canada with highly focused security, cash management, and leading-edge security solutions. With over 500 offices around the world, the organization offers services to customers in over 45 countries around the world. They work primarily with ABB Libya, L'Oréal, the American Red Cross, and BMO Financial Group.

How Personal Security Demand Outlook is growing in Europe?

Compared to multistory buildings, flats, and apartment towers, the demand for personal security is very high in villa houses, plots, and private residences in European countries. There are guards available at the entrance, and each person is recorded, in the societies and buildings where guards are present. It is expected that in 2022, the private security market share in Europe will reach 17.5%.

A personal security company is also often used by people moving overseas for jobs or by business owners in order to ensure that their property and families are protected. For players, this is a good opportunity to gain customer attention from both males and females.

Additionally, a lot of wealthy people in France and Germany have hired personal security services as a way of showing their standards and royalties. A company that continues to work with royal people is also able to strengthen its ties with royal subjects, increase the value of its brand and become more competitive in the marketplace by continuing to work with royals.

As well as supporting national governments and the EU, private security companies work to develop legislation. For instance, A security company in Italy, CoEss, offers security services at EU institutions, nuclear plants, national governments, ground transportation centers, airports, subway stations, transportation hubs, and institutions (such as educational institutions, asylum seekers centers, health centers, etc.).

Category-wise Insights

How are Commercial Sectors Growing the Market for Private Security?

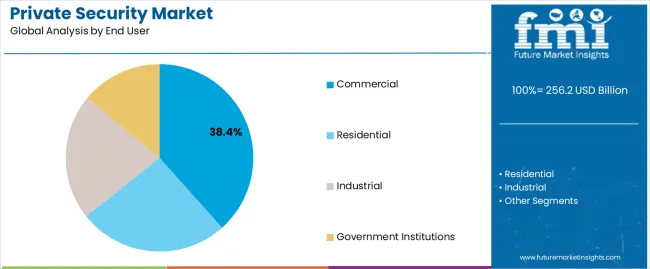
Based on end-user type, the market is segmented into residential, industrial, commercial, and government institutions. Market growth for private security is expected to be driven by commercial sectors. Security is one of the most important responsibilities businesses have toward their employees. Providing a safe, crime-free work environment simplifies the hiring process, makes employees happier, and discourages internal fraud and crime.

Security systems that are visible and strong can deter criminal activity for internal and external crimes on the premises. By installing access control systems and hiring security personnel at key locations, businesses ensure that unauthorized personnel cannot enter these premises, whether on purpose or by accident. These factors will all contribute to the growth of the private security market for commercial purposes.

How will Security Systems Significantly Grow the Private Security Market?

It is widely accepted that urbanization has peaked over many of the capital cities in many different regions of various countries, and this has resulted in a more organized crime occurring in many different parts of the world. The need for greater public safety measures has grown due to the increased threat of fraud, theft, alcohol abuse, drug-related violence, aggravated crimes, and terrorist activities. These factors have prompted the installation of security systems in a wide range of public and private places.

In recent years, security systems have gained traction in the banking and ATM sectors. Market demand for security systems in various residential buildings has been created by technological advances and growing working populations worldwide. Various developing nations have also seen a rise in theft and crimes committed, which has created a market for security systems.

With the use of multiple security systems such as real-time monitoring, business management teams can monitor their facilities and work areas instantly. All these factors have caused private security companies to install security systems at a wide range of locations and for clients.

Get the data you need at a Fraction of the cost

Personalize your report by choosing insights you need
and save 40%!

How do Start-ups Grow their Business in the Private Security Market?

To maintain its market position, the company will need to hire more skilled security guards and enforce strict regulations. In order to grow the security business in the market, start-up focuses on providing the best and most highly qualified professionals. As a result, there is a great deal of focus on technology-based equipment and devices that are designed to enhance better security for the clients of many private sectors.

  • Security Guard was founded in 2018 in San Jose, USA. An app for security guards is provided by Security Guard. Reports are customized, GPS tracking is available, in-app messaging is available, orders are placed, order history is tracked, live notifications are sent, and a time clock system is already in place. As a part of its partnership program, it works with Coastline Security, Sharayu Security Services, Kellington Protection, Buford Security Agency, and Harbour Security Company.
  • ShieldUp was founded in 2016 in Delhi, India. ShieldUp offers a platform for finding and booking personal bodyguards online. Charges are based on an hourly rate. Ensures that all security personnel has a clean background.
  • Ansnei was founded in 2015, in Copenhagen, Denmark. A security guard marketplace available on iOS and Android, Ansnei is an online and mobile-based service. In order to access the company's services, users must register online and pay a one-time membership fee. With the company's online platform, members can reserve and pay for guard services (armed/unarmed) at convenient times and dates. In order to provide its services, the company partners with local security guard companies and independent professionals. Online registration is available for security guards interested in working for the company.

Competition Analysis

A moderate fragmentation can be observed in the private market due to the presence of large key players. A few of the major players are:

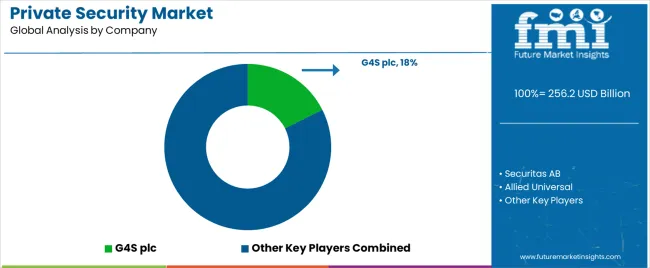
Ava Security, Securitas AB, DynCrop, GALLAGHER GROUP LIMITED, G4S Plc., ADT Inc., CACI International Inc., CoEss, Prosegur Compañía de Seguridad SA, EXECUTIVE PROTECTION Inc., Allied Universal, Hanweiss.com, GardaWorld, Japan Security and Intelligence Corps., Tops Security Ltd, Kokusai Security Pte Ltd, Control Risks, Loomis AB, The Brink’s Company, Armour Security Pvt Ltd., Security & Intelligence Services India Ltd., Ansnei, ShieldUp, and Security Gaurd.

  • In September 2022, a total of 1,094 Private Security Agency (PSA) employees will be employed at 60 airports to replace the Central Industrial Security Force (CISF). CISF troops will be deployed to other airports, which will strengthen security even further. This decision will lower security spending. New domestic and international airports will be easier to open as a result. 581 security guards have been hired by the Airports Authority of India (AAI) to fill non-core positions at 45 airports. These security officers are deployed at specific airports after completing aviation security training. Three private security agencies attended an Aviation Security Induction Training at AAI's Aviation Security Training Institute in Guwahati on 23rd September.
  • In October 2022, Ranger Guard will combine law enforcement and military best practices to provide clients with unbeatable security in the market. Besides providing armed guard services, the company also offers parking lot security, fire watch, construction site security, and other specialized services.

Report Scope

Report Attribute

Details

Growth Rate

CAGR of 3.7% from 2022 to 2032

Market Value in 2022

US$ 80,000 Million

Market Value in 2032

US$ 115,047.6 Million

Base Year for Estimation

2021

Historical Data

2017 to 2021

Forecast Period

2022 to 2032

Quantitative Units

Revenue in US$ Million and CAGR from 2022 to 2032

Report Coverage

Revenue Forecast, Company Ranking, Competitive Landscape, Growth Factors, Trends, and Pricing Analysis

Segments Covered

  • Service
  • End User
  • Region

Regions Covered

  • North America
  • Latin America
  • Europe
  • Asia Pacific
  • Middle East and Africa

Key Countries Profiled

  • USA
  • Canada
  • Brazil
  • Mexico
  • Germany
  • United Kingdom
  • France
  • Spain
  • Italy
  • China
  • Japan
  • South Korea
  • Malaysia
  • Singapore
  • Australia
  • New Zealand
  • GCC Countries
  • South Africa
  • Israel

Key Companies Profiled

  • Ava Security
  • Securitas AB
  • DynCrop
  • GALLAGHER GROUP LIMITED
  • G4S Plc.
  • ADT Inc.
  • CACI International Inc.
  • CoEss
  • Prosegur Compañía de Seguridad SA
  • EXECUTIVE PROTECTION Inc.
  • Allied Universal
  • Hanweiss.com
  • GardaWorld
  • Japan Security and Intelligence Corps.
  • Tops Security Ltd
  • Kokusai Security Pte Ltd
  • Control Risks
  • Loomis AB
  • The Brink’s Company
  • Armour Security Pvt. Ltd.
  • Security & Intelligence Services India Ltd.
  • Ansnei
  • ShieldUp
  • Security Gaurd

Customization

Available Upon Request

Key Segments Profiled in the Global Private Security Market

Private Security Market by Service:

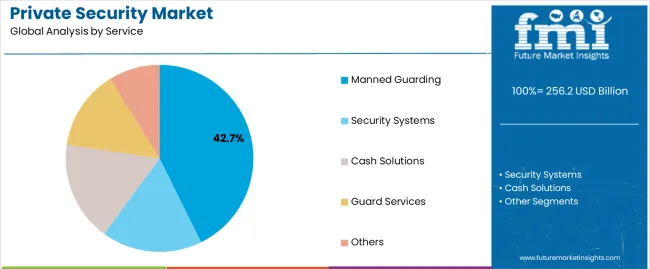
  • Manned Guarding in Private Security
  • Security Systems in Private Security
  • Cash Solutions in Private Security
  • Guard Services in Private Security
  • Other Private Security

Private Security Market by End Users:

  • Private Security for Residential
  • Private Security for Industrial
  • Private Security for Commercial
  • Private Security for Government Institutions

Private Security Market by Region:

  • North America Private Security Market
  • Latin America Private Security Market
  • Europe Private Security Market
  • Asia Pacific Private Security Market
  • Middle East & Africa Private Security Market

Frequently Asked Questions

FMI projects the global private security market to expand at a 3.7% value CAGR by 2032

North America is expected to be the most opportunistic private security market, accumulating 28.7% revenue in 2022

Ava Security, Securitas AB, DynCorp, GALLAGHER GROUP LIMITED, and G4S Plc. are the top 5 prominent private security businesses in the market

The global private security market will reach a valuation of US$ 80,000 million by the end of 2022.

USA Canada, Germany, United Kingdom France, Brazil, China, Japan, India, South Korea, and Australia are the major countries driving demand for the private security market.

Table of Content

1. Executive Summary | Private Security Market

    1.1. Global Market Outlook

    1.2. Demand-side Trends

    1.3. Supply-side Trends

    1.4. Technology Roadmap Analysis

    1.5. Analysis and Recommendations

2. Market Overview

    2.1. Market Coverage / Taxonomy

    2.2. Market Definition / Scope / Limitations

3. Market Background

    3.1. Market Dynamics

        3.1.1. Drivers

        3.1.2. Restraints

        3.1.3. Opportunity

        3.1.4. Trends

    3.2. Scenario Forecast

        3.2.1. Demand in Optimistic Scenario

        3.2.2. Demand in Likely Scenario

        3.2.3. Demand in Conservative Scenario

    3.3. Opportunity Map Analysis

    3.4. Investment Feasibility Matrix

    3.5. PESTLE and Porter’s Analysis

    3.6. Regulatory Landscape

        3.6.1. By Key Regions

        3.6.2. By Key Countries

    3.7. Regional Parent Market Outlook

4. Global Market Analysis 2017 to 2021 and Forecast, 2022 to 2032

    4.1. Historical Market Size Value (US$ Million) Analysis, 2017 to 2021

    4.2. Current and Future Market Size Value (US$ Million) Projections, 2022 to 2032

        4.2.1. Y-o-Y Growth Trend Analysis

        4.2.2. Absolute $ Opportunity Analysis

5. Global Market Analysis 2017 to 2021 and Forecast 2022 to 2032, By Service

    5.1. Introduction / Key Findings

    5.2. Historical Market Size Value (US$ Million) Analysis By Service, 2017 to 2021

    5.3. Current and Future Market Size Value (US$ Million) Analysis and Forecast By Service, 2022 to 2032

        5.3.1. Manned Guarding in Private Security

        5.3.2. Security Systems in Private Security

        5.3.3. Cash Solutions in Private Security

        5.3.4. Guard Services in Private Security

        5.3.5. Other in Private Security

    5.4. Y-o-Y Growth Trend Analysis By Service, 2017 to 2021

    5.5. Absolute $ Opportunity Analysis By Service, 2022 to 2032

6. Global Market Analysis 2017 to 2021 and Forecast 2022 to 2032, By End User

    6.1. Introduction / Key Findings

    6.2. Historical Market Size Value (US$ Million) Analysis By End User, 2017 to 2021

    6.3. Current and Future Market Size Value (US$ Million) Analysis and Forecast By End User, 2022 to 2032

        6.3.1. for Residential

        6.3.2. for Industrial

        6.3.3. for Commercial

        6.3.4. for Government Institutions

    6.4. Y-o-Y Growth Trend Analysis By End User, 2017 to 2021

    6.5. Absolute $ Opportunity Analysis By End User, 2022 to 2032

7. Global Market Analysis 2017 to 2021 and Forecast 2022 to 2032, By Region

    7.1. Introduction

    7.2. Historical Market Size Value (US$ Million) Analysis By Region, 2017 to 2021

    7.3. Current Market Size Value (US$ Million) Analysis and Forecast By Region, 2022 to 2032

        7.3.1. North America Market

        7.3.2. Latin America Market

        7.3.3. Europe Market

        7.3.4. South Asia Market

        7.3.5. East Asia Market

        7.3.6. Oceania Market

        7.3.7. Middle East and Africa Market

    7.4. Market Attractiveness Analysis By Region

8. North America Market Analysis 2017 to 2021 and Forecast 2022 to 2032, By Country

    8.1. Historical Market Size Value (US$ Million) Trend Analysis By Market Taxonomy, 2017 to 2021

    8.2. Market Size Value (US$ Million) Forecast By Market Taxonomy, 2022 to 2032

        8.2.1. By Country

            8.2.1.1. USA

            8.2.1.2. Canada

        8.2.2. By Service

        8.2.3. By End User

    8.3. Market Attractiveness Analysis

        8.3.1. By Country

        8.3.2. By Service

        8.3.3. By End User

    8.4. Key Takeaways

9. Latin America Market Analysis 2017 to 2021 and Forecast 2022 to 2032, By Country

    9.1. Historical Market Size Value (US$ Million) Trend Analysis By Market Taxonomy, 2017 to 2021

    9.2. Market Size Value (US$ Million) Forecast By Market Taxonomy, 2022 to 2032

        9.2.1. By Country

            9.2.1.1. Brazil

            9.2.1.2. Mexico

            9.2.1.3. Rest of Latin America

        9.2.2. By Service

        9.2.3. By End User

    9.3. Market Attractiveness Analysis

        9.3.1. By Country

        9.3.2. By Service

        9.3.3. By End User

    9.4. Key Takeaways

10. Europe Market Analysis 2017 to 2021 and Forecast 2022 to 2032, By Country

    10.1. Historical Market Size Value (US$ Million) Trend Analysis By Market Taxonomy, 2017 to 2021

    10.2. Market Size Value (US$ Million) Forecast By Market Taxonomy, 2022 to 2032

        10.2.1. By Country

            10.2.1.1. Germany

            10.2.1.2. United Kingdom

            10.2.1.3. France

            10.2.1.4. Spain

            10.2.1.5. Italy

            10.2.1.6. Rest of Europe

        10.2.2. By Service

        10.2.3. By End User

    10.3. Market Attractiveness Analysis

        10.3.1. By Country

        10.3.2. By Service

        10.3.3. By End User

    10.4. Key Takeaways

11. South Asia Market Analysis 2017 to 2021 and Forecast 2022 to 2032, By Country

    11.1. Historical Market Size Value (US$ Million) Trend Analysis By Market Taxonomy, 2017 to 2021

    11.2. Market Size Value (US$ Million) Forecast By Market Taxonomy, 2022 to 2032

        11.2.1. By Country

            11.2.1.1. India

            11.2.1.2. Malaysia

            11.2.1.3. Singapore

            11.2.1.4. Thailand

            11.2.1.5. Rest of South Asia

        11.2.2. By Service

        11.2.3. By End User

    11.3. Market Attractiveness Analysis

        11.3.1. By Country

        11.3.2. By Service

        11.3.3. By End User

    11.4. Key Takeaways

12. East Asia Market Analysis 2017 to 2021 and Forecast 2022 to 2032, By Country

    12.1. Historical Market Size Value (US$ Million) Trend Analysis By Market Taxonomy, 2017 to 2021

    12.2. Market Size Value (US$ Million) Forecast By Market Taxonomy, 2022 to 2032

        12.2.1. By Country

            12.2.1.1. China

            12.2.1.2. Japan

            12.2.1.3. South Korea

        12.2.2. By Service

        12.2.3. By End User

    12.3. Market Attractiveness Analysis

        12.3.1. By Country

        12.3.2. By Service

        12.3.3. By End User

    12.4. Key Takeaways

13. Oceania Market Analysis 2017 to 2021 and Forecast 2022 to 2032, By Country

    13.1. Historical Market Size Value (US$ Million) Trend Analysis By Market Taxonomy, 2017 to 2021

    13.2. Market Size Value (US$ Million) Forecast By Market Taxonomy, 2022 to 2032

        13.2.1. By Country

            13.2.1.1. Australia

            13.2.1.2. New Zealand

        13.2.2. By Service

        13.2.3. By End User

    13.3. Market Attractiveness Analysis

        13.3.1. By Country

        13.3.2. By Service

        13.3.3. By End User

    13.4. Key Takeaways

14. Middle East and Africa Market Analysis 2017 to 2021 and Forecast 2022 to 2032, By Country

    14.1. Historical Market Size Value (US$ Million) Trend Analysis By Market Taxonomy, 2017 to 2021

    14.2. Market Size Value (US$ Million) Forecast By Market Taxonomy, 2022 to 2032

        14.2.1. By Country

            14.2.1.1. GCC Countries

            14.2.1.2. South Africa

            14.2.1.3. Israel

            14.2.1.4. Rest of Middle East and Africa

        14.2.2. By Service

        14.2.3. By End User

    14.3. Market Attractiveness Analysis

        14.3.1. By Country

        14.3.2. By Service

        14.3.3. By End User

    14.4. Key Takeaways

15. Key Countries Market Analysis

    15.1. USA

        15.1.1. Pricing Analysis

        15.1.2. Market Share Analysis, 2021

            15.1.2.1. By Service

            15.1.2.2. By End User

    15.2. Canada

        15.2.1. Pricing Analysis

        15.2.2. Market Share Analysis, 2021

            15.2.2.1. By Service

            15.2.2.2. By End User

    15.3. Brazil

        15.3.1. Pricing Analysis

        15.3.2. Market Share Analysis, 2021

            15.3.2.1. By Service

            15.3.2.2. By End User

    15.4. Mexico

        15.4.1. Pricing Analysis

        15.4.2. Market Share Analysis, 2021

            15.4.2.1. By Service

            15.4.2.2. By End User

    15.5. Germany

        15.5.1. Pricing Analysis

        15.5.2. Market Share Analysis, 2021

            15.5.2.1. By Service

            15.5.2.2. By End User

    15.6. United Kingdom

        15.6.1. Pricing Analysis

        15.6.2. Market Share Analysis, 2021

            15.6.2.1. By Service

            15.6.2.2. By End User

    15.7. France

        15.7.1. Pricing Analysis

        15.7.2. Market Share Analysis, 2021

            15.7.2.1. By Service

            15.7.2.2. By End User

    15.8. Spain

        15.8.1. Pricing Analysis

        15.8.2. Market Share Analysis, 2021

            15.8.2.1. By Service

            15.8.2.2. By End User

    15.9. Italy

        15.9.1. Pricing Analysis

        15.9.2. Market Share Analysis, 2021

            15.9.2.1. By Service

            15.9.2.2. By End User

    15.10. India

        15.10.1. Pricing Analysis

        15.10.2. Market Share Analysis, 2021

            15.10.2.1. By Service

            15.10.2.2. By End User

    15.11. Malaysia

        15.11.1. Pricing Analysis

        15.11.2. Market Share Analysis, 2021

            15.11.2.1. By Service

            15.11.2.2. By End User

    15.12. Singapore

        15.12.1. Pricing Analysis

        15.12.2. Market Share Analysis, 2021

            15.12.2.1. By Service

            15.12.2.2. By End User

    15.13. Thailand

        15.13.1. Pricing Analysis

        15.13.2. Market Share Analysis, 2021

            15.13.2.1. By Service

            15.13.2.2. By End User

    15.14. China

        15.14.1. Pricing Analysis

        15.14.2. Market Share Analysis, 2021

            15.14.2.1. By Service

            15.14.2.2. By End User

    15.15. Japan

        15.15.1. Pricing Analysis

        15.15.2. Market Share Analysis, 2021

            15.15.2.1. By Service

            15.15.2.2. By End User

    15.16. South Korea

        15.16.1. Pricing Analysis

        15.16.2. Market Share Analysis, 2021

            15.16.2.1. By Service

            15.16.2.2. By End User

    15.17. Australia

        15.17.1. Pricing Analysis

        15.17.2. Market Share Analysis, 2021

            15.17.2.1. By Service

            15.17.2.2. By End User

    15.18. New Zealand

        15.18.1. Pricing Analysis

        15.18.2. Market Share Analysis, 2021

            15.18.2.1. By Service

            15.18.2.2. By End User

    15.19. GCC Countries

        15.19.1. Pricing Analysis

        15.19.2. Market Share Analysis, 2021

            15.19.2.1. By Service

            15.19.2.2. By End User

    15.20. South Africa

        15.20.1. Pricing Analysis

        15.20.2. Market Share Analysis, 2021

            15.20.2.1. By Service

            15.20.2.2. By End User

    15.21. Israel

        15.21.1. Pricing Analysis

        15.21.2. Market Share Analysis, 2021

            15.21.2.1. By Service

            15.21.2.2. By End User

16. Market Structure Analysis

    16.1. Competition Dashboard

    16.2. Competition Benchmarking

    16.3. Market Share Analysis of Top Players

        16.3.1. By Regional

        16.3.2. By Service

        16.3.3. By End User

17. Competition Analysis

    17.1. Competition Deep Dive

        17.1.1. Ava Security

            17.1.1.1. Overview

            17.1.1.2. Product Portfolio

            17.1.1.3. Profitability by Market Segments

            17.1.1.4. Sales Footprint

            17.1.1.5. Strategy Overview

                17.1.1.5.1. Marketing Strategy

        17.1.2. Securitas AB

            17.1.2.1. Overview

            17.1.2.2. Product Portfolio

            17.1.2.3. Profitability by Market Segments

            17.1.2.4. Sales Footprint

            17.1.2.5. Strategy Overview

                17.1.2.5.1. Marketing Strategy

        17.1.3. DynCrop

            17.1.3.1. Overview

            17.1.3.2. Product Portfolio

            17.1.3.3. Profitability by Market Segments

            17.1.3.4. Sales Footprint

            17.1.3.5. Strategy Overview

                17.1.3.5.1. Marketing Strategy

        17.1.4. GALLAGHER GROUP LIMITED

            17.1.4.1. Overview

            17.1.4.2. Product Portfolio

            17.1.4.3. Profitability by Market Segments

            17.1.4.4. Sales Footprint

            17.1.4.5. Strategy Overview

                17.1.4.5.1. Marketing Strategy

        17.1.5. G4S Plc.

            17.1.5.1. Overview

            17.1.5.2. Product Portfolio

            17.1.5.3. Profitability by Market Segments

            17.1.5.4. Sales Footprint

            17.1.5.5. Strategy Overview

                17.1.5.5.1. Marketing Strategy

        17.1.6. ADT Inc.

            17.1.6.1. Overview

            17.1.6.2. Product Portfolio

            17.1.6.3. Profitability by Market Segments

            17.1.6.4. Sales Footprint

            17.1.6.5. Strategy Overview

                17.1.6.5.1. Marketing Strategy

        17.1.7. CACI International Inc.

            17.1.7.1. Overview

            17.1.7.2. Product Portfolio

            17.1.7.3. Profitability by Market Segments

            17.1.7.4. Sales Footprint

            17.1.7.5. Strategy Overview

                17.1.7.5.1. Marketing Strategy

        17.1.8. CoEss

            17.1.8.1. Overview

            17.1.8.2. Product Portfolio

            17.1.8.3. Profitability by Market Segments

            17.1.8.4. Sales Footprint

            17.1.8.5. Strategy Overview

                17.1.8.5.1. Marketing Strategy

        17.1.9. Prosegur Compañía de Seguridad SA

            17.1.9.1. Overview

            17.1.9.2. Product Portfolio

            17.1.9.3. Profitability by Market Segments

            17.1.9.4. Sales Footprint

            17.1.9.5. Strategy Overview

                17.1.9.5.1. Marketing Strategy

        17.1.10. EXECUTIVE PROTECTION Inc.

            17.1.10.1. Overview

            17.1.10.2. Product Portfolio

            17.1.10.3. Profitability by Market Segments

            17.1.10.4. Sales Footprint

            17.1.10.5. Strategy Overview

                17.1.10.5.1. Marketing Strategy

        17.1.11. Allied Universal

            17.1.11.1. Overview

            17.1.11.2. Product Portfolio

            17.1.11.3. Profitability by Market Segments

            17.1.11.4. Sales Footprint

            17.1.11.5. Strategy Overview

                17.1.11.5.1. Marketing Strategy

        17.1.12. Hanweiss.com

            17.1.12.1. Overview

            17.1.12.2. Product Portfolio

            17.1.12.3. Profitability by Market Segments

            17.1.12.4. Sales Footprint

            17.1.12.5. Strategy Overview

                17.1.12.5.1. Marketing Strategy

        17.1.13. GardaWorld

            17.1.13.1. Overview

            17.1.13.2. Product Portfolio

            17.1.13.3. Profitability by Market Segments

            17.1.13.4. Sales Footprint

            17.1.13.5. Strategy Overview

                17.1.13.5.1. Marketing Strategy

        17.1.14. Japan Security and Intelligence Corps.

            17.1.14.1. Overview

            17.1.14.2. Product Portfolio

            17.1.14.3. Profitability by Market Segments

            17.1.14.4. Sales Footprint

            17.1.14.5. Strategy Overview

                17.1.14.5.1. Marketing Strategy

        17.1.15. Tops Security Ltd

            17.1.15.1. Overview

            17.1.15.2. Product Portfolio

            17.1.15.3. Profitability by Market Segments

            17.1.15.4. Sales Footprint

            17.1.15.5. Strategy Overview

                17.1.15.5.1. Marketing Strategy

        17.1.16. Kokusai Security Pte Ltd

            17.1.16.1. Overview

            17.1.16.2. Product Portfolio

            17.1.16.3. Profitability by Market Segments

            17.1.16.4. Sales Footprint

            17.1.16.5. Strategy Overview

                17.1.16.5.1. Marketing Strategy

        17.1.17. Control Risks

            17.1.17.1. Overview

            17.1.17.2. Product Portfolio

            17.1.17.3. Profitability by Market Segments

            17.1.17.4. Sales Footprint

            17.1.17.5. Strategy Overview

                17.1.17.5.1. Marketing Strategy

        17.1.18. Loomis AB

            17.1.18.1. Overview

            17.1.18.2. Product Portfolio

            17.1.18.3. Profitability by Market Segments

            17.1.18.4. Sales Footprint

            17.1.18.5. Strategy Overview

                17.1.18.5.1. Marketing Strategy

        17.1.19. The Brink’s Company

            17.1.19.1. Overview

            17.1.19.2. Product Portfolio

            17.1.19.3. Profitability by Market Segments

            17.1.19.4. Sales Footprint

            17.1.19.5. Strategy Overview

                17.1.19.5.1. Marketing Strategy

        17.1.20. Armour Security Pvt Ltd.

            17.1.20.1. Overview

            17.1.20.2. Product Portfolio

            17.1.20.3. Profitability by Market Segments

            17.1.20.4. Sales Footprint

            17.1.20.5. Strategy Overview

                17.1.20.5.1. Marketing Strategy

        17.1.21. Security Intelligence Services India Ltd.

            17.1.21.1. Overview

            17.1.21.2. Product Portfolio

            17.1.21.3. Profitability by Market Segments

            17.1.21.4. Sales Footprint

            17.1.21.5. Strategy Overview

                17.1.21.5.1. Marketing Strategy

        17.1.22. Ansnei

            17.1.22.1. Overview

            17.1.22.2. Product Portfolio

            17.1.22.3. Profitability by Market Segments

            17.1.22.4. Sales Footprint

            17.1.22.5. Strategy Overview

                17.1.22.5.1. Marketing Strategy

        17.1.23. ShieldUP

            17.1.23.1. Overview

            17.1.23.2. Product Portfolio

            17.1.23.3. Profitability by Market Segments

            17.1.23.4. Sales Footprint

            17.1.23.5. Strategy Overview

                17.1.23.5.1. Marketing Strategy

        17.1.24. Security Gaurd

            17.1.24.1. Overview

            17.1.24.2. Product Portfolio

            17.1.24.3. Profitability by Market Segments

            17.1.24.4. Sales Footprint

            17.1.24.5. Strategy Overview

                17.1.24.5.1. Marketing Strategy

18. Assumptions & Acronyms Used

19. Research Methodology

Don't pay for what you don't need

Customize your report by selecting specific countries or regions and save 30%!

List of Tables

Table 01: Global Market Value (US$ Million) Forecast by Region, 2017 to 2032

Table 02: Global Market Value (US$ Million) Forecast by Service, 2017 to 2032

Table 03: Global Market Value (US$ Million) Forecast by End User, 2017 to 2032

Table 04: North America Market Value (US$ Million) Forecast by Country, 2017 to 2032

Table 05: North America Market Value (US$ Million) Forecast by Service, 2017 to 2032

Table 06: North America Market Value (US$ Million) Forecast by End User, 2017 to 2032

Table 07: Latin America Market Value (US$ Million) Forecast by Country, 2017 to 2032

Table 08: Latin America Market Value (US$ Million) Forecast by Service, 2017 to 2032

Table 09: Latin America Market Value (US$ Million) Forecast by End User, 2017 to 2032

Table 10: Europe Market Value (US$ Million) Forecast by Country, 2017 to 2032

Table 11: Europe Market Value (US$ Million) Forecast by Service, 2017 to 2032

Table 12: Europe Market Value (US$ Million) Forecast by End User, 2017 to 2032

Table 13: South Asia Market Value (US$ Million) Forecast by Country, 2017 to 2032

Table 14: South Asia Market Value (US$ Million) Forecast by Service, 2017 to 2032

Table 15: South Asia Market Value (US$ Million) Forecast by End User, 2017 to 2032

Table 16: East Asia Market Value (US$ Million) Forecast by Country, 2017 to 2032

Table 17: East Asia Market Value (US$ Million) Forecast by Service, 2017 to 2032

Table 18: East Asia Market Value (US$ Million) Forecast by End User, 2017 to 2032

Table 19: Oceania Market Value (US$ Million) Forecast by Country, 2017 to 2032

Table 20: Oceania Market Value (US$ Million) Forecast by Service, 2017 to 2032

Table 21: Oceania Market Value (US$ Million) Forecast by End User, 2017 to 2032

Table 22: Middle East and Africa Market Value (US$ Million) Forecast by Country, 2017 to 2032

Table 23: Middle East and Africa Market Value (US$ Million) Forecast by Service, 2017 to 2032

Table 24: Middle East and Africa Market Value (US$ Million) Forecast by End User, 2017 to 2032
Sneha Verghese
Sneha Verghese
Principal Consultant
LinkedIn
Talk to Analyst

Find your sweet spots for generating winning opportunities in this market.

Talk to Analyst

List of Charts

Figure 01: Global Market Value (US$ Million) by Service, 2022 to 2032

Figure 02: Global Market Value (US$ Million) by End User, 2022 to 2032

Figure 03: Global Market Value (US$ Million) by Region, 2022 to 2032

Figure 04: Global Market Value (US$ Million) Analysis by Region, 2017 to 2032

Figure 05: Global Market Value Share (%) and BPS Analysis by Region, 2022 to 2032

Figure 06: Global Market Y-o-Y Growth (%) Projections by Region, 2022 to 2032

Figure 07: Global Market Value (US$ Million) Analysis by Service, 2017 to 2032

Figure 08: Global Market Value Share (%) and BPS Analysis by Service, 2022 to 2032

Figure 09: Global Market Y-o-Y Growth (%) Projections by Service, 2022 to 2032

Figure 10: Global Market Value (US$ Million) Analysis by End User, 2017 to 2032

Figure 11: Global Market Value Share (%) and BPS Analysis by End User, 2022 to 2032

Figure 12: Global Market Y-o-Y Growth (%) Projections by End User, 2022 to 2032

Figure 13: Global Market Attractiveness by Service, 2022 to 2032

Figure 14: Global Market Attractiveness by End User, 2022 to 2032

Figure 15: Global Market Attractiveness by Region, 2022 to 2032

Figure 16: North America Market Value (US$ Million) by Service, 2022 to 2032

Figure 17: North America Market Value (US$ Million) by End User, 2022 to 2032

Figure 18: North America Market Value (US$ Million) by Country, 2022 to 2032

Figure 19: North America Market Value (US$ Million) Analysis by Country, 2017 to 2032

Figure 20: North America Market Value Share (%) and BPS Analysis by Country, 2022 to 2032

Figure 21: North America Market Y-o-Y Growth (%) Projections by Country, 2022 to 2032

Figure 22: North America Market Value (US$ Million) Analysis by Service, 2017 to 2032

Figure 23: North America Market Value Share (%) and BPS Analysis by Service, 2022 to 2032

Figure 24: North America Market Y-o-Y Growth (%) Projections by Service, 2022 to 2032

Figure 25: North America Market Value (US$ Million) Analysis by End User, 2017 to 2032

Figure 26: North America Market Value Share (%) and BPS Analysis by End User, 2022 to 2032

Figure 27: North America Market Y-o-Y Growth (%) Projections by End User, 2022 to 2032

Figure 28: North America Market Attractiveness by Service, 2022 to 2032

Figure 29: North America Market Attractiveness by End User, 2022 to 2032

Figure 30: North America Market Attractiveness by Country, 2022 to 2032

Figure 31: Latin America Market Value (US$ Million) by Service, 2022 to 2032

Figure 32: Latin America Market Value (US$ Million) by End User, 2022 to 2032

Figure 33: Latin America Market Value (US$ Million) by Country, 2022 to 2032

Figure 34: Latin America Market Value (US$ Million) Analysis by Country, 2017 to 2032

Figure 35: Latin America Market Value Share (%) and BPS Analysis by Country, 2022 to 2032

Figure 36: Latin America Market Y-o-Y Growth (%) Projections by Country, 2022 to 2032

Figure 37: Latin America Market Value (US$ Million) Analysis by Service, 2017 to 2032

Figure 38: Latin America Market Value Share (%) and BPS Analysis by Service, 2022 to 2032

Figure 39: Latin America Market Y-o-Y Growth (%) Projections by Service, 2022 to 2032

Figure 40: Latin America Market Value (US$ Million) Analysis by End User, 2017 to 2032

Figure 41: Latin America Market Value Share (%) and BPS Analysis by End User, 2022 to 2032

Figure 42: Latin America Market Y-o-Y Growth (%) Projections by End User, 2022 to 2032

Figure 43: Latin America Market Attractiveness by Service, 2022 to 2032

Figure 44: Latin America Market Attractiveness by End User, 2022 to 2032

Figure 45: Latin America Market Attractiveness by Country, 2022 to 2032

Figure 46: Europe Market Value (US$ Million) by Service, 2022 to 2032

Figure 47: Europe Market Value (US$ Million) by End User, 2022 to 2032

Figure 48: Europe Market Value (US$ Million) by Country, 2022 to 2032

Figure 49: Europe Market Value (US$ Million) Analysis by Country, 2017 to 2032

Figure 50: Europe Market Value Share (%) and BPS Analysis by Country, 2022 to 2032

Figure 51: Europe Market Y-o-Y Growth (%) Projections by Country, 2022 to 2032

Figure 52: Europe Market Value (US$ Million) Analysis by Service, 2017 to 2032

Figure 53: Europe Market Value Share (%) and BPS Analysis by Service, 2022 to 2032

Figure 54: Europe Market Y-o-Y Growth (%) Projections by Service, 2022 to 2032

Figure 55: Europe Market Value (US$ Million) Analysis by End User, 2017 to 2032

Figure 56: Europe Market Value Share (%) and BPS Analysis by End User, 2022 to 2032

Figure 57: Europe Market Y-o-Y Growth (%) Projections by End User, 2022 to 2032

Figure 58: Europe Market Attractiveness by Service, 2022 to 2032

Figure 59: Europe Market Attractiveness by End User, 2022 to 2032

Figure 60: Europe Market Attractiveness by Country, 2022 to 2032

Figure 61: South Asia Market Value (US$ Million) by Service, 2022 to 2032

Figure 62: South Asia Market Value (US$ Million) by End User, 2022 to 2032

Figure 63: South Asia Market Value (US$ Million) by Country, 2022 to 2032

Figure 64: South Asia Market Value (US$ Million) Analysis by Country, 2017 to 2032

Figure 65: South Asia Market Value Share (%) and BPS Analysis by Country, 2022 to 2032

Figure 66: South Asia Market Y-o-Y Growth (%) Projections by Country, 2022 to 2032

Figure 67: South Asia Market Value (US$ Million) Analysis by Service, 2017 to 2032

Figure 68: South Asia Market Value Share (%) and BPS Analysis by Service, 2022 to 2032

Figure 69: South Asia Market Y-o-Y Growth (%) Projections by Service, 2022 to 2032

Figure 70: South Asia Market Value (US$ Million) Analysis by End User, 2017 to 2032

Figure 71: South Asia Market Value Share (%) and BPS Analysis by End User, 2022 to 2032

Figure 72: South Asia Market Y-o-Y Growth (%) Projections by End User, 2022 to 2032

Figure 73: South Asia Market Attractiveness by Service, 2022 to 2032

Figure 74: South Asia Market Attractiveness by End User, 2022 to 2032

Figure 75: South Asia Market Attractiveness by Country, 2022 to 2032

Figure 76: East Asia Market Value (US$ Million) by Service, 2022 to 2032

Figure 77: East Asia Market Value (US$ Million) by End User, 2022 to 2032

Figure 78: East Asia Market Value (US$ Million) by Country, 2022 to 2032

Figure 79: East Asia Market Value (US$ Million) Analysis by Country, 2017 to 2032

Figure 80: East Asia Market Value Share (%) and BPS Analysis by Country, 2022 to 2032

Figure 81: East Asia Market Y-o-Y Growth (%) Projections by Country, 2022 to 2032

Figure 82: East Asia Market Value (US$ Million) Analysis by Service, 2017 to 2032

Figure 83: East Asia Market Value Share (%) and BPS Analysis by Service, 2022 to 2032

Figure 84: East Asia Market Y-o-Y Growth (%) Projections by Service, 2022 to 2032

Figure 85: East Asia Market Value (US$ Million) Analysis by End User, 2017 to 2032

Figure 86: East Asia Market Value Share (%) and BPS Analysis by End User, 2022 to 2032

Figure 87: East Asia Market Y-o-Y Growth (%) Projections by End User, 2022 to 2032

Figure 88: East Asia Market Attractiveness by Service, 2022 to 2032

Figure 89: East Asia Market Attractiveness by End User, 2022 to 2032

Figure 90: East Asia Market Attractiveness by Country, 2022 to 2032

Figure 91: Oceania Market Value (US$ Million) by Service, 2022 to 2032

Figure 92: Oceania Market Value (US$ Million) by End User, 2022 to 2032

Figure 93: Oceania Market Value (US$ Million) by Country, 2022 to 2032

Figure 94: Oceania Market Value (US$ Million) Analysis by Country, 2017 to 2032

Figure 95: Oceania Market Value Share (%) and BPS Analysis by Country, 2022 to 2032

Figure 96: Oceania Market Y-o-Y Growth (%) Projections by Country, 2022 to 2032

Figure 97: Oceania Market Value (US$ Million) Analysis by Service, 2017 to 2032

Figure 98: Oceania Market Value Share (%) and BPS Analysis by Service, 2022 to 2032

Figure 99: Oceania Market Y-o-Y Growth (%) Projections by Service, 2022 to 2032

Figure 100: Oceania Market Value (US$ Million) Analysis by End User, 2017 to 2032

Figure 101: Oceania Market Value Share (%) and BPS Analysis by End User, 2022 to 2032

Figure 102: Oceania Market Y-o-Y Growth (%) Projections by End User, 2022 to 2032

Figure 103: Oceania Market Attractiveness by Service, 2022 to 2032

Figure 104: Oceania Market Attractiveness by End User, 2022 to 2032

Figure 105: Oceania Market Attractiveness by Country, 2022 to 2032

Figure 106: Middle East and Africa Market Value (US$ Million) by Service, 2022 to 2032

Figure 107: Middle East and Africa Market Value (US$ Million) by End User, 2022 to 2032

Figure 108: Middle East and Africa Market Value (US$ Million) by Country, 2022 to 2032

Figure 109: Middle East and Africa Market Value (US$ Million) Analysis by Country, 2017 to 2032

Figure 110: Middle East and Africa Market Value Share (%) and BPS Analysis by Country, 2022 to 2032

Figure 111: Middle East and Africa Market Y-o-Y Growth (%) Projections by Country, 2022 to 2032

Figure 112: Middle East and Africa Market Value (US$ Million) Analysis by Service, 2017 to 2032

Figure 113: Middle East and Africa Market Value Share (%) and BPS Analysis by Service, 2022 to 2032

Figure 114: Middle East and Africa Market Y-o-Y Growth (%) Projections by Service, 2022 to 2032

Figure 115: Middle East and Africa Market Value (US$ Million) Analysis by End User, 2017 to 2032

Figure 116: Middle East and Africa Market Value Share (%) and BPS Analysis by End User, 2022 to 2032

Figure 117: Middle East and Africa Market Y-o-Y Growth (%) Projections by End User, 2022 to 2032

Figure 118: Middle East and Africa Market Attractiveness by Service, 2022 to 2032

Figure 119: Middle East and Africa Market Attractiveness by End User, 2022 to 2032

Figure 120: Middle East and Africa Market Attractiveness by Country, 2022 to 2032

Recommendations

Technology

Private Cloud Services Market

Published : August 2022

Technology

Private LTE Market

Published : July 2022

Technology

Virtual Private Cloud Market

Published : May 2022

Healthcare

Private office-based clinics Market

Published : April 2022

Explore Consumer Product Insights

View Reports
Google translate

Private Security Market