The Private LTE Market is estimated to be valued at USD 7.4 billion in 2025 and is projected to reach USD 25.2 billion by 2035, registering a compound annual growth rate (CAGR) of 13.0% over the forecast period.
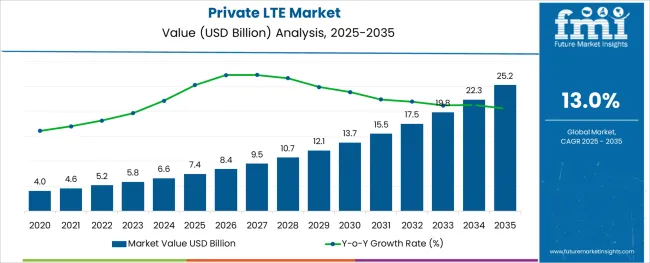
The private LTE market is witnessing accelerated growth due to rising enterprise demand for secure, dedicated, and low-latency connectivity across industrial environments. Organizations are shifting from shared public networks to private LTE networks to ensure uninterrupted data flow, enhanced coverage in remote or enclosed environments, and full control over network parameters.
This evolution is supported by spectrum liberalization policies, enterprise-friendly licensing frameworks, and increased availability of network infrastructure from telecom vendors and hyperscalers. Integration with edge computing and industrial IoT platforms has expanded the scope of deployment beyond basic communication, supporting real-time control, predictive maintenance, and autonomous operations.
Industries such as manufacturing, utilities, and transportation are leading adopters, deploying private LTE to modernize their operational frameworks. As 5G-ready architectures become more accessible, private LTE is serving as a transitional technology for enterprises aiming to future-proof their network infrastructure while optimizing cost and performance in the current deployment cycle.
The market is segmented by Type and Industry Vertical and region. By Type, the market is divided into LTE-TDD (long-term evolution time division duplex) and LTE-FDD (long-term evolution frequency division duplex). In terms of Industry Vertical, the market is classified into Transportation, Military and Defense, Manufacturing and Industrial, Oil and Gas, Energy and Mining, Healthcare, and Others. Regionally, the market is classified into North America, Latin America, Western Europe, Eastern Europe, Balkan & Baltic Countries, Russia & Belarus, Central Asia, East Asia, South Asia & Pacific, and the Middle East & Africa.
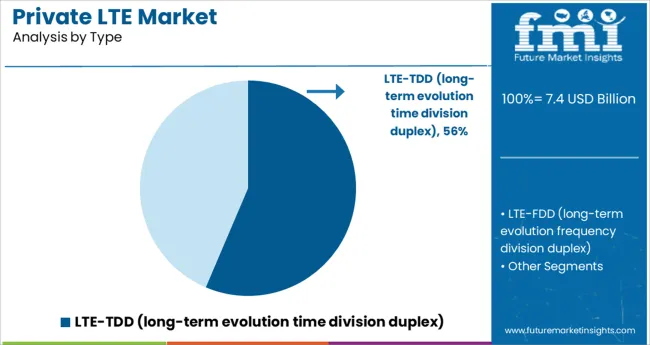
Within the type category, LTE TDD is projected to capture 56.40% of the market revenue in 2025, positioning it as the leading deployment mode. This dominance is being driven by the spectrum efficiency and cost advantages offered by LTE TDD, particularly in scenarios requiring high uplink demand and asynchronous data transmission.
LTE TDD enables better utilization of unpaired spectrum bands, making it suitable for private deployments in enterprise-controlled environments such as industrial campuses or ports. It also offers flexible bandwidth allocation and enhanced coverage in dense and remote areas, which are common in mission-critical industrial settings.
Network operators and equipment manufacturers have optimized LTE TDD configurations for private network use cases, supporting seamless integration with edge compute, remote monitoring, and industrial automation systems. These technical benefits, coupled with regulatory support in mid-band spectrum allocations, have reinforced the segment's leadership in the private LTE landscape.
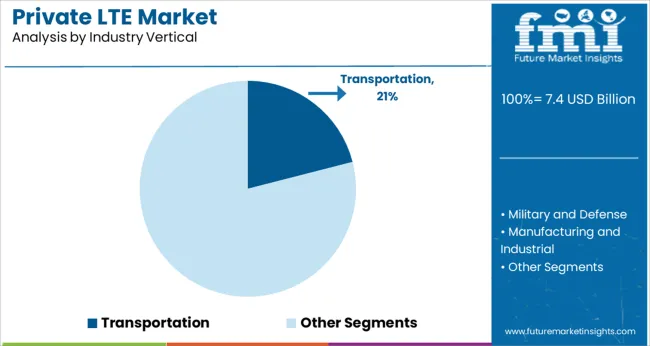
The transportation industry is anticipated to account for 21.00% of total private LTE market revenue in 2025, making it the leading vertical among industry adopters. This is primarily driven by the sector's need for uninterrupted, secure communication across mobile and fixed infrastructure such as railways, airports, and seaports.
Private LTE networks have enabled transportation authorities to achieve seamless coordination between control centers, vehicle fleets, surveillance systems, and IoT-enabled assets. The technology’s ability to offer low-latency communication, network slicing, and localized coverage has become vital for managing dynamic operations, safety systems, and passenger services in real time.
Moreover, as the transportation sector moves toward digitalization and automation, the need for resilient network performance and data security has intensified. These factors, combined with ongoing smart mobility initiatives and investments in connected infrastructure, are supporting the sector’s continued dominance in private LTE adoption.
Factors of private LTE networks like high capacity, high speed, high security, consistency performance, low latency rate, longer range, and interoperability are the prime key drivers influencing the market growth of private LTE networks. Moreover, the populace with its evolution over time is adopting isolated networks, which is expected to be a major contributing factor to the penetration of private LTE in the global market.
It is witnessed that there is an increase in the adoption of smartphones globally, which is expected to act as a major demand driver in bolstering the market growth of private LTE networks. The market expansion is in a positive direction and is likely to be booming in the upcoming years. Furthermore, government initiatives for offering enhanced public safety are also expected to propel the demand for private LTE networks globally.
Although there is a number of factors that are contributing to the market growth of private LTE networks, it is also identified that some factors are going to restrain the growth of the private LTE networks market in the coming years.
It is expected that the frequency band interference would curb the expansion of the private LTE market. The commercial spectrum allocation for the implementation of private LTE occurs through a unique three-tier sharing system. The bid-winning user would gain top-level service through the tier 2 Priority Access License (PAL). This license would be issued on a geographic basis.
Satellite operations and the USA Navy radar would use the first tier of the network with adjustable geographic limitations based on azimuth and beam. Other enterprises would deploy the third tier, open access, and non-prioritized band of the network. The lowest-tier Unlicensed General Authorized Access (GAA) users are permitted to use any portion of the 3.5 GHz band, which is not assigned to higher-tier users.
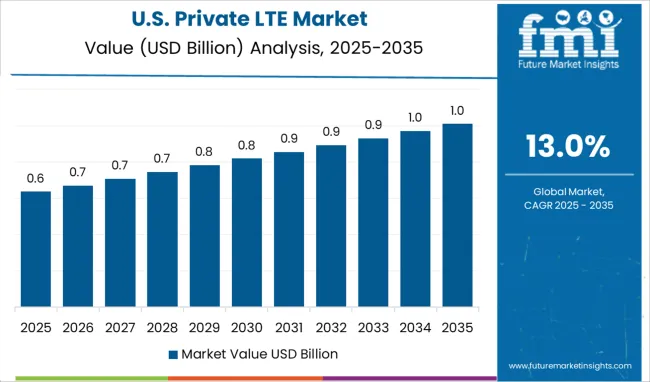
North America is expected to dominate the private LTE market during the forecast period. Currently, the North American region is accountable for 28.5% of the total market share of private LTE networks.
Due to the surge in the need for defined and unique network qualities, and the increasing need for wireless networks for business, as businesses are shifting towards digitalization in this region, the market size of private LTE networks is likely to expand. High penetration of the 5G network and growing Artificial intelligence, coupled with smart connected devices have boosted the growth of private LTE in North America.
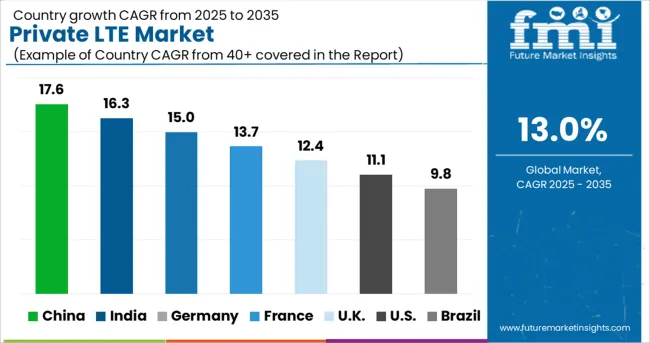
Europe is anticipated to follow the North American market and have steady growth during the forecast period. At present, Europe holds 26.5% of the total market share of private LTE networks. Strong economic growth, coupled with ongoing development in the telecom sector, is driving organizations to invest heavily in private LTE to sustain growth and improve productivity.
This, major shift toward digital transformation and a rise in cloud deployment is stimulating the demand for private LTE in Europe.
The start-up ecosystem in the private LTE market is intense with frequent innovations being made. Start-ups in the private LTE market are focusing on multiple features to further drive the adoption of this network on a large scale. Some of the private LTE start-up operators are Edzcom, FreedomFI, Athonet, ANterix, Tampnet, Vilicom, Zeetta Networks, Celona, and others.
The start-up companies are focusing on delivering private LTE solutions to the energy, transport, and logistics sectors, with the ability to proactively locate and de-energize failing powerlines will be a critical asset to the company.
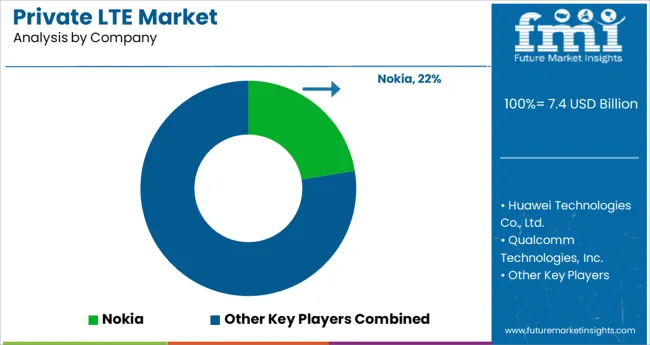
The key players are focusing on enhancing their operations and increasing their overall efficiency to stay competitive in the market, which is expected to provide lucrative opportunities for the growth of the market during the forecast period.
Some of the key players in the private LTE market are:
| Report Attribute | Details |
|---|---|
| Growth Rate | CAGR of 13.0% from 2025 to 2035 |
| Base Year for Estimation | 2024 |
| Historical Data | 2014 to 2024 |
| Forecast Period | 2025 to 2035 |
| Quantitative Units | Revenue in million and CAGR from 2025 to 2035 |
| Report Coverage | Revenue Forecast, Volume Forecast, Company Ranking, Competitive Landscape, Growth Factors, Trends, and Pricing Analysis |
| Segments Covered | Technology, Industry Vertical, Deployment, Region |
| Regions Covered | North America; Latin America; Europe; East Asia; South Asia; Oceania; Middle East and Africa |
| Key Countries Profiled | United States of America, Canada, Brazil, Argentina, Germany, United Kingdom, France, Spain, Italy, Nordics, BENELUX, Australia & New Zealand, China, India, ASIAN, GCC Countries, South Africa |
| Key Companies Profiled | Nokia; Huawei Technologies Co., Ltd.; Qualcomm Technologies, Inc.; Ruckus Networks; Future Technologies; Ambra Solutions Inc.; Comba Telecom Systems Holdings Ltd.; AIR-LYNX. |
| Customization | Available Upon Request |
The global private lte market is estimated to be valued at USD 7.4 billion in 2025.
It is projected to reach USD 25.2 billion by 2035.
The market is expected to grow at a 13.0% CAGR between 2025 and 2035.
The key product types are lte-tdd (long-term evolution time division duplex) and lte-fdd (long-term evolution frequency division duplex).
transportation segment is expected to dominate with a 21.0% industry share in 2025.


Our Research Products

The "Full Research Suite" delivers actionable market intel, deep dives on markets or technologies, so clients act faster, cut risk, and unlock growth.

The Leaderboard benchmarks and ranks top vendors, classifying them as Established Leaders, Leading Challengers, or Disruptors & Challengers.

Locates where complements amplify value and substitutes erode it, forecasting net impact by horizon

We deliver granular, decision-grade intel: market sizing, 5-year forecasts, pricing, adoption, usage, revenue, and operational KPIs—plus competitor tracking, regulation, and value chains—across 60 countries broadly.

Spot the shifts before they hit your P&L. We track inflection points, adoption curves, pricing moves, and ecosystem plays to show where demand is heading, why it is changing, and what to do next across high-growth markets and disruptive tech

Real-time reads of user behavior. We track shifting priorities, perceptions of today’s and next-gen services, and provider experience, then pace how fast tech moves from trial to adoption, blending buyer, consumer, and channel inputs with social signals (#WhySwitch, #UX).

Partner with our analyst team to build a custom report designed around your business priorities. From analysing market trends to assessing competitors or crafting bespoke datasets, we tailor insights to your needs.
Supplier Intelligence
Discovery & Profiling
Capacity & Footprint
Performance & Risk
Compliance & Governance
Commercial Readiness
Who Supplies Whom
Scorecards & Shortlists
Playbooks & Docs
Category Intelligence
Definition & Scope
Demand & Use Cases
Cost Drivers
Market Structure
Supply Chain Map
Trade & Policy
Operating Norms
Deliverables
Buyer Intelligence
Account Basics
Spend & Scope
Procurement Model
Vendor Requirements
Terms & Policies
Entry Strategy
Pain Points & Triggers
Outputs
Pricing Analysis
Benchmarks
Trends
Should-Cost
Indexation
Landed Cost
Commercial Terms
Deliverables
Brand Analysis
Positioning & Value Prop
Share & Presence
Customer Evidence
Go-to-Market
Digital & Reputation
Compliance & Trust
KPIs & Gaps
Outputs
Full Research Suite comprises of:
Market outlook & trends analysis
Interviews & case studies
Strategic recommendations
Vendor profiles & capabilities analysis
5-year forecasts
8 regions and 60+ country-level data splits
Market segment data splits
12 months of continuous data updates
DELIVERED AS:
PDF EXCEL ONLINE
Private Security Market Size and Share Forecast Outlook 2025 to 2035
Private Tutoring Market Forecast and Outlook 2025 to 2035
Private Label Pet Food Market Size and Share Forecast Outlook 2025 to 2035
Private Electric Vehicle Charging Station Market Size and Share Forecast Outlook 2025 to 2035
Private 5G Network Market Size and Share Forecast Outlook 2025 to 2035
Private office-based clinics Market Size and Share Forecast Outlook 2025 to 2035
Private Cloud Services Market by Services, Type, Industry Vertical, and Region – Growth, Trends, and Forecast through 2025 to 2035
Virtual Private Cloud Market Size and Share Forecast Outlook 2025 to 2035
Virtual Private Network VPN Market Size and Share Forecast Outlook 2025 to 2035
Virtual Private Server Market Size and Share Forecast Outlook 2025 to 2035
5G Enterprise Private Network Market Size and Share Forecast Outlook 2025 to 2035
Demand for Hybrid Protein Blends in Private Label Formulations in CIS Size and Share Forecast Outlook 2025 to 2035
LTE & 5G for Critical Communications Market Size and Share Forecast Outlook 2025 to 2035
LTE And 5G NR-Based CBRS Networks Market Size and Share Forecast Outlook 2025 to 2035
In-depth Analysis of LTE and 5G Market
LTE and 5G Broadcast Market – Future of Video Streaming
LTE & LTE Advanced Market – 5G-Ready Mobile Networks
LTE Testing Equipment Market Growth – Trends & Forecast 2019-2027
LTE Modem Market
Alternative Lending Platform Market Size and Share Forecast Outlook 2025 to 2035

Thank you!
You will receive an email from our Business Development Manager. Please be sure to check your SPAM/JUNK folder too.
Chat With
MaRIA