Produce Packaging Market
Market Insights on Produce Packaging covering sales outlook, demand forecast & up-to-date key trends
Produce Packaging Market By Application (Food Grains, Vegetables, Fruits), Packaging Type (Corrugated Boxes, Bags & Liners, Plastic Containers, Trays), & Region - Forecast 2021 - 2031
Produce Packaging Market Snapshot
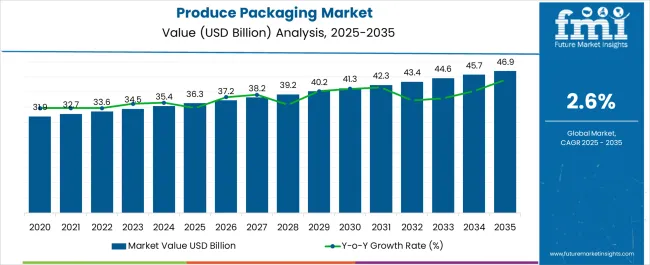
[170 Pages Report] Future Market Insights (FMI) has projected the global produce packaging market to surpass US$ 33 Bn in 2021. Increasing inclination towards consumption of fresh and organic food products has fuelled the demand for produce packaging.
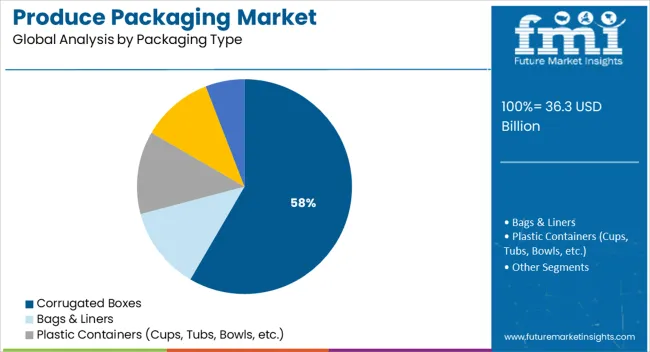
In terms of volume, the produce packaging market is poised to expand at 4.1% CAGR between 2021 and 2031. As per FMI, the global produce packaging market will register year-on-year growth of 3.7% in 2021. In terms of packaging type, corrugated boxes accounted for nearly half of the global market share.
Growing demand for meat-and gluten-free food products is driving the consumption of fresh produce. This is in turn fuelling the sales of produce packaging supplies. In 2020, the produce packaging market held nearly 9% of US$ 320 Bn worth of global food packaging market.
Attribute |
Details |
Estimated Produce Packaging Market Size in 2021 |
US$ 33 Bn |
2020-2021 (year-on-year growth) |
~3.7% |
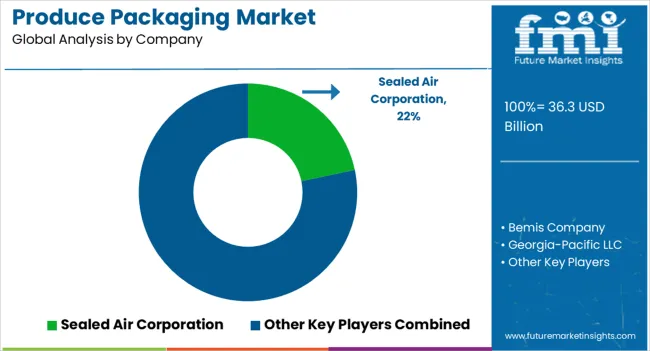
Top Players Share in 2021 |
~8%-10% |
CAGR (2021-2031) |
~4.4% |
Let us know your requirement to get
100% FREE customization
Produce Packaging Market - 2016-2020 Outlook in Comparison to 2021-2031 Growth Forecast
FMI projects the global produce packaging market to expand at 4.4% CAGR between 2021 and 2031, in comparison to the CAGR of 3.9% registered between 2016 and 2020.
Rising consumer preference for organic fresh produce such as fruits, vegetables, plant-based meat products, and grains is expected to spur the demand for produce packaging over the coming years.
Increasing awareness regarding the benefits of organic and natural food products has resulted in higher consumption of organic fresh produce. Coupled with this, shifting consumer preference towards online grocery shopping has encouraged the production of high-quality and sustainable produce packaging.
Online retail stores and local vendors are increasingly stacking up their shelf with packaged organic food products. Following the outbreak of COVID-19, awareness regarding healthy eating and lifestyle has encouraged consumers to opt for organic food products.
Growing trend of single-households, surging demand for vegan and plant-based food products, and consumption of ready-to-eat and meat-free meal options are the factors propelling use of produce packaging bags for fresh food delivery packaging.
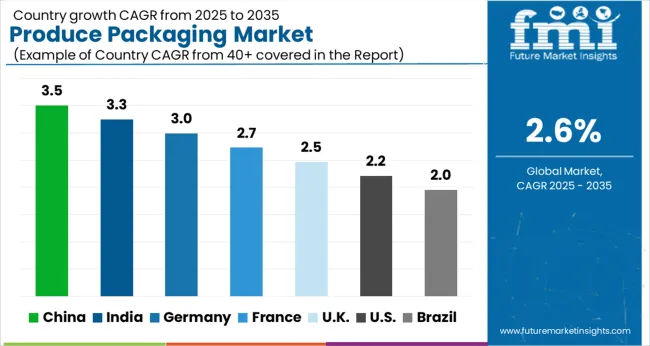
Regionally, Asia Pacific excluding Japan is expected to be the largest contributor in the global produce packaging market. However, growing demand for organic food products and fresh produce in the U.K., France, and Germany will propel the growth in the Europe produce packaging market.
Will Packaging Innovations Encourage Produce Packaging Sales
As per Our World in Data, trend of single households is increasingly becoming common across the globe. In the U.S., share of adults living alone nearly doubled over the past 5 decades by over 28% in 2018.
This trend is catching up fast in Asia and Europe. Countries such as India, the U.K., China, and Japan have substantial share of single households. In order to cut down the cost of living coupled with improving standard of living, single households are becoming increasingly common.
On the back of this trend, food service and packaging companies have increased the production of compact cardboard produce trays, fruit and vegetable packaging boxes, and various other packaging solutions as consumers are opting for smaller quantities of food to reduce the wastage.
This is increasing the production of compact produce packaging. Besides this, with growing urbanization and sustainability concerns, innovation in packaging industry will transform the\ produce packaging market.
Innovative produce packaging such as corrugated boxes, reusable mesh produce bags, plastic-free bags and liners, AR produce stickers, and others are in high demand. In order to complement the changing consumer preference, some of the leading produce packaging companies are adopting block-chain produce packaging and AR produce packaging to gain competitive edge.
For instance, in 2018, Walmart and IBM collaborated to create more transparency in the food industry and introduced block-chain powered labelling system. Using this technology, the companies were focusing on tracking the freshness of the produce which documenting its origins and distributors to reduce food borne illnesses.
Likewise, in November 2021, Graphic Packaging Holding Company, a leading vertically-integrated provider of sustainable fiber-based consumer packaging solutions, announced the acquisition of AR Packaging Group AB, Europe’s second largest producer of fiber-based consumer packaging. The acquisition will accelerate Graphic Packaging’s growing position serving consumer packaged goods companies worldwide with sustainable fiber-based packaging alternatives.
Such developments in produce packaging are expected to accelerate the growth in the Produce Packaging Market
Find your sweet spots for generating winning opportunities in this market.
Talk to AnalystHow Is Increasing Consumption of Meat-Free Food Products Driving Sales of Produce Packaging?
Demand for meat-free food products such as plant-based pork is expected to rise at an exceptional 24% CAGR through 2021, as per a Future Market Insights study. With growing consciousness regarding the health benefits of organic and plant-based fresh produce, consumption of meat-free food products has increased.
Sales of meat-free fresh produce such as quinoa, plant-based pork, apples, and other fruits & vegetables is expected to witness a huge uptake over the coming years. Hence, retail store vendors and online grocery stores are increasingly stacking such food items.
In retail stores, demand for packaging of fresh produce, which are display-ready is expected to burgeon over the forthcoming years. In response to this, demand for produce packaging in food service sector will remain higher.
Produce Packaging Market - Country-wise Analysis
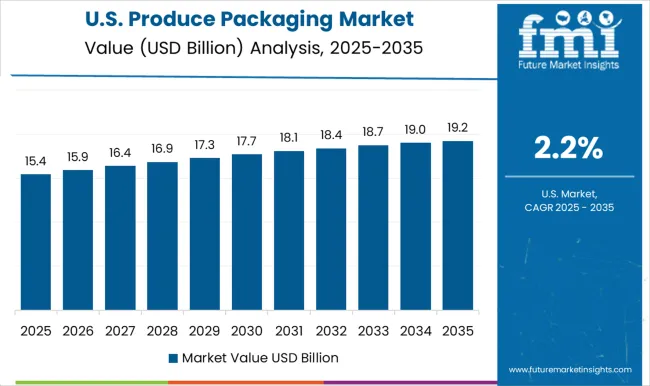
Why is Demand Rising in the U.S. Produce Packaging Market?
As per the U.S. Department of Agriculture, consumption of fresh fruits and vegetables have significantly increased in the country over the past five years. With unprecedented outbreak of COVID-19, intake of fresh fruits and vegetables increased in response to growing consciousness regarding health and wellness among consumers.
Over 60% of the U.S. population consumes fresh fruits as whole or in the form of juice, frozen, or dried, as per Dietary Guidelines for Americans. Along with the shift in consumption of fresh fruits and vegetables, the country has witnessed major shift in consumer buying behavior.
They are likelier to purchase fresh produce through e-commerce and online retail stores. With increasing demand for fresh fruits and organic vegetables, foodservice companies are exhibiting high demand for fresh produce packaging supplies such as corrugated boxes, trays, bags & liners, and wooden crates.
In response to this, some of the top produce packaging companies are introducing sustainable fresh packaging solutions to meet the requirements of end-users and gain competitive edge.
For instance, in September 2021, Graphic Packaging International, announced the launch of ProducePack, a sustainable paperboard range of packaging designed for fresh produce applications, an effective and user-friendly solution to preserving fruit for Michigan apple distributor BelleHarvest.
How is Veganism Affecting India Produce Packaging Market?
As per Future Market Insights, India is expected to dominate the South Asia produce packaging market through 2021. India is the second largest producer of grains, fruits, and vegetables across the globe, as per India Brand Equity Foundation (IBEF).
As per IBEF, sales of organic food in India are expected to reach US$ 10.73 Bn by 2025. Growing trend of veganism coupled with increasing demand for organic food products will propel the sales in produce packaging market.
Increased penetration of smart phones and rising disposable income has encouraged the consumers to opt for healthier lifestyle such as vegan and dietary foods. Awareness about nutritional benefits of vegan and organic food has pushed their consumption in India.
This trend gained momentum following the COVID-19 outbreak, creating conducive environment for sales of produce packaging supplies in India.
What is Driving the China Produce Packaging Market?
According to FMI, Asia Pacific excluding Japan (APEJ) is expected to remain the largest market for produce packaging throughout the forecast period. China is expected to lead the growth in the APEJ produce packaging market on the back of robust production of fresh produce in the country and consequent demand for effective packaging solutions.
Growth in the market is also attributable to the increasing demand for sustainable and eco-friendly packaging for organic food products. Food packaging companies are focusing on expansion of their manufacturing facilities due to the easy availability of raw materials and cheap labor costs.
Besides this, presence of numerous leading food packaging companies such as Nine Dragons Paper, Shandong Sun Paper Industry, Shanghai Zijiang Enterprise Group, and others are positively affecting the growth in the China market.

A unified Market Research Subscription Platform, built for today's disparate research needs.
Produce Packaging Market- Category-wise Insights
Why is Produce Packaging More Preferred for Packaging of Fresh and Organic Fruits?
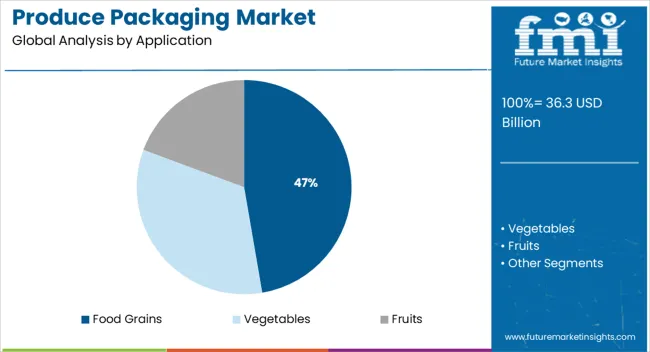
Growing trend towards healthier eating has increased the consumption of fresh fruits and vegetables. In response to this, local food vendors and retail stores are stacking up freshly-diced and cut fruits and vegetables with premium quality packaging to woo the consumers. Hence, application of produce packaging in fruits will account for the largest market revenue through 2031.
In addition to this, improving penetration of online grocery stores, especially in economies such as India, has increased the application of produce packaging in fruits and vegetables packaging.
Will Retail Stores Remain the Key End User of Produce Packaging?
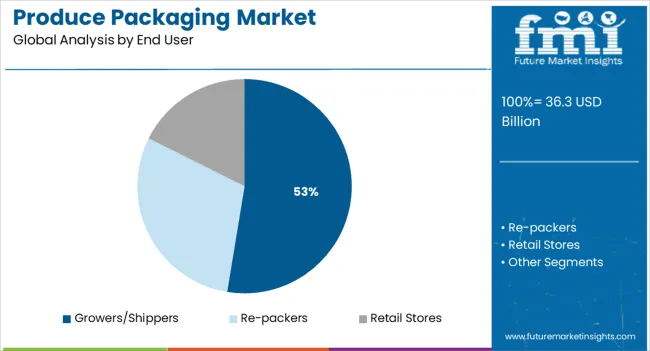
As per FMI, revenues from retail stores are projected to account for nearly 50% share of the market through 2021.
Hence, retail store vendors are increasing the adoption of superior packaging to keep the produce fresh and extend its shelf-life. This is expected to increase the sales of produce packaging through retail stores.
Expansion strategies adopted by some of the leading market players also will push sales of produce packaging. For instance, in September 2021, fresh produce packaging innovators, StePac Ltd., announced the expansion of its range of top seals with new solutions to boost the retail fresh produce packaging sector.
Its upgraded portfolio includes lean, compact, and recyclable easy peel film structures designed to seal compact trays of fresh produce such as fruits and veggies.
Why are Corrugated Boxes Most Preferred for Produce Packaging?
In terms of packaging type, corrugated boxes are expected to remain highly sought-after in the global produce packaging market. The corrugated boxes segment is expected to account for over 35% of sales through 2021.
As corrugated boxes are lightweight, have high graphics capabilities, recyclability, and are cost-effective, end-users prefer corrugated boxes for produce packaging. Corrugated boxes also are stronger than average cardboard boxes.
Produce Packaging Market - Competitive Landscape
Key players operating in produce packaging market are focusing on introducing sustainable and fiber-based produce packaging to gain competitive edge. Some of the leading players are also adopting expansion strategies such as mergers, collaborations, and acquisitions to expand their product portfolio.
- In August 2021, Printpack’s announced the launch of its preserve line of breathable laminated film for fresh produce, which is pre-qualified by the How2Recycle organization.
- In June 2021, WestRock Company, a leading provider of differentiated paper and packaging solutions, announced its expansion of its produce packaging and launch of EverGrow Collection. This new collection is made using sustainable sourced wood fiber, which is recyclable and supports company’s ambition to reduce waste and build 100% reusable, recyclable, and compostable product portfolio.
Scope of Report
Attribute |
Details |
Forecast Period |
2021-2031 |
Historical Data Available for |
2016-2020 |
Market Analysis |
US$ Mn for Value |
Key Regions Covered |
North America, Latin America, Western Europe, Eastern Europe, Asia Pacific excluding Japan, Japan, and MEA |
Key Countries Covered |
United States, Canada, Brazil, Mexico, Germany, UK, France, Italy, Spain, Nordic, Russia, Poland, China, India, Thailand, Indonesia, Australia and New Zealand, Japan, GCC countries, North Africa, South Africa, others. |
Key Market Segments Covered |
Application, End User Type, Packaging Type, and Region |
Key Companies Profiled |
|
Pricing |
Available upon Request |
Produce Packaging Market by Category
Application:
- Food Grains
- Vegetables
- Fruits
End User Type:
- Growers/Shippers
- Re-packers
- Retail Stores
Packaging Type:
- Corrugated Boxes
- Bags & Liners
- Plastic Containers (Cups, Tubs, Bowls etc.)
- Trays
- Other Packaging (Plastic Film, Molded Pulp Containers, Wooden Crates etc.)
Region:
- North America
- Latin America
- Europe
- Asia Pacific excluding Japan (APEJ)
- Middle East & Africa
- Japan
Frequently Asked Questions
The global produce packaging market is expected to reach a valuation around US$ 33 Bn in 2021.
The global produce packaging market grew at 3.9% CAGR between 2016 and 2020.
Growing demand for organic food products and increasing production of gluten- and meat-free meal food produce will spur the sales of produce packaging.
Top players in the global produce packaging market are expected to hold around 8%-10% of the total market share.
As per Future Market Insights, the U.S., China, Japan, Germany, and France are identified as key exporters in produce packaging market.
Sales of produce packaging across North America are projected to rise at 3.6%CAGR during the forecast period.
Demand for produce packaging in Europe is expected to increase at 3.2% CAGR between 2021 and 2031.
In 2021, South Korea and Japan are expected to hold around ~7% and ~12% of global market share, respectively.
Table of Content
1. Global Produce Packaging Market - Executive Summary
2. Global Produce Packaging Market Overview
2.1. Introduction
2.1.1. Global Produce Packaging Market Taxonomy
2.1.2. Global Produce Packaging Market Definition
2.2. Global Produce Packaging Market Size (US$ Mn) and Forecast, 2021-2031
2.2.1. Global Produce Packaging Market Y-o-Y Growth
2.3. Global Produce Packaging Market Dynamics
2.4. Supply Chain
2.5. Cost Structure
2.6. Pricing Analysis
2.7. Raw Material Sourcing Strategy and Analysis
2.8. List of Distributors
2.9. Key Participants Market Presence (Intensity Map) By Region
3. Global Produce Packaging Market Analysis and Forecast By Packaging Type
3.1. Global Produce Packaging Market Size and Forecast By Packaging Type, 2021-2031
3.1.1. Corrugated Boxes Market Size and Forecast, 2021-2031
3.1.1.1. Revenue (US$ Mn) Comparison, By Region
3.1.1.2. Market Share Comparison, By Region
3.1.1.3. Y-o-Y growth Comparison, By Region
3.1.2. Bags & Liners Market Size and Forecast, 2021-2031
3.1.2.1. Revenue (US$ Mn) Comparison, By Region
3.1.2.2. Market Share Comparison, By Region
3.1.2.3. Y-o-Y growth Comparison, By Region
3.1.3. Plastic Containers (Cups, Tubs, Bowls etc.) Market Size and Forecast, 2021-2031
3.1.3.1. Revenue (US$ Mn) Comparison, By Region
3.1.3.2. Market Share Comparison, By Region
3.1.3.3. Y-o-Y growth Comparison, By Region
3.1.4. Trays Market Size and Forecast, 2021-2031
3.1.4.1. Revenue (US$ Mn) Comparison, By Region
3.1.4.2. Market Share Comparison, By Region
3.1.4.3. Y-o-Y growth Comparison, By Region
3.1.5. Other Packaging (Plastic Film, Moulded Pulp Containers, Wooden Crates etc.) Market Size and Forecast, 2021-2031
3.1.5.1. Revenue (US$ Mn) Comparison, By Region
3.1.5.2. Market Share Comparison, By Region
3.1.5.3. Y-o-Y growth Comparison, By Region
4. Global Produce Packaging Market Analysis and Forecast By End User Type
4.1. Global Produce Packaging Market Size and Forecast By End User Type, 2021-2031
4.1.1. Growers/Shippers Market Size and Forecast, 2021-2031
4.1.1.1. Revenue (US$ Mn) Comparison, By Region
4.1.1.2. Market Share Comparison, By Region
4.1.1.3. Y-o-Y growth Comparison, By Region
4.1.2. Repackers Market Size and Forecast, 2021-2031
4.1.2.1. Revenue (US$ Mn) Comparison, By Region
4.1.2.2. Market Share Comparison, By Region
4.1.2.3. Y-o-Y growth Comparison, By Region
4.1.3. Retail Stores Market Size and Forecast, 2021-2031
4.1.3.1. Revenue (US$ Mn) Comparison, By Region
4.1.3.2. Market Share Comparison, By Region
4.1.3.3. Y-o-Y growth Comparison, By Region
5. Global Produce Packaging Market Analysis and Forecast By Application
5.1. Global Produce Packaging Market Size and Forecast By Application, 2021-2031
5.1.1. Food grains Market Size and Forecast, 2021-2031
5.1.1.1. Revenue (US$ Mn) Comparison, By Region
5.1.1.2. Market Share Comparison, By Region
5.1.1.3. Y-o-Y growth Comparison, By Region
5.1.2. Vegetables Market Size and Forecast, 2021-2031
5.1.2.1. Revenue (US$ Mn) Comparison, By Region
5.1.2.2. Market Share Comparison, By Region
5.1.2.3. Y-o-Y growth Comparison, By Region
5.1.3. Fruits Market Size and Forecast, 2021-2031
5.1.3.1. Revenue (US$ Mn) Comparison, By Region
5.1.3.2. Market Share Comparison, By Region
5.1.3.3. Y-o-Y growth Comparison, By Region
6. Global Produce Packaging Market Analysis and Forecast By Region
6.1. Global Produce Packaging Market Size and Forecast, 2021-2031
6.1.1. North America Produce Packaging Market Size and Forecast, 2021-2031
6.1.1.1. Revenue (US$ Mn) Comparison, By Packaging Type
6.1.1.2. Revenue (US$ Mn) Comparison, By End User Type
6.1.1.3. Revenue (US$ Mn) Comparison, By Application
6.1.2. Latin America Produce Packaging Market Size and Forecast, 2021-2031
6.1.2.1. Revenue (US$ Mn) Comparison, By Packaging Type
6.1.2.2. Revenue (US$ Mn) Comparison, By End User Type
6.1.2.3. Revenue (US$ Mn) Comparison, By Application
6.1.3. Europe Produce Packaging Market Size and Forecast, 2021-2031
6.1.3.1. Revenue (US$ Mn) Comparison, By Packaging Type
6.1.3.2. Revenue (US$ Mn) Comparison, By End User Type
6.1.3.3. Revenue (US$ Mn) Comparison, By Application
6.1.4. Japan Produce Packaging Market Size and Forecast, 2021-2031
6.1.4.1. Revenue (US$ Mn) Comparison, By Packaging Type
6.1.4.2. Revenue (US$ Mn) Comparison, By End User Type
6.1.4.3. Revenue (US$ Mn) Comparison, By Application
6.1.5. APEJ Produce Packaging Market Size and Forecast, 2021-2031
6.1.5.1. Revenue (US$ Mn) Comparison, By Packaging Type
6.1.5.2. Revenue (US$ Mn) Comparison, By End User Type
6.1.5.3. Revenue (US$ Mn) Comparison, By Application
6.1.6. MEA Produce Packaging Market Size and Forecast, 2021-2031
6.1.6.1. Revenue (US$ Mn) Comparison, By Packaging Type
6.1.6.2. Revenue (US$ Mn) Comparison, By End User Type
6.1.6.3. Revenue (US$ Mn) Comparison, By Application
7. North America Produce Packaging Market Analysis and Forecast, By Country, 2021-2031
7.1. US Produce Packaging Market Size and Forecast, 2021-2031
7.1.1. Revenue (US$ Mn) Comparison, By Packaging Type
7.1.2. Revenue (US$ Mn) Comparison, By End User Type
7.1.3. Revenue (US$ Mn) Comparison, By Application
7.2. Canada Produce Packaging Market Size and Forecast, 2021-2031
7.2.1. Revenue (US$ Mn) Comparison, By Packaging Type
7.2.2. Revenue (US$ Mn) Comparison, By End User Type
7.2.3. Revenue (US$ Mn) Comparison, By Application
8. Latin America Produce Packaging Market Analysis and Forecast, By Country, 2021-2031
8.1. Brazil Produce Packaging Market Size and Forecast, 2021-2031
8.1.1. Revenue (US$ Mn) Comparison, By Packaging Type
8.1.2. Revenue (US$ Mn) Comparison, By End User Type
8.1.3. Revenue (US$ Mn) Comparison, By Application
8.2. Mexico Produce Packaging Market Size and Forecast, 2021-2031
8.2.1. Revenue (US$ Mn) Comparison, By Packaging Type
8.2.2. Revenue (US$ Mn) Comparison, By End User Type
8.2.3. Revenue (US$ Mn) Comparison, By Application
8.3. Argentina Produce Packaging Market Size and Forecast, 2021-2031
8.3.1. Revenue (US$ Mn) Comparison, By Packaging Type
8.3.2. Revenue (US$ Mn) Comparison, By End User Type
8.3.3. Revenue (US$ Mn) Comparison, By Application
9. Europe Produce Packaging Market Analysis and Forecast, By Country, 2021-2031
9.1. Germany Produce Packaging Market Size and Forecast, 2021-2031
9.1.1. Revenue (US$ Mn) Comparison, By Packaging Type
9.1.2. Revenue (US$ Mn) Comparison, By End User Type
9.1.3. Revenue (US$ Mn) Comparison, By Application
9.2. UK Produce Packaging Market Size and Forecast, 2021-2031
9.2.1. Revenue (US$ Mn) Comparison, By Packaging Type
9.2.2. Revenue (US$ Mn) Comparison, By End User Type
9.2.3. Revenue (US$ Mn) Comparison, By Application
9.3. France Produce Packaging Market Size and Forecast, 2021-2031
9.3.1. Revenue (US$ Mn) Comparison, By Packaging Type
9.3.2. Revenue (US$ Mn) Comparison, By End User Type
9.3.3. Revenue (US$ Mn) Comparison, By Application
9.4. Spain Produce Packaging Market Size and Forecast, 2021-2031
9.4.1. Revenue (US$ Mn) Comparison, By Packaging Type
9.4.2. Revenue (US$ Mn) Comparison, By End User Type
9.4.3. Revenue (US$ Mn) Comparison, By Application
9.5. Italy Produce Packaging Market Size and Forecast, 2021-2031
9.5.1. Revenue (US$ Mn) Comparison, By Packaging Type
9.5.2. Revenue (US$ Mn) Comparison, By End User Type
9.5.3. Revenue (US$ Mn) Comparison, By Application
9.6. Nordic Produce Packaging Market Size and Forecast, 2021-2031
9.6.1. Revenue (US$ Mn) Comparison, By Packaging Type
9.6.2. Revenue (US$ Mn) Comparison, By End User Type
9.6.3. Revenue (US$ Mn) Comparison, By Application
10. Japan Produce Packaging Market Analysis and Forecast, By Country, 2021-2031
10.1. Japan Produce Packaging Market Size and Forecast, 2021-2031
10.1.1. Revenue (US$ Mn) Comparison, By Packaging Type
10.1.2. Revenue (US$ Mn) Comparison, By End User Type
10.1.3. Revenue (US$ Mn) Comparison, By Application
11. APEJ Produce Packaging Market Analysis and Forecast, By Country, 2021-2031
11.1. China Produce Packaging Market Size and Forecast, 2021-2031
11.1.1. Revenue (US$ Mn) Comparison, By Packaging Type
11.1.2. Revenue (US$ Mn) Comparison, By End User Type
11.1.3. Revenue (US$ Mn) Comparison, By Application
11.2. India Produce Packaging Market Size and Forecast, 2021-2031
11.2.1. Revenue (US$ Mn) Comparison, By Packaging Type
11.2.2. Revenue (US$ Mn) Comparison, By End User Type
11.2.3. Revenue (US$ Mn) Comparison, By Application
11.3. Malaysia Produce Packaging Market Size and Forecast, 2021-2031
11.3.1. Revenue (US$ Mn) Comparison, By Packaging Type
11.3.2. Revenue (US$ Mn) Comparison, By End User Type
11.3.3. Revenue (US$ Mn) Comparison, By Application
11.4. Thailand Produce Packaging Market Size and Forecast, 2021-2031
11.4.1. Revenue (US$ Mn) Comparison, By Packaging Type
11.4.2. Revenue (US$ Mn) Comparison, By End User Type
11.4.3. Revenue (US$ Mn) Comparison, By Application
11.5. Singapore Produce Packaging Market Size and Forecast, 2021-2031
11.5.1. Revenue (US$ Mn) Comparison, By Packaging Type
11.5.2. Revenue (US$ Mn) Comparison, By End User Type
11.5.3. Revenue (US$ Mn) Comparison, By Application
11.6. Australia Produce Packaging Market Size and Forecast, 2021-2031
11.6.1. Revenue (US$ Mn) Comparison, By Packaging Type
11.6.2. Revenue (US$ Mn) Comparison, By End User Type
11.6.3. Revenue (US$ Mn) Comparison, By Application
12. MEA Produce Packaging Market Analysis and Forecast, By Country, 2021-2031
12.1. GCC Countries Produce Packaging Market Size and Forecast, 2021-2031
12.1.1. Revenue (US$ Mn) Comparison, By Packaging Type
12.1.2. Revenue (US$ Mn) Comparison, By End User Type
12.1.3. Revenue (US$ Mn) Comparison, By Application
12.2. South Africa Produce Packaging Market Size and Forecast, 2021-2031
12.2.1. Revenue (US$ Mn) Comparison, By Packaging Type
12.2.2. Revenue (US$ Mn) Comparison, By End User Type
12.2.3. Revenue (US$ Mn) Comparison, By Application
12.3. Nigeria Produce Packaging Market Size and Forecast, 2021-2031
12.3.1. Revenue (US$ Mn) Comparison, By Packaging Type
12.3.2. Revenue (US$ Mn) Comparison, By End User Type
12.3.3. Revenue (US$ Mn) Comparison, By Application
12.4. Israel Produce Packaging Market Size and Forecast, 2021-2031
12.4.1. Revenue (US$ Mn) Comparison, By Packaging Type
12.4.2. Revenue (US$ Mn) Comparison, By End User Type
12.4.3. Revenue (US$ Mn) Comparison, By Application
13. Global Produce Packaging Market Company Share, Competition Landscape and Company Profiles
13.1. Company Share Analysis
13.2. Competition Landscape
13.3. Company Profiles
13.3.1. Sealed Air Corporation
13.3.2. Bemis Company
13.3.3. Georgia-Pacific LLC
13.3.4. Pactiv LLC
13.3.5. International Paper Inc.
13.3.6. Smurfit Kappa Group
13.3.7. Amcor Limited
13.3.8. Mondi Group Plc.
13.3.9. DS Smith Plc.
13.3.10. KapStone Paper and Packaging Corporation
14. Research Methodology
15. Secondary and Primary Sources
16. Assumptions and Acronyms
17. Disclaimer
Let us know your requirement to get
100% FREE customization
List of Tables
TABLE 1 Global Produce Packaging Market Value (US$ Mn), 2016-2020
TABLE 2 Global Produce Packaging Market Value (US$ Mn), 2021-2031
TABLE 3 Global Produce Packaging Market Value (US$ Mn) and Y-o-Y, 2021-2031
TABLE 4 Global Corrugated Boxes Segment Value (US$ Mn), By Region 2016-2020
TABLE 5 Global Corrugated Boxes Segment Value (US$ Mn), By Region 2021-2031
TABLE 6 Global Corrugated Boxes Segment Market Share, By Region 2016-2020
TABLE 7 Global Corrugated Boxes Segment Market Share, By Region 2021-2031
TABLE 8 Global Corrugated Boxes Segment Y-o-Y, By Region 2021-2031
TABLE 9 Global Bags & Liners Segment Value (US$ Mn), By Region 2016-2020
TABLE 10 Global Bags & Liners Segment Value (US$ Mn), By Region 2021-2031
TABLE 11 Global Bags & Liners Segment Market Share, By Region 2016-2020
TABLE 12 Global Bags & Liners Segment Market Share, By Region 2021-2031
TABLE 13 Global Bags & Liners Segment Y-o-Y, By Region 2021-2031
TABLE 14 Global Plastic Containers (Cups, Tubs, Bowls etc.) Segment Value (US$ Mn), By Region 2016-2020
TABLE 15 Global Plastic Containers (Cups, Tubs, Bowls etc.) Segment Value (US$ Mn), By Region 2021-2031
TABLE 16 Global Plastic Containers (Cups, Tubs, Bowls etc.) Segment Market Share, By Region 2016-2020
TABLE 17 Global Plastic Containers (Cups, Tubs, Bowls etc.) Segment Market Share, By Region 2021-2031
TABLE 18 Global Plastic Containers (Cups, Tubs, Bowls etc.) Segment Y-o-Y, By Region 2021-2031
TABLE 19 Global Trays Segment Value (US$ Mn), By Region 2016-2020
TABLE 20 Global Trays Segment Value (US$ Mn), By Region 2021-2031
TABLE 21 Global Trays Segment Market Share, By Region 2016-2020
TABLE 22 Global Trays Segment Market Share, By Region 2021-2031
TABLE 23 Global Trays Segment Y-o-Y, By Region 2021-2031
TABLE 24 Global Other Packaging (Plastic Film, Moulded Pulp Containers, Wooden Crates etc.) Segment Value (US$ Mn), By Region 2016-2020
TABLE 25 Global Other Packaging (Plastic Film, Moulded Pulp Containers, Wooden Crates etc.) Segment Value (US$ Mn), By Region 2021-2031
TABLE 26 Global Other Packaging (Plastic Film, Moulded Pulp Containers, Wooden Crates etc.) Segment Market Share, By Region 2016-2020
TABLE 27 Global Other Packaging (Plastic Film, Moulded Pulp Containers, Wooden Crates etc.) Segment Market Share, By Region 2021-2031
TABLE 28 Global Other Packaging (Plastic Film, Moulded Pulp Containers, Wooden Crates etc.) Segment Y-o-Y, By Region 2021-2031
TABLE 29 Global Growers/Shippers Segment Value (US$ Mn), By Region 2016-2020
TABLE 30 Global Growers/Shippers Segment Value (US$ Mn), By Region 2021-2031
TABLE 31 Global Growers/Shippers Segment Market Share, By Region 2016-2020
TABLE 32 Global Growers/Shippers Segment Market Share, By Region 2021-2031
TABLE 33 Global Growers/Shippers Segment Y-o-Y, By Region 2021-2031
TABLE 34 Global Repackers Segment Value (US$ Mn), By Region 2016-2020
TABLE 35 Global Repackers Segment Value (US$ Mn), By Region 2021-2031
TABLE 36 Global Repackers Segment Market Share, By Region 2016-2020
TABLE 37 Global Repackers Segment Market Share, By Region 2021-2031
TABLE 38 Global Repackers Segment Y-o-Y, By Region 2021-2031
TABLE 39 Global Retail Stores Segment Value (US$ Mn), By Region 2016-2020
TABLE 40 Global Retail Stores Segment Value (US$ Mn), By Region 2021-2031
TABLE 41 Global Retail Stores Segment Market Share, By Region 2016-2020
TABLE 42 Global Retail Stores Segment Market Share, By Region 2021-2031
TABLE 43 Global Retail Stores Segment Y-o-Y, By Region 2021-2031
TABLE 44 Global Food grains Segment Value (US$ Mn), By Region 2016-2020
TABLE 45 Global Food grains Segment Value (US$ Mn), By Region 2021-2031
TABLE 46 Global Food grains Segment Market Share, By Region 2016-2020
TABLE 47 Global Food grains Segment Market Share, By Region 2021-2031
TABLE 48 Global Food grains Segment Y-o-Y, By Region 2021-2031
TABLE 49 Global Vegetables Segment Value (US$ Mn), By Region 2016-2020
TABLE 50 Global Vegetables Segment Value (US$ Mn), By Region 2021-2031
TABLE 51 Global Vegetables Segment Market Share, By Region 2016-2020
TABLE 52 Global Vegetables Segment Market Share, By Region 2021-2031
TABLE 53 Global Vegetables Segment Y-o-Y, By Region 2021-2031
TABLE 54 Global Fruits Segment Value (US$ Mn), By Region 2016-2020
TABLE 55 Global Fruits Segment Value (US$ Mn), By Region 2021-2031
TABLE 56 Global Fruits Segment Market Share, By Region 2016-2020
TABLE 57 Global Fruits Segment Market Share, By Region 2021-2031
TABLE 58 Global Fruits Segment Y-o-Y, By Region 2021-2031
TABLE 59 North America Produce Packaging Market Value (US$ Mn), By Packaging Type 2016-2020
TABLE 60 North America Produce Packaging Market Value (US$ Mn), By Packaging Type 2021-2031
TABLE 61 North America Produce Packaging Market Value (US$ Mn), By End User Type 2016-2020
TABLE 62 North America Produce Packaging Market Value (US$ Mn), By End User Type 2021-2031
TABLE 63 North America Produce Packaging Market Value (US$ Mn), By Application 2016-2020
TABLE 64 North America Produce Packaging Market Value (US$ Mn), By Application 2021-2031
TABLE 65 Latin America Produce Packaging Market Value (US$ Mn), By Packaging Type 2016-2020
TABLE 66 Latin America Produce Packaging Market Value (US$ Mn), By Packaging Type 2021-2031
TABLE 67 Latin America Produce Packaging Market Value (US$ Mn), By End User Type 2016-2020
TABLE 68 Latin America Produce Packaging Market Value (US$ Mn), By End User Type 2021-2031
TABLE 69 Latin America Produce Packaging Market Value (US$ Mn), By Application 2016-2020
TABLE 70 Latin America Produce Packaging Market Value (US$ Mn), By Application 2021-2031
TABLE 71 Europe Produce Packaging Market Value (US$ Mn), By Packaging Type 2016-2020
TABLE 72 Europe Produce Packaging Market Value (US$ Mn), By Packaging Type 2021-2031
TABLE 73 Europe Produce Packaging Market Value (US$ Mn), By End User Type 2016-2020
TABLE 74 Europe Produce Packaging Market Value (US$ Mn), By End User Type 2021-2031
TABLE 75 Europe Produce Packaging Market Value (US$ Mn), By Application 2016-2020
TABLE 76 Europe Produce Packaging Market Value (US$ Mn), By Application 2021-2031
TABLE 77 Japan Produce Packaging Market Value (US$ Mn), By Packaging Type 2016-2020
TABLE 78 Japan Produce Packaging Market Value (US$ Mn), By Packaging Type 2021-2031
TABLE 79 Japan Produce Packaging Market Value (US$ Mn), By End User Type 2016-2020
TABLE 80 Japan Produce Packaging Market Value (US$ Mn), By End User Type 2021-2031
TABLE 81 Japan Produce Packaging Market Value (US$ Mn), By Application 2016-2020
TABLE 82 Japan Produce Packaging Market Value (US$ Mn), By Application 2021-2031
TABLE 83 APEJ Produce Packaging Market Value (US$ Mn), By Packaging Type 2016-2020
TABLE 84 APEJ Produce Packaging Market Value (US$ Mn), By Packaging Type 2021-2031
TABLE 85 APEJ Produce Packaging Market Value (US$ Mn), By End User Type 2016-2020
TABLE 86 APEJ Produce Packaging Market Value (US$ Mn), By End User Type 2021-2031
TABLE 87 APEJ Produce Packaging Market Value (US$ Mn), By Application 2016-2020
TABLE 88 APEJ Produce Packaging Market Value (US$ Mn), By Application 2021-2031
TABLE 89 MEA Produce Packaging Market Value (US$ Mn), By Packaging Type 2016-2020
TABLE 90 MEA Produce Packaging Market Value (US$ Mn), By Packaging Type 2021-2031
TABLE 91 MEA Produce Packaging Market Value (US$ Mn), By End User Type 2016-2020
TABLE 92 MEA Produce Packaging Market Value (US$ Mn), By End User Type 2021-2031
TABLE 93 MEA Produce Packaging Market Value (US$ Mn), By Application 2016-2020
TABLE 94 MEA Produce Packaging Market Value (US$ Mn), By Application 2021-2031
TABLE 95 US Produce Packaging Market Value (US$ Mn), By Packaging Type 2016-2020
TABLE 96 US Produce Packaging Market Value (US$ Mn), By Packaging Type 2021-2031
TABLE 97 US Produce Packaging Market Value (US$ Mn), By End User Type 2016-2020
TABLE 98 US Produce Packaging Market Value (US$ Mn), By End User Type 2021-2031
TABLE 99 US Produce Packaging Market Value (US$ Mn), By Application 2016-2020
TABLE 100 US Produce Packaging Market Value (US$ Mn), By Application 2021-2031
TABLE 101 Canada Produce Packaging Market Value (US$ Mn), By Packaging Type 2016-2020
TABLE 102 Canada Produce Packaging Market Value (US$ Mn), By Packaging Type 2021-2031
TABLE 103 Canada Produce Packaging Market Value (US$ Mn), By End User Type 2016-2020
TABLE 104 Canada Produce Packaging Market Value (US$ Mn), By End User Type 2021-2031
TABLE 105 Canada Produce Packaging Market Value (US$ Mn), By Application 2016-2020
TABLE 106 Canada Produce Packaging Market Value (US$ Mn), By Application 2021-2031
TABLE 107 Brazil Produce Packaging Market Value (US$ Mn), By Packaging Type 2016-2020
TABLE 108 Brazil Produce Packaging Market Value (US$ Mn), By Packaging Type 2021-2031
TABLE 109 Brazil Produce Packaging Market Value (US$ Mn), By End User Type 2016-2020
TABLE 110 Brazil Produce Packaging Market Value (US$ Mn), By End User Type 2021-2031
TABLE 111 Brazil Produce Packaging Market Value (US$ Mn), By Application 2016-2020
TABLE 112 Brazil Produce Packaging Market Value (US$ Mn), By Application 2021-2031
TABLE 113 Mexico Produce Packaging Market Value (US$ Mn), By Packaging Type 2016-2020
TABLE 114 Mexico Produce Packaging Market Value (US$ Mn), By Packaging Type 2021-2031
TABLE 115 Mexico Produce Packaging Market Value (US$ Mn), By End User Type 2016-2020
TABLE 116 Mexico Produce Packaging Market Value (US$ Mn), By End User Type 2021-2031
TABLE 117 Mexico Produce Packaging Market Value (US$ Mn), By Application 2016-2020
TABLE 118 Mexico Produce Packaging Market Value (US$ Mn), By Application 2021-2031
TABLE 119 Argentina Produce Packaging Market Value (US$ Mn), By Packaging Type 2016-2020
TABLE 120 Argentina Produce Packaging Market Value (US$ Mn), By Packaging Type 2021-2031
TABLE 121 Argentina Produce Packaging Market Value (US$ Mn), By End User Type 2016-2020
TABLE 122 Argentina Produce Packaging Market Value (US$ Mn), By End User Type 2021-2031
TABLE 123 Argentina Produce Packaging Market Value (US$ Mn), By Application 2016-2020
TABLE 124 Argentina Produce Packaging Market Value (US$ Mn), By Application 2021-2031
TABLE 125 Germany Produce Packaging Market Value (US$ Mn), By Packaging Type 2016-2020
TABLE 126 Germany Produce Packaging Market Value (US$ Mn), By Packaging Type 2021-2031
TABLE 127 Germany Produce Packaging Market Value (US$ Mn), By End User Type 2016-2020
TABLE 128 Germany Produce Packaging Market Value (US$ Mn), By End User Type 2021-2031
TABLE 129 Germany Produce Packaging Market Value (US$ Mn), By Application 2016-2020
TABLE 130 Germany Produce Packaging Market Value (US$ Mn), By Application 2021-2031
TABLE 131 UK Produce Packaging Market Value (US$ Mn), By Packaging Type 2016-2020
TABLE 132 UK Produce Packaging Market Value (US$ Mn), By Packaging Type 2021-2031
TABLE 133 UK Produce Packaging Market Value (US$ Mn), By End User Type 2016-2020
TABLE 134 UK Produce Packaging Market Value (US$ Mn), By End User Type 2021-2031
TABLE 135 UK Produce Packaging Market Value (US$ Mn), By Application 2016-2020
TABLE 136 UK Produce Packaging Market Value (US$ Mn), By Application 2021-2031
TABLE 137 France Produce Packaging Market Value (US$ Mn), By Packaging Type 2016-2020
TABLE 138 France Produce Packaging Market Value (US$ Mn), By Packaging Type 2021-2031
TABLE 139 France Produce Packaging Market Value (US$ Mn), By End User Type 2016-2020
TABLE 140 France Produce Packaging Market Value (US$ Mn), By End User Type 2021-2031
TABLE 141 France Produce Packaging Market Value (US$ Mn), By Application 2016-2020
TABLE 142 France Produce Packaging Market Value (US$ Mn), By Application 2021-2031
TABLE 143 Spain Produce Packaging Market Value (US$ Mn), By Packaging Type 2016-2020
TABLE 144 Spain Produce Packaging Market Value (US$ Mn), By Packaging Type 2021-2031
TABLE 145 Spain Produce Packaging Market Value (US$ Mn), By End User Type 2016-2020
TABLE 146 Spain Produce Packaging Market Value (US$ Mn), By End User Type 2021-2031
TABLE 147 Spain Produce Packaging Market Value (US$ Mn), By Application 2016-2020
TABLE 148 Spain Produce Packaging Market Value (US$ Mn), By Application 2021-2031
TABLE 149 Italy Produce Packaging Market Value (US$ Mn), By Packaging Type 2016-2020
TABLE 150 Italy Produce Packaging Market Value (US$ Mn), By Packaging Type 2021-2031
TABLE 151 Italy Produce Packaging Market Value (US$ Mn), By End User Type 2016-2020
TABLE 152 Italy Produce Packaging Market Value (US$ Mn), By End User Type 2021-2031
TABLE 153 Italy Produce Packaging Market Value (US$ Mn), By Application 2016-2020
TABLE 154 Italy Produce Packaging Market Value (US$ Mn), By Application 2021-2031
TABLE 155 Nordic Produce Packaging Market Value (US$ Mn), By Packaging Type 2016-2020
TABLE 156 Nordic Produce Packaging Market Value (US$ Mn), By Packaging Type 2021-2031
TABLE 157 Nordic Produce Packaging Market Value (US$ Mn), By End User Type 2016-2020
TABLE 158 Nordic Produce Packaging Market Value (US$ Mn), By End User Type 2021-2031
TABLE 159 Nordic Produce Packaging Market Value (US$ Mn), By Application 2016-2020
TABLE 160 Nordic Produce Packaging Market Value (US$ Mn), By Application 2021-2031
TABLE 161 Japan Produce Packaging Market Value (US$ Mn), By Packaging Type 2016-2020
TABLE 162 Japan Produce Packaging Market Value (US$ Mn), By Packaging Type 2021-2031
TABLE 163 Japan Produce Packaging Market Value (US$ Mn), By End User Type 2016-2020
TABLE 164 Japan Produce Packaging Market Value (US$ Mn), By End User Type 2021-2031
TABLE 165 Japan Produce Packaging Market Value (US$ Mn), By Application 2016-2020
TABLE 166 Japan Produce Packaging Market Value (US$ Mn), By Application 2021-2031
TABLE 167 China Produce Packaging Market Value (US$ Mn), By Packaging Type 2016-2020
TABLE 168 China Produce Packaging Market Value (US$ Mn), By Packaging Type 2021-2031
TABLE 169 China Produce Packaging Market Value (US$ Mn), By End User Type 2016-2020
TABLE 170 China Produce Packaging Market Value (US$ Mn), By End User Type 2021-2031
TABLE 171 China Produce Packaging Market Value (US$ Mn), By Application 2016-2020
TABLE 172 China Produce Packaging Market Value (US$ Mn), By Application 2021-2031
TABLE 173 India Produce Packaging Market Value (US$ Mn), By Packaging Type 2016-2020
TABLE 174 India Produce Packaging Market Value (US$ Mn), By Packaging Type 2021-2031
TABLE 175 India Produce Packaging Market Value (US$ Mn), By End User Type 2016-2020
TABLE 176 India Produce Packaging Market Value (US$ Mn), By End User Type 2021-2031
TABLE 177 India Produce Packaging Market Value (US$ Mn), By Application 2016-2020
TABLE 178 India Produce Packaging Market Value (US$ Mn), By Application 2021-2031
TABLE 179 Malaysia Produce Packaging Market Value (US$ Mn), By Packaging Type 2016-2020
TABLE 180 Malaysia Produce Packaging Market Value (US$ Mn), By Packaging Type 2021-2031
TABLE 181 Malaysia Produce Packaging Market Value (US$ Mn), By End User Type 2016-2020
TABLE 182 Malaysia Produce Packaging Market Value (US$ Mn), By End User Type 2021-2031
TABLE 183 Malaysia Produce Packaging Market Value (US$ Mn), By Application 2016-2020
TABLE 184 Malaysia Produce Packaging Market Value (US$ Mn), By Application 2021-2031
TABLE 185 Thailand Produce Packaging Market Value (US$ Mn), By Packaging Type 2016-2020
TABLE 186 Thailand Produce Packaging Market Value (US$ Mn), By Packaging Type 2021-2031
TABLE 187 Thailand Produce Packaging Market Value (US$ Mn), By End User Type 2016-2020
TABLE 188 Thailand Produce Packaging Market Value (US$ Mn), By End User Type 2021-2031
TABLE 189 Thailand Produce Packaging Market Value (US$ Mn), By Application 2016-2020
TABLE 190 Thailand Produce Packaging Market Value (US$ Mn), By Application 2021-2031
TABLE 191 Singapore Produce Packaging Market Value (US$ Mn), By Packaging Type 2016-2020
TABLE 192 Singapore Produce Packaging Market Value (US$ Mn), By Packaging Type 2021-2031
TABLE 193 Singapore Produce Packaging Market Value (US$ Mn), By End User Type 2016-2020
TABLE 194 Singapore Produce Packaging Market Value (US$ Mn), By End User Type 2021-2031
TABLE 195 Singapore Produce Packaging Market Value (US$ Mn), By Application 2016-2020
TABLE 196 Singapore Produce Packaging Market Value (US$ Mn), By Application 2021-2031
TABLE 197 Australia Produce Packaging Market Value (US$ Mn), By Packaging Type 2016-2020
TABLE 198 Australia Produce Packaging Market Value (US$ Mn), By Packaging Type 2021-2031
TABLE 199 Australia Produce Packaging Market Value (US$ Mn), By End User Type 2016-2020
TABLE 200 Australia Produce Packaging Market Value (US$ Mn), By End User Type 2021-2031
TABLE 201 Australia Produce Packaging Market Value (US$ Mn), By Application 2016-2020
TABLE 202 Australia Produce Packaging Market Value (US$ Mn), By Application 2021-2031
TABLE 203 GCC Countries Produce Packaging Market Value (US$ Mn), By Packaging Type 2016-2020
TABLE 204 GCC Countries Produce Packaging Market Value (US$ Mn), By Packaging Type 2021-2031
TABLE 205 GCC Countries Produce Packaging Market Value (US$ Mn), By End User Type 2016-2020
TABLE 206 GCC Countries Produce Packaging Market Value (US$ Mn), By End User Type 2021-2031
TABLE 207 GCC Countries Produce Packaging Market Value (US$ Mn), By Application 2016-2020
TABLE 208 GCC Countries Produce Packaging Market Value (US$ Mn), By Application 2021-2031
TABLE 209 South Africa Produce Packaging Market Value (US$ Mn), By Packaging Type 2016-2020
TABLE 210 South Africa Produce Packaging Market Value (US$ Mn), By Packaging Type 2021-2031
TABLE 211 South Africa Produce Packaging Market Value (US$ Mn), By End User Type 2016-2020
TABLE 212 South Africa Produce Packaging Market Value (US$ Mn), By End User Type 2021-2031
TABLE 213 South Africa Produce Packaging Market Value (US$ Mn), By Application 2016-2020
TABLE 214 South Africa Produce Packaging Market Value (US$ Mn), By Application 2021-2031
TABLE 215 Nigeria Produce Packaging Market Value (US$ Mn), By Packaging Type 2016-2020
TABLE 216 Nigeria Produce Packaging Market Value (US$ Mn), By Packaging Type 2021-2031
TABLE 217 Nigeria Produce Packaging Market Value (US$ Mn), By End User Type 2016-2020
TABLE 218 Nigeria Produce Packaging Market Value (US$ Mn), By End User Type 2021-2031
TABLE 219 Nigeria Produce Packaging Market Value (US$ Mn), By Application 2016-2020
TABLE 220 Nigeria Produce Packaging Market Value (US$ Mn), By Application 2021-2031
TABLE 221 Israel Produce Packaging Market Value (US$ Mn), By Packaging Type 2016-2020
TABLE 222 Israel Produce Packaging Market Value (US$ Mn), By Packaging Type 2021-2031
TABLE 223 Israel Produce Packaging Market Value (US$ Mn), By End User Type 2016-2020
TABLE 224 Israel Produce Packaging Market Value (US$ Mn), By End User Type 2021-2031
TABLE 225 Israel Produce Packaging Market Value (US$ Mn), By Application 2016-2020
TABLE 226 Israel Produce Packaging Market Value (US$ Mn), By Application 2021-2031
Find your sweet spots for generating winning opportunities in this market.
Talk to AnalystList of Charts
FIG. 1 Global Produce Packaging Market Value (US$ Mn), 2016-2020
FIG. 2 Global Produce Packaging Market Value (US$ Mn) Forecast, 2021-2031
FIG. 3 Global Produce Packaging Market Value (US$ Mn) and Y-o-Y, 2021-2031
FIG. 4 Global Corrugated Boxes Segment Market Value (US$ Mn) By Region, 2016-2020
FIG. 5 Global Corrugated Boxes Segment Market Value (US$ Mn) By Region, 2021-2031
FIG. 6 Global Corrugated Boxes Segment Y-o-Y Growth Rate, By Region, 2021-2031
FIG. 7 Global Bags & Liners Segment Market Value (US$ Mn) By Region, 2016-2020
FIG. 8 Global Bags & Liners Segment Market Value (US$ Mn) By Region, 2021-2031
FIG. 9 Global Bags & Liners Segment Y-o-Y Growth Rate, By Region, 2021-2031
FIG. 10 Global Plastic Containers (Cups, Tubs, Bowls etc.) Segment Market Value (US$ Mn) By Region, 2016-2020
FIG. 11 Global Plastic Containers (Cups, Tubs, Bowls etc.) Segment Market Value (US$ Mn) By Region, 2021-2031
FIG. 12 Global Plastic Containers (Cups, Tubs, Bowls etc.) Segment Y-o-Y Growth Rate, By Region, 2021-2031
FIG. 13 Global Trays Segment Market Value (US$ Mn) By Region, 2016-2020
FIG. 14 Global Trays Segment Market Value (US$ Mn) By Region, 2021-2031
FIG. 15 Global Trays Segment Y-o-Y Growth Rate, By Region, 2021-2031
FIG. 16 Global Other Packaging (Plastic Film, Moulded Pulp Containers, Wooden Crates etc.) Segment Market Value (US$ Mn) By Region, 2016-2020
FIG. 17 Global Other Packaging (Plastic Film, Moulded Pulp Containers, Wooden Crates etc.) Segment Market Value (US$ Mn) By Region, 2021-2031
FIG. 18 Global Other Packaging (Plastic Film, Moulded Pulp Containers, Wooden Crates etc.) Segment Y-o-Y Growth Rate, By Region, 2021-2031
FIG. 19 Global Growers/Shippers Segment Market Value (US$ Mn) By Region, 2016-2020
FIG. 20 Global Growers/Shippers Segment Market Value (US$ Mn) By Region, 2021-2031
FIG. 21 Global Growers/Shippers Segment Y-o-Y Growth Rate, By Region, 2021-2031
FIG. 22 Global Repackers Segment Market Value (US$ Mn) By Region, 2016-2020
FIG. 23 Global Repackers Segment Market Value (US$ Mn) By Region, 2021-2031
FIG. 24 Global Repackers Segment Y-o-Y Growth Rate, By Region, 2021-2031
FIG. 25 Global Retail Stores Segment Market Value (US$ Mn) By Region, 2016-2020
FIG. 26 Global Retail Stores Segment Market Value (US$ Mn) By Region, 2021-2031
FIG. 27 Global Retail Stores Segment Y-o-Y Growth Rate, By Region, 2021-2031
FIG. 28 Global Food grains Segment Market Value (US$ Mn) By Region, 2016-2020
FIG. 29 Global Food grains Segment Market Value (US$ Mn) By Region, 2021-2031
FIG. 30 Global Food grains Segment Y-o-Y Growth Rate, By Region, 2021-2031
FIG. 31 Global Vegetables Segment Market Value (US$ Mn) By Region, 2016-2020
FIG. 32 Global Vegetables Segment Market Value (US$ Mn) By Region, 2021-2031
FIG. 33 Global Vegetables Segment Y-o-Y Growth Rate, By Region, 2021-2031
FIG. 34 Global Fruits Segment Market Value (US$ Mn) By Region, 2016-2020
FIG. 35 Global Fruits Segment Market Value (US$ Mn) By Region, 2021-2031
FIG. 36 Global Fruits Segment Y-o-Y Growth Rate, By Region, 2021-2031
FIG. 37 North America Produce Packaging Market Value (US$ Mn), By Packaging Type 2016-2020
FIG. 38 North America Produce Packaging Market Value (US$ Mn), By Packaging Type 2021-2031
FIG. 39 North America Produce Packaging Market Value (US$ Mn), By End User Type 2016-2020
FIG. 40 North America Produce Packaging Market Value (US$ Mn), By End User Type 2021-2031
FIG. 41 North America Produce Packaging Market Value (US$ Mn), By Application 2016-2020
FIG. 42 North America Produce Packaging Market Value (US$ Mn), By Application 2021-2031
FIG. 43 Latin America Produce Packaging Market Value (US$ Mn), By Packaging Type 2016-2020
FIG. 44 Latin America Produce Packaging Market Value (US$ Mn), By Packaging Type 2021-2031
FIG. 45 Latin America Produce Packaging Market Value (US$ Mn), By End User Type 2016-2020
FIG. 46 Latin America Produce Packaging Market Value (US$ Mn), By End User Type 2021-2031
FIG. 47 Latin America Produce Packaging Market Value (US$ Mn), By Application 2016-2020
FIG. 48 Latin America Produce Packaging Market Value (US$ Mn), By Application 2021-2031
FIG. 49 Europe Produce Packaging Market Value (US$ Mn), By Packaging Type 2016-2020
FIG. 50 Europe Produce Packaging Market Value (US$ Mn), By Packaging Type 2021-2031
FIG. 51 Europe Produce Packaging Market Value (US$ Mn), By End User Type 2016-2020
FIG. 52 Europe Produce Packaging Market Value (US$ Mn), By End User Type 2021-2031
FIG. 53 Europe Produce Packaging Market Value (US$ Mn), By Application 2016-2020
FIG. 54 Europe Produce Packaging Market Value (US$ Mn), By Application 2021-2031
FIG. 55 Japan Produce Packaging Market Value (US$ Mn), By Packaging Type 2016-2020
FIG. 56 Japan Produce Packaging Market Value (US$ Mn), By Packaging Type 2021-2031
FIG. 57 Japan Produce Packaging Market Value (US$ Mn), By End User Type 2016-2020
FIG. 58 Japan Produce Packaging Market Value (US$ Mn), By End User Type 2021-2031
FIG. 59 Japan Produce Packaging Market Value (US$ Mn), By Application 2016-2020
FIG. 60 Japan Produce Packaging Market Value (US$ Mn), By Application 2021-2031
FIG. 61 APEJ Produce Packaging Market Value (US$ Mn), By Packaging Type 2016-2020
FIG. 62 APEJ Produce Packaging Market Value (US$ Mn), By Packaging Type 2021-2031
FIG. 63 APEJ Produce Packaging Market Value (US$ Mn), By End User Type 2016-2020
FIG. 64 APEJ Produce Packaging Market Value (US$ Mn), By End User Type 2021-2031
FIG. 65 APEJ Produce Packaging Market Value (US$ Mn), By Application 2016-2020
FIG. 66 APEJ Produce Packaging Market Value (US$ Mn), By Application 2021-2031
FIG. 67 MEA Produce Packaging Market Value (US$ Mn), By Packaging Type 2016-2020
FIG. 68 MEA Produce Packaging Market Value (US$ Mn), By Packaging Type 2021-2031
FIG. 69 MEA Produce Packaging Market Value (US$ Mn), By End User Type 2016-2020
FIG. 70 MEA Produce Packaging Market Value (US$ Mn), By End User Type 2021-2031
FIG. 71 MEA Produce Packaging Market Value (US$ Mn), By Application 2016-2020
FIG. 72 MEA Produce Packaging Market Value (US$ Mn), By Application 2021-2031
Need specific information?
Request CustomizationExplore Packaging Insights
View Reports