Quality Warranty Management Market: Overview 2022-2032

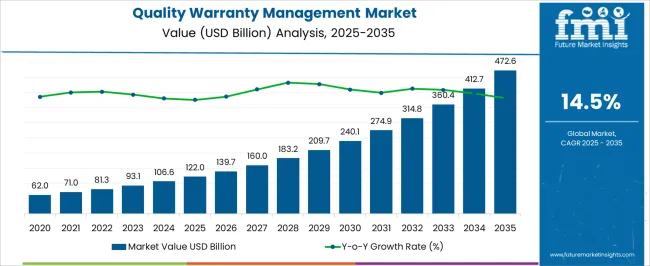
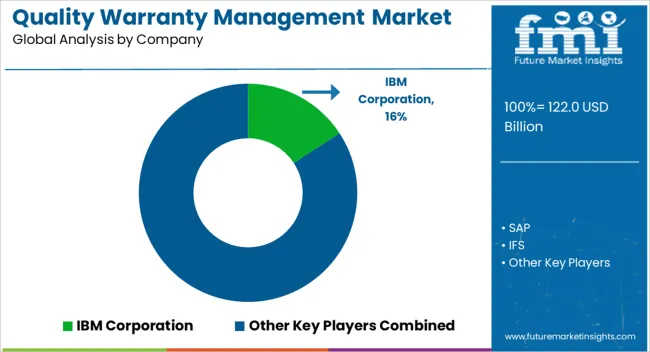
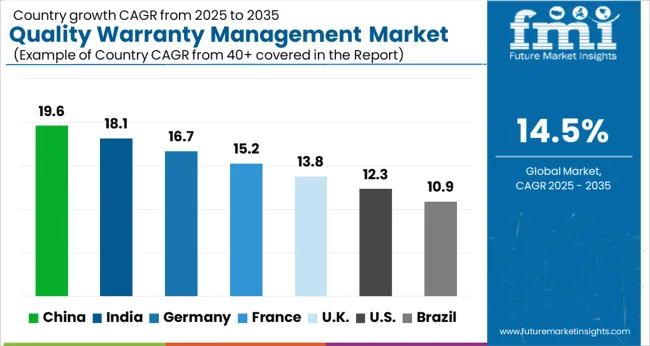
The global quality warranty management market leads to an estimated CAGR of 14.5% in the global market during the forecast period and registers a revenue valued at US$ 81.28 Bn in 2022, and is expected to cross US$ 314.81 Bn by 2032.

Attributes Details
Quality Warranty Management Market Size (2022) US$ 81.28 Billion
Quality Warranty Management Market Size (2032) US$ 314.81 Billion
Quality Warranty Management Market CAGR 14.5%

Only when business marketers generate high-quality products rather than large quantities can they achieve success. It involves managing a product or service in the most effective way possible to consistently win over consumers and increase productivity for businesses and organizations. Therefore, key players deploy their specialist engineers at the supplier end of the supply chain, execute sample dock inspection and stock verification in the event of containment activities, diagnose the problem and contribute to rooting cause analysis, documentation, and team member training.

For issues with supplier quality, they also handle the right fulfilment of 8D papers and their real execution, which contributes to the quality warranty management market share. Inspection by a third party is always recommended since it is an objective technique to find defects before they become a problem.

The management of warranties from a quality perspective causes OEMs and Tier 1 suppliers a lot of trouble. Therefore, key players do a thorough examination of the warranty, trace it back to the suppliers and supplier processes, monitor remedial efforts using the 8D technique, and ultimately assist in lowering warranty claims. With a closed-loop digital system of record, key parties strive to assist the process and discrete manufacturers in meeting demanding industry and customer compliance.

Through in-line quality, transparent reporting, and straightforward audit monitoring, they guarantee predictable, repeatable quality delivery. Additionally, they adhere to the customer and industry laws with high-quality documentation that is instantly accessible digitally throughout the whole organization. These factors support the expansion of the global quality warranty management market size. Drive new and recurring business development, in addition, by performing on-time deliveries, enhancing supplier management, and raising customer satisfaction.

By integrating quality management into workflows and procedures, one can decrease quality loss, and the chance of warranty claims or product recalls while enhancing customer relations and brand reputation. The organization may access and exchange quality requirements and documents in real-time, owing to key participants. Additionally, they aid in the creation of process control plans that include thorough inspection instructions and digital check sheets that are directly linked to product standards, which drives the demand for quality warranty management. End users may keep an up-to-date list of compliance needs by managing and tracking documents like engineering and material specifications or recipes. And throughout processes, regulatory compliance (APQP, FSA, HACCP, FSMA, SQF) is simply enabled. OEMs rely on the dealer network to implement warranty schemes and account for work carried out.

A well-functioning warranty process can turn a warranty event into a business opportunity. By investigating expenditure, overspending can be avoided, processes can be streamlined, and customers’ brand perceptions can be protected from damage. As a result, end users can improve control of dealer warranty invoicing processes through pre-payment approvals or post-payment audits or screening. Hence, global quality warranty management is likely to augment. Services offered by key players cover the entire automotive warranty control chain, such as warranty process, consulting and training, pre-authorization support, post-payment claim screening, consultative warranty reviews, and formalized warranty audits. In a similar manner, running and maintaining wind farms is expensive.

Any flaws that arise during the defined warranty term must be remedied by the manufacturer to guarantee wind turbines operate economically for as long as feasible. Key players are also implementing cutting-edge technology to simplify quality warranty administration. AI, for instance, is seen to have the greatest potential to change quality systems and move from reactive to proactive quality. Thus, by recommending categories, hazards, and reportability, as well as connecting complaints and other quality events, AI may be used to support decision-making. This is expected to skyrocket the adoption of quality warranty management. By identifying crucial component failures as soon as feasible so that warranty claims may be made, their end-of-warranty inspection services contribute to cost reduction. All these factors are anticipated to surge service demand and expand the global quality warranty management market size.

Quality Management Market: Drivers and Restraints

A happy customer to a greater extent leads more people to buy any item which has excellent quality. Increased quality concern issues, easy handling of complex processes, strict regulations of ISO, FDA, improved product quality, reduction in cost, increased customer satisfaction, defect reduction, increased market image drives the quality management market.

Initial introduction costs i.e training people with new changes in process can sometimes restraint the market for quality management market to grow.

Quality Management Market: Region Wise Outlook

The global quality management market can be divided into seven regions, namely North America, Latin America, Western Europe, Eastern Europe, Asia Pacific, Japan and Middle East and Africa.

North America, Japan and Europe stands apart in quality management market due to adoption of advanced quality tools and methodologies with high standard of living. Asia Pacific and Middle East are expected to grow eventually higher in forecast period as they emerging at a fast pace.

Key Players

  • QHSE Integrated Solutions
  • IQMS
  • Plex Systems
  • Etq Inc.
  • Integrum Management Services
  • Integrated Quality Services Co. Ltd
  • SGS Company
  • Sparta Systems

The research report presents a comprehensive assessment of the market and contains thoughtful insights, facts, historical data, and statistically supported and industry-validated market data. It also contains projections using a suitable set of assumptions and methodologies. The research report provides analysis and information according to market segments such as geography, technology and applications.

The report covers exhaustive analysis on

  • Market Segments
  • Market Dynamics
  • Market Size
  • Supply & Demand
  • Current Trends/Issues/Challenges
  • Competition & Companies involved
  • Technology
  • Value Chain

Regional analysis includes

  • North America (U.S., Canada)
  • Latin America (Mexico. Brazil)
  • Western Europe (Germany, Italy, France, U.K, Spain, Nordic countries, Belgium, Netherlands, Luxembourg)
  • Eastern Europe (Poland, Russia)
  • Asia Pacific (China, India, ASEAN, Australia & New Zealand)
  • Japan
  • Middle East and Africa (GCC, S. Africa, N. Africa)

The report is a compilation of first-hand information, qualitative and quantitative assessment by industry analysts, inputs from industry experts and industry participants across the value chain. The report provides in-depth analysis of parent market trends, macro-economic indicators and governing factors along with market attractiveness as per segments. The report also maps the qualitative impact of various market factors on market segments and geographies.
Quality Management Market: Segmentation

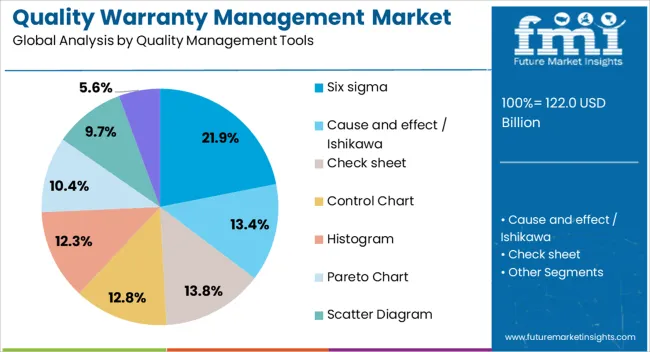
On the basis of quality management tools Quality Management market can be segmented as follows:

  • Cause and effect / Ishikawa
  • Check sheet
  • Control Chart
  • Histogram
  • Pareto Chart
  • Scatter Diagram
  • Stratification Diagram
  • Six sigma

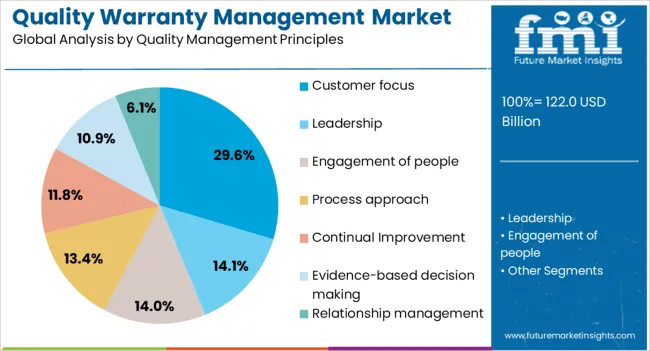
On the basis of quality management principles Quality Management market can be segmented as follows:

  • Customer focus
  • Leadership
  • Engagement of people
  • Process approach
  • Continual Improvement
  • Evidence-based decision making
  • Relationship management

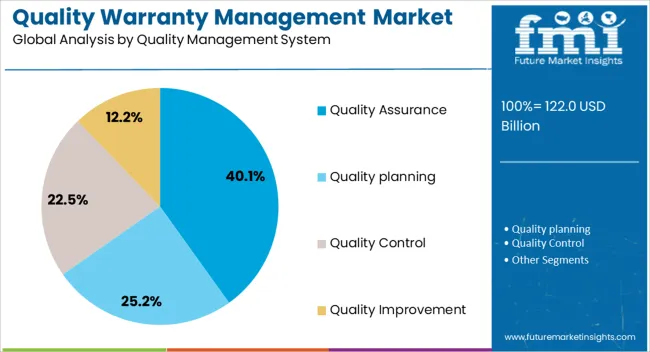
On the basis ofquality management system Quality Management market can be segmented as follows:

  • Quality planning
  • Quality Assurance
  • Quality Control
  • Quality Improvement

Table of Content

  1. Executive Summary - Quality Warranty Management Market
    • Global Market Outlook
    • Demand-side Trends
    • Supply-side Trends
    • Technology Roadmap Analysis
    • Analysis and Recommendations
  2. Market Overview
    • Market Coverage / Taxonomy
    • Market Definition / Scope / Limitations
    • Inclusion and Exclusion
  3. Value Added Insights
    • Opportunity Map Analysis
    • Product Life Cycle Analysis
    • Supply Chain Analysis
      • Supply Side Participants and their Roles
        • Producers
        • Mid-Level Participants (Traders/ Agents/ Brokers)
        • Wholesalers and Distributors
      • Value Added and Value Created at Node in the Supply Chain
      • List of Raw Material Suppliers
      • List of Existing and Potential Buyers
    • Pricing Analysis of Quality Warranty Management Market
      • Pricing Analysis By Region
      • Pricing Analysis By Country
      • Pricing Analysis By End Use
      • Pricing Analysis By Distributor
      • Pricing Analysis By Application
    • Value Chain Analysis
      • Profit Margin Analysis
      • Wholesalers and Distributors
      • Retailers
    • Product Portfolio Analysis
    • Regulatory Landscape
      • By Key Regions
      • By Key Countries
    • Regional Parent Market Outlook
    • Production and Consumption Statistics
    • Import and Export Statistics
    • Investment Feasibility Matrix
    • PESTLE Analysis
      • Political Factors
        • Government stability and change
        • Taxation policy and incentives
        • Trade tariffs and import/export regulations
        • Political risk and corruption levels
      • Economic Factors
        • GDP growth and economic cycles
        • Inflation and interest rates
        • Exchange rate fluctuations
        • Unemployment and consumer spending power
      • Social Factors
        • Demographic trends (age, population growth)
        • Cultural attitudes and lifestyle changes
        • Education levels and workforce skills
        • Health consciousness and social values
      • Technological Factors
        • Rate of technological innovation
        • R&D activity and automation trends
        • Digital infrastructure and connectivity
        • Intellectual property protection
      • Legal Factors
        • Employment and labor laws
        • Health & safety regulations
        • Consumer protection laws
        • Data privacy and antitrust legislation
      • Environmental Factors
        • Environmental regulations and compliance
        • Climate change impacts and carbon footprint
        • Resource availability and sustainability practices
        • Waste management and recycling initiatives
    • Market Background and Dynamics
      • Market Dynamics
        • Drivers
        • Restraints
        • Opportunity
        • Trends
      • SWOT Analysis of Global Quality Warranty Management Market
        • Strengths
        • Weaknesses
        • Opportunities
        • Threats
  4. Global Quality Warranty Management Market Analysis 2020-2024 and Forecast, 2025-2035
    • Historical Market Size Value (USD Mn) & Volume (Units) Analysis, 2020-2024
    • Current and Future Market Size Value (USD Mn) & Volume (Units) Projections, 2025-2035
      • Y-o-Y Growth Trend Analysis
      • Absolute $ Opportunity Analysis
    • Revenue Forecast Scenario, 2020-2035
      • Conservative Scenario
      • Likely Scenario
      • Optimistic Scenario
  5. Global Quality Warranty Management Market Analysis 2020-2024 and Forecast 2025-2035, By Application
    • Introduction / Key Findings
    • Historical Market Size Value (USD Mn) & Volume (Units) Analysis By Application, 2020-2024
    • Current and Future Market Size Value (USD Mn) & Volume (Units) Analysis and Forecast By Application, 2025-2035
    • Y-o-Y Growth Trend Analysis By Application, 2020-2024
    • Absolute $ Opportunity Analysis By Application, 2025-2035
    • Market Attractiveness Analysis By Application, 2025-2035
  6. Global Quality Warranty Management Market Analysis 2020-2024 and Forecast 2025-2035, By End Use
    • Introduction / Key Findings
    • Historical Market Size Value (USD Mn) & Volume (Units) Analysis By End Use, 2020-2024
    • Current and Future Market Size Value (USD Mn) & Volume (Units) Analysis and Forecast By End Use, 2025-2035
    • Y-o-Y Growth Trend Analysis By End Use, 2020-2024
    • Absolute $ Opportunity Analysis By End Use, 2025-2035
    • Market Attractiveness Analysis By End Use, 2025-2035
  7. Global Quality Warranty Management Market Analysis 2020-2024 and Forecast 2025-2035, By Region
    • Introduction
    • Historical Market Size Value (USD Mn) & Volume (Units) Analysis By Region, 2020-2024
    • Current Market Size Value (USD Mn) & Volume (Units) Analysis and Forecast By Region, 2025-2035
      • North America
      • Latin America
      • Western Europe
      • Eastern Europe
      • East Asia
      • South Asia and Pacific & Pacific
      • MEA
    • Market Attractiveness Analysis By Region
  8. North America Quality Warranty Management Market Analysis 2020-2024 and Forecast 2025-2035
    • Introduction
    • Historical Market Size Value (USD Mn) & Volume (Units) Trend Analysis By Market Taxonomy, 2020-2024
    • Current and Future Market Size Value (USD Mn) & Volume (Units) Analysis and Forecast By Market Taxonomy, 2025-2035
    • By Country
      • USA
      • Canada
    • By Application
    • By End Use
    • Market Attractiveness Analysis
      • By Country
      • By Application
      • By End Use
    • Market Trends
    • Key Market Participants - Intensity Mapping
    • Drivers and Restraints - Impact Analysis
    • Country Level Analysis & Forecast
      • USA Quality Warranty Management Market
        • Introduction
        • Market Analysis and Forecast by Market Taxonomy
        • By Application
        • By End Use
      • Canada Quality Warranty Management Market
        • Introduction
        • Market Analysis and Forecast by Market Taxonomy
        • By Application
        • By End Use
      • Mexico Quality Warranty Management Market
        • Introduction
        • Market Analysis and Forecast by Market Taxonomy
        • By Application
        • By End Use
  9. Latin America Quality Warranty Management Market Analysis 2020-2024 and Forecast 2025-2035, By Country
    • Historical Market Size Value (USD Mn) & Volume (Units) Trend Analysis By Market Taxonomy, 2020-2024
    • Market Size Value (USD Mn) & Volume (Units) Forecast By Market Taxonomy, 2025-2035
    • By Country
      • Brazil
      • Argentina
      • Chile
      • Rest of Latin America
    • By Application
    • By End Use
    • Market Attractiveness Analysis
      • By Country
      • By Application
      • By End Use
    • Market Trends
    • Key Market Participants - Intensity Mapping
    • Drivers and Restraints - Impact Analysis
    • Country Level Analysis & Forecast
      • Brazil Quality Warranty Management Market
        • Introduction
        • Market Analysis and Forecast by Market Taxonomy
        • By Application
        • By End Use
      • Argentina Quality Warranty Management Market
        • Introduction
        • Market Analysis and Forecast by Market Taxonomy
        • By Application
        • By End Use
      • Chile Quality Warranty Management Market
        • Introduction
        • Market Analysis and Forecast by Market Taxonomy
        • By Application
        • By End Use
      • Rest of Latin America Quality Warranty Management Market
        • Introduction
        • Market Analysis and Forecast by Market Taxonomy
        • By Application
        • By End Use
  10. Western Europe Quality Warranty Management Market Analysis 2020-2024 and Forecast 2025-2035, By Country
    • Historical Market Size Value (USD Mn) & Volume (Units) Trend Analysis By Market Taxonomy, 2020-2024
    • Market Size Value (USD Mn) & Volume (Units) Forecast By Market Taxonomy, 2025-2035
    • By Country
      • Germany
      • UK
      • Italy
      • Spain
      • France
      • Nordic
      • BENELUX
      • Rest of Western Europe
    • By Application
    • By End Use
    • Market Attractiveness Analysis
      • By Country
      • By Application
      • By End Use
    • Key Takeaways
    • Market Trends
    • Key Market Participants - Intensity Mapping
    • Drivers and Restraints - Impact Analysis
    • Country Level Analysis & Forecast
      • Germany Quality Warranty Management Market
        • Introduction
        • Market Analysis and Forecast by Market Taxonomy
        • By Application
        • By End Use
      • UK Quality Warranty Management Market
        • Introduction
        • Market Analysis and Forecast by Market Taxonomy
        • By Application
        • By End Use
      • Italy Quality Warranty Management Market
        • Introduction
        • Market Analysis and Forecast by Market Taxonomy
        • By Application
        • By End Use
      • Spain Quality Warranty Management Market
        • Introduction
        • Market Analysis and Forecast by Market Taxonomy
        • By Application
        • By End Use
      • France Quality Warranty Management Market
        • Introduction
        • Market Analysis and Forecast by Market Taxonomy
        • By Application
        • By End Use
      • Nordic Quality Warranty Management Market
        • Introduction
        • Market Analysis and Forecast by Market Taxonomy
        • By Application
        • By End Use
      • BENELUX Quality Warranty Management Market
        • Introduction
        • Market Analysis and Forecast by Market Taxonomy
        • By Application
        • By End Use
      • Rest of Western Europe Quality Warranty Management Market
        • Introduction
        • Market Analysis and Forecast by Market Taxonomy
        • By Application
        • By End Use
  11. Eastern Europe Quality Warranty Management Market Analysis 2020-2024 and Forecast 2025-2035, By Country
    • Historical Market Size Value (USD Mn) & Volume (Units) Trend Analysis By Market Taxonomy, 2020-2024
    • Market Size Value (USD Mn) & Volume (Units) Forecast By Market Taxonomy, 2025-2035
    • By Country
      • Russia
      • Poland
      • Hungary
      • Balkan & Baltic
      • Rest of Eastern Europe
    • By Application
    • By End Use
    • Market Attractiveness Analysis
      • By Country
      • By Application
      • By End Use
    • Key Takeaways
    • Market Trends
    • Key Market Participants - Intensity Mapping
    • Drivers and Restraints - Impact Analysis
    • Country Level Analysis & Forecast
      • Russia Quality Warranty Management Market
        • Introduction
        • Market Analysis and Forecast by Market Taxonomy
        • By Application
        • By End Use
      • Poland Quality Warranty Management Market
        • Introduction
        • Market Analysis and Forecast by Market Taxonomy
        • By Application
        • By End Use
      • Hungary Quality Warranty Management Market
        • Introduction
        • Market Analysis and Forecast by Market Taxonomy
        • By Application
        • By End Use
      • Balkan & Baltic Quality Warranty Management Market
        • Introduction
        • Market Analysis and Forecast by Market Taxonomy
        • By Application
        • By End Use
      • Rest of Eastern Europe Quality Warranty Management Market
        • Introduction
        • Market Analysis and Forecast by Market Taxonomy
        • By Application
        • By End Use
  12. East Asia Quality Warranty Management Market Analysis 2020-2024 and Forecast 2025-2035, By Country
    • Historical Market Size Value (USD Mn) & Volume (Units) Trend Analysis By Market Taxonomy, 2020-2024
    • Market Size Value (USD Mn) & Volume (Units) Forecast By Market Taxonomy, 2025-2035
    • By Country
      • China
      • Japan
      • South Korea
    • By Application
    • By End Use
    • Market Attractiveness Analysis
      • By Country
      • By Application
      • By End Use
    • Key Takeaways
    • Market Trends
    • Key Market Participants - Intensity Mapping
    • Drivers and Restraints - Impact Analysis
    • Country Level Analysis & Forecast
      • China Quality Warranty Management Market
        • Introduction
        • Market Analysis and Forecast by Market Taxonomy
        • By Application
        • By End Use
      • Japan Quality Warranty Management Market
        • Introduction
        • Market Analysis and Forecast by Market Taxonomy
        • By Application
        • By End Use
      • South Korea Quality Warranty Management Market
        • Introduction
        • Market Analysis and Forecast by Market Taxonomy
        • By Application
        • By End Use
  13. South Asia and Pacific Quality Warranty Management Market Analysis 2020-2024 and Forecast 2025-2035, By Country
    • Historical Market Size Value (USD Mn) & Volume (Units) Trend Analysis By Market Taxonomy, 2020-2024
    • Market Size Value (USD Mn) & Volume (Units) Forecast By Market Taxonomy, 2025-2035
    • By Country
      • India
      • ASEAN
      • Australia & New Zealand
      • Rest of South Asia and Pacific
    • By Application
    • By End Use
    • Market Attractiveness Analysis
      • By Country
      • By Application
      • By End Use
    • Key Takeaways
    • Market Trends
    • Key Market Participants - Intensity Mapping
    • Drivers and Restraints - Impact Analysis
    • Country Level Analysis & Forecast
      • India Quality Warranty Management Market
        • Introduction
        • Market Analysis and Forecast by Market Taxonomy
        • By Application
        • By End Use
      • ASEAN Quality Warranty Management Market
        • Introduction
        • Market Analysis and Forecast by Market Taxonomy
        • By Application
        • By End Use
      • Australia & New Zealand Quality Warranty Management Market
        • Introduction
        • Market Analysis and Forecast by Market Taxonomy
        • By Application
        • By End Use
      • Rest of South Asia and Pacific Quality Warranty Management Market
        • Introduction
        • Market Analysis and Forecast by Market Taxonomy
        • By Application
        • By End Use
  14. MEA Quality Warranty Management Market Analysis 2020-2024 and Forecast 2025-2035, By Country
    • Historical Market Size Value (USD Mn) & Volume (Units) Trend Analysis By Market Taxonomy, 2020-2024
    • Market Size Value (USD Mn) & Volume (Units) Forecast By Market Taxonomy, 2025-2035
    • By Country
      • Kingdom of Saudi Arabia
      • Other GCC Countries
      • Turkiye
      • South Africa
      • Other African Union
      • Rest of Middle East & Africa
    • By Application
    • By End Use
    • Market Attractiveness Analysis
      • By Country
      • By Application
      • By End Use
    • Key Takeaways
    • Market Trends
    • Key Market Participants - Intensity Mapping
    • Drivers and Restraints - Impact Analysis
    • Country Level Analysis & Forecast
      • Kingdom of Saudi Arabia Quality Warranty Management Market
        • Introduction
        • Market Analysis and Forecast by Market Taxonomy
        • By Application
        • By End Use
      • Other GCC Countries Quality Warranty Management Market
        • Introduction
        • Market Analysis and Forecast by Market Taxonomy
        • By Application
        • By End Use
      • Turkiye Quality Warranty Management Market
        • Introduction
        • Market Analysis and Forecast by Market Taxonomy
        • By Application
        • By End Use
      • South Africa Quality Warranty Management Market
        • Introduction
        • Market Analysis and Forecast by Market Taxonomy
        • By Application
        • By End Use
      • South Africa Quality Warranty Management Market
        • Introduction
        • Market Analysis and Forecast by Market Taxonomy
        • By Application
        • By End Use
      • Rest of MEA Quality Warranty Management Market
        • Introduction
        • Market Analysis and Forecast by Market Taxonomy
        • By Application
        • By End Use
      • Rest of MEA Quality Warranty Management Market
        • Introduction
        • Market Analysis and Forecast by Market Taxonomy
        • By Application
        • By End Use
  15. Market Structure Analysis
    • Competition Dashboard
    • Competition Benchmarking
    • Market Share Analysis of Top Players
      • By Region
      • By Application
      • By End Use
    • Competition Analysis
    • Competition Deep Dive
      • Global Key Players
      • Key Players by Region
      • Key Players by Country
  16. Assumptions & Acronyms Used
  17. Research Methodology

List of Tables

  • Table 1: Global Quality Warranty Management Market Value (US$ Mn) Forecast by Region, 2020-2035
  • Table 2: Global Quality Warranty Management Market Volume (Units) Forecast by Region, 2020-2035
  • Table 3: Global Quality Warranty Management Market Value (US$ Mn) Forecast by Application, 2020-2035
  • Table 4: Global Quality Warranty Management Market Volume (Units) Forecast by Application, 2020-2035
  • Table 5: Global Quality Warranty Management Market Value (US$ Mn) Forecast by End Use, 2020-2035
  • Table 6: Global Quality Warranty Management Market Volume (Units) Forecast by End Use, 2020-2035
  • Table 7: North America Quality Warranty Management Market Value (US$ Mn) Forecast by Country, 2020-2035
  • Table 8: North America Quality Warranty Management Market Volume (Units) Forecast by Country, 2020-2035
  • Table 9: North America Quality Warranty Management Market Value (US$ Mn) Forecast by Application, 2020-2035
  • Table 10: North America Quality Warranty Management Market Volume (Units) Forecast by Application, 2020-2035
  • Table 11: North America Quality Warranty Management Market Value (US$ Mn) Forecast by End Use, 2020-2035
  • Table 12: North America Quality Warranty Management Market Volume (Units) Forecast by End Use, 2020-2035
  • Table 13: Latin America Quality Warranty Management Market Value (US$ Mn) Forecast by Country, 2020-2035
  • Table 14: Latin America Quality Warranty Management Market Volume (Units) Forecast by Country, 2020-2035
  • Table 15: Latin America Quality Warranty Management Market Value (US$ Mn) Forecast by Application, 2020-2035
  • Table 16: Latin America Quality Warranty Management Market Volume (Units) Forecast by Application, 2020-2035
  • Table 17: Latin America Quality Warranty Management Market Value (US$ Mn) Forecast by End Use, 2020-2035
  • Table 18: Latin America Quality Warranty Management Market Volume (Units) Forecast by End Use, 2020-2035
  • Table 19: Europe Quality Warranty Management Market Value (US$ Mn) Forecast by Country, 2020-2035
  • Table 20: Europe Quality Warranty Management Market Volume (Units) Forecast by Country, 2020-2035
  • Table 21: Europe Quality Warranty Management Market Value (US$ Mn) Forecast by Application, 2020-2035
  • Table 22: Europe Quality Warranty Management Market Volume (Units) Forecast by Application, 2020-2035
  • Table 23: Europe Quality Warranty Management Market Value (US$ Mn) Forecast by End Use, 2020-2035
  • Table 24: Europe Quality Warranty Management Market Volume (Units) Forecast by End Use, 2020-2035
  • Table 25: East Asia Quality Warranty Management Market Value (US$ Mn) Forecast by Country, 2020-2035
  • Table 26: East Asia Quality Warranty Management Market Volume (Units) Forecast by Country, 2020-2035
  • Table 27: East Asia Quality Warranty Management Market Value (US$ Mn) Forecast by Application, 2020-2035
  • Table 28: East Asia Quality Warranty Management Market Volume (Units) Forecast by Application, 2020-2035
  • Table 29: East Asia Quality Warranty Management Market Value (US$ Mn) Forecast by End Use, 2020-2035
  • Table 30: East Asia Quality Warranty Management Market Volume (Units) Forecast by End Use, 2020-2035
  • Table 31: South Asia Quality Warranty Management Market Value (US$ Mn) Forecast by Country, 2020-2035
  • Table 32: South Asia Quality Warranty Management Market Volume (Units) Forecast by Country, 2020-2035
  • Table 33: South Asia Quality Warranty Management Market Value (US$ Mn) Forecast by Application, 2020-2035
  • Table 34: South Asia Quality Warranty Management Market Volume (Units) Forecast by Application, 2020-2035
  • Table 35: South Asia Quality Warranty Management Market Value (US$ Mn) Forecast by End Use, 2020-2035
  • Table 36: South Asia Quality Warranty Management Market Volume (Units) Forecast by End Use, 2020-2035
  • Table 37: Oceania Quality Warranty Management Market Value (US$ Mn) Forecast by Country, 2020-2035
  • Table 38: Oceania Quality Warranty Management Market Volume (Units) Forecast by Country, 2020-2035
  • Table 39: Oceania Quality Warranty Management Market Value (US$ Mn) Forecast by Application, 2020-2035
  • Table 40: Oceania Quality Warranty Management Market Volume (Units) Forecast by Application, 2020-2035
  • Table 41: Oceania Quality Warranty Management Market Value (US$ Mn) Forecast by End Use, 2020-2035
  • Table 42: Oceania Quality Warranty Management Market Volume (Units) Forecast by End Use, 2020-2035
  • Table 43: MEA Quality Warranty Management Market Value (US$ Mn) Forecast by Country, 2020-2035
  • Table 44: MEA Quality Warranty Management Market Volume (Units) Forecast by Country, 2020-2035
  • Table 45: MEA Quality Warranty Management Market Value (US$ Mn) Forecast by Application, 2020-2035
  • Table 46: MEA Quality Warranty Management Market Volume (Units) Forecast by Application, 2020-2035
  • Table 47: MEA Quality Warranty Management Market Value (US$ Mn) Forecast by End Use, 2020-2035
  • Table 48: MEA Quality Warranty Management Market Volume (Units) Forecast by End Use, 2020-2035

List of Figures

  • Figure 1: Global Quality Warranty Management Market Value (US$ Mn) by Application, 2020-2035
  • Figure 2: Global Quality Warranty Management Market Value (US$ Mn) by End Use, 2020-2035
  • Figure 3: Global Quality Warranty Management Market Value (US$ Mn) by Region, 2020-2035
  • Figure 4: Global Quality Warranty Management Market Value (US$ Mn) Analysis by Region, 2020-2035
  • Figure 5: Global Quality Warranty Management Market Volume (Units) Analysis by Region, 2020-2035
  • Figure 6: Global Quality Warranty Management Market Value Share (%) and BPS Analysis by Region, 2020-2035
  • Figure 7: Global Quality Warranty Management Market Y-o-Y Growth (%) Projections by Region, 2020-2035
  • Figure 8: Global Quality Warranty Management Market Value (US$ Mn) Analysis by Application, 2020-2035
  • Figure 9: Global Quality Warranty Management Market Volume (Units) Analysis by Application, 2020-2035
  • Figure 10: Global Quality Warranty Management Market Value Share (%) and BPS Analysis by Application, 2020-2035
  • Figure 11: Global Quality Warranty Management Market Y-o-Y Growth (%) Projections by Application, 2020-2035
  • Figure 12: Global Quality Warranty Management Market Value (US$ Mn) Analysis by End Use, 2020-2035
  • Figure 13: Global Quality Warranty Management Market Volume (Units) Analysis by End Use, 2020-2035
  • Figure 14: Global Quality Warranty Management Market Value Share (%) and BPS Analysis by End Use, 2020-2035
  • Figure 15: Global Quality Warranty Management Market Y-o-Y Growth (%) Projections by End Use, 2020-2035
  • Figure 16: Global Quality Warranty Management Market Attractiveness by Application, 2020-2035
  • Figure 17: Global Quality Warranty Management Market Attractiveness by End Use, 2020-2035
  • Figure 18: Global Quality Warranty Management Market Attractiveness by Region, 2020-2035
  • Figure 19: North America Quality Warranty Management Market Value (US$ Mn) by Application, 2020-2035
  • Figure 20: North America Quality Warranty Management Market Value (US$ Mn) by End Use, 2020-2035
  • Figure 21: North America Quality Warranty Management Market Value (US$ Mn) by Country, 2020-2035
  • Figure 22: North America Quality Warranty Management Market Value (US$ Mn) Analysis by Country, 2020-2035
  • Figure 23: North America Quality Warranty Management Market Volume (Units) Analysis by Country, 2020-2035
  • Figure 24: North America Quality Warranty Management Market Value Share (%) and BPS Analysis by Country, 2020-2035
  • Figure 25: North America Quality Warranty Management Market Y-o-Y Growth (%) Projections by Country, 2020-2035
  • Figure 26: North America Quality Warranty Management Market Value (US$ Mn) Analysis by Application, 2020-2035
  • Figure 27: North America Quality Warranty Management Market Volume (Units) Analysis by Application, 2020-2035
  • Figure 28: North America Quality Warranty Management Market Value Share (%) and BPS Analysis by Application, 2020-2035
  • Figure 29: North America Quality Warranty Management Market Y-o-Y Growth (%) Projections by Application, 2020-2035
  • Figure 30: North America Quality Warranty Management Market Value (US$ Mn) Analysis by End Use, 2020-2035
  • Figure 31: North America Quality Warranty Management Market Volume (Units) Analysis by End Use, 2020-2035
  • Figure 32: North America Quality Warranty Management Market Value Share (%) and BPS Analysis by End Use, 2020-2035
  • Figure 33: North America Quality Warranty Management Market Y-o-Y Growth (%) Projections by End Use, 2020-2035
  • Figure 34: North America Quality Warranty Management Market Attractiveness by Application, 2020-2035
  • Figure 35: North America Quality Warranty Management Market Attractiveness by End Use, 2020-2035
  • Figure 36: North America Quality Warranty Management Market Attractiveness by Country, 2020-2035
  • Figure 37: Latin America Quality Warranty Management Market Value (US$ Mn) by Application, 2020-2035
  • Figure 38: Latin America Quality Warranty Management Market Value (US$ Mn) by End Use, 2020-2035
  • Figure 39: Latin America Quality Warranty Management Market Value (US$ Mn) by Country, 2020-2035
  • Figure 40: Latin America Quality Warranty Management Market Value (US$ Mn) Analysis by Country, 2020-2035
  • Figure 41: Latin America Quality Warranty Management Market Volume (Units) Analysis by Country, 2020-2035
  • Figure 42: Latin America Quality Warranty Management Market Value Share (%) and BPS Analysis by Country, 2020-2035
  • Figure 43: Latin America Quality Warranty Management Market Y-o-Y Growth (%) Projections by Country, 2020-2035
  • Figure 44: Latin America Quality Warranty Management Market Value (US$ Mn) Analysis by Application, 2020-2035
  • Figure 45: Latin America Quality Warranty Management Market Volume (Units) Analysis by Application, 2020-2035
  • Figure 46: Latin America Quality Warranty Management Market Value Share (%) and BPS Analysis by Application, 2020-2035
  • Figure 47: Latin America Quality Warranty Management Market Y-o-Y Growth (%) Projections by Application, 2020-2035
  • Figure 48: Latin America Quality Warranty Management Market Value (US$ Mn) Analysis by End Use, 2020-2035
  • Figure 49: Latin America Quality Warranty Management Market Volume (Units) Analysis by End Use, 2020-2035
  • Figure 50: Latin America Quality Warranty Management Market Value Share (%) and BPS Analysis by End Use, 2020-2035
  • Figure 51: Latin America Quality Warranty Management Market Y-o-Y Growth (%) Projections by End Use, 2020-2035
  • Figure 52: Latin America Quality Warranty Management Market Attractiveness by Application, 2020-2035
  • Figure 53: Latin America Quality Warranty Management Market Attractiveness by End Use, 2020-2035
  • Figure 54: Latin America Quality Warranty Management Market Attractiveness by Country, 2020-2035
  • Figure 55: Europe Quality Warranty Management Market Value (US$ Mn) by Application, 2020-2035
  • Figure 56: Europe Quality Warranty Management Market Value (US$ Mn) by End Use, 2020-2035
  • Figure 57: Europe Quality Warranty Management Market Value (US$ Mn) by Country, 2020-2035
  • Figure 58: Europe Quality Warranty Management Market Value (US$ Mn) Analysis by Country, 2020-2035
  • Figure 59: Europe Quality Warranty Management Market Volume (Units) Analysis by Country, 2020-2035
  • Figure 60: Europe Quality Warranty Management Market Value Share (%) and BPS Analysis by Country, 2020-2035
  • Figure 61: Europe Quality Warranty Management Market Y-o-Y Growth (%) Projections by Country, 2020-2035
  • Figure 62: Europe Quality Warranty Management Market Value (US$ Mn) Analysis by Application, 2020-2035
  • Figure 63: Europe Quality Warranty Management Market Volume (Units) Analysis by Application, 2020-2035
  • Figure 64: Europe Quality Warranty Management Market Value Share (%) and BPS Analysis by Application, 2020-2035
  • Figure 65: Europe Quality Warranty Management Market Y-o-Y Growth (%) Projections by Application, 2020-2035
  • Figure 66: Europe Quality Warranty Management Market Value (US$ Mn) Analysis by End Use, 2020-2035
  • Figure 67: Europe Quality Warranty Management Market Volume (Units) Analysis by End Use, 2020-2035
  • Figure 68: Europe Quality Warranty Management Market Value Share (%) and BPS Analysis by End Use, 2020-2035
  • Figure 69: Europe Quality Warranty Management Market Y-o-Y Growth (%) Projections by End Use, 2020-2035
  • Figure 70: Europe Quality Warranty Management Market Attractiveness by Application, 2020-2035
  • Figure 71: Europe Quality Warranty Management Market Attractiveness by End Use, 2020-2035
  • Figure 72: Europe Quality Warranty Management Market Attractiveness by Country, 2020-2035
  • Figure 73: East Asia Quality Warranty Management Market Value (US$ Mn) by Application, 2020-2035
  • Figure 74: East Asia Quality Warranty Management Market Value (US$ Mn) by End Use, 2020-2035
  • Figure 75: East Asia Quality Warranty Management Market Value (US$ Mn) by Country, 2020-2035
  • Figure 76: East Asia Quality Warranty Management Market Value (US$ Mn) Analysis by Country, 2020-2035
  • Figure 77: East Asia Quality Warranty Management Market Volume (Units) Analysis by Country, 2020-2035
  • Figure 78: East Asia Quality Warranty Management Market Value Share (%) and BPS Analysis by Country, 2020-2035
  • Figure 79: East Asia Quality Warranty Management Market Y-o-Y Growth (%) Projections by Country, 2020-2035
  • Figure 80: East Asia Quality Warranty Management Market Value (US$ Mn) Analysis by Application, 2020-2035
  • Figure 81: East Asia Quality Warranty Management Market Volume (Units) Analysis by Application, 2020-2035
  • Figure 82: East Asia Quality Warranty Management Market Value Share (%) and BPS Analysis by Application, 2020-2035
  • Figure 83: East Asia Quality Warranty Management Market Y-o-Y Growth (%) Projections by Application, 2020-2035
  • Figure 84: East Asia Quality Warranty Management Market Value (US$ Mn) Analysis by End Use, 2020-2035
  • Figure 85: East Asia Quality Warranty Management Market Volume (Units) Analysis by End Use, 2020-2035
  • Figure 86: East Asia Quality Warranty Management Market Value Share (%) and BPS Analysis by End Use, 2020-2035
  • Figure 87: East Asia Quality Warranty Management Market Y-o-Y Growth (%) Projections by End Use, 2020-2035
  • Figure 88: East Asia Quality Warranty Management Market Attractiveness by Application, 2020-2035
  • Figure 89: East Asia Quality Warranty Management Market Attractiveness by End Use, 2020-2035
  • Figure 90: East Asia Quality Warranty Management Market Attractiveness by Country, 2020-2035
  • Figure 91: South Asia Quality Warranty Management Market Value (US$ Mn) by Application, 2020-2035
  • Figure 92: South Asia Quality Warranty Management Market Value (US$ Mn) by End Use, 2020-2035
  • Figure 93: South Asia Quality Warranty Management Market Value (US$ Mn) by Country, 2020-2035
  • Figure 94: South Asia Quality Warranty Management Market Value (US$ Mn) Analysis by Country, 2020-2035
  • Figure 95: South Asia Quality Warranty Management Market Volume (Units) Analysis by Country, 2020-2035
  • Figure 96: South Asia Quality Warranty Management Market Value Share (%) and BPS Analysis by Country, 2020-2035
  • Figure 97: South Asia Quality Warranty Management Market Y-o-Y Growth (%) Projections by Country, 2020-2035
  • Figure 98: South Asia Quality Warranty Management Market Value (US$ Mn) Analysis by Application, 2020-2035
  • Figure 99: South Asia Quality Warranty Management Market Volume (Units) Analysis by Application, 2020-2035
  • Figure 100: South Asia Quality Warranty Management Market Value Share (%) and BPS Analysis by Application, 2020-2035
  • Figure 101: South Asia Quality Warranty Management Market Y-o-Y Growth (%) Projections by Application, 2020-2035
  • Figure 102: South Asia Quality Warranty Management Market Value (US$ Mn) Analysis by End Use, 2020-2035
  • Figure 103: South Asia Quality Warranty Management Market Volume (Units) Analysis by End Use, 2020-2035
  • Figure 104: South Asia Quality Warranty Management Market Value Share (%) and BPS Analysis by End Use, 2020-2035
  • Figure 105: South Asia Quality Warranty Management Market Y-o-Y Growth (%) Projections by End Use, 2020-2035
  • Figure 106: South Asia Quality Warranty Management Market Attractiveness by Application, 2020-2035
  • Figure 107: South Asia Quality Warranty Management Market Attractiveness by End Use, 2020-2035
  • Figure 108: South Asia Quality Warranty Management Market Attractiveness by Country, 2020-2035
  • Figure 109: Oceania Quality Warranty Management Market Value (US$ Mn) by Application, 2020-2035
  • Figure 110: Oceania Quality Warranty Management Market Value (US$ Mn) by End Use, 2020-2035
  • Figure 111: Oceania Quality Warranty Management Market Value (US$ Mn) by Country, 2020-2035
  • Figure 112: Oceania Quality Warranty Management Market Value (US$ Mn) Analysis by Country, 2020-2035
  • Figure 113: Oceania Quality Warranty Management Market Volume (Units) Analysis by Country, 2020-2035
  • Figure 114: Oceania Quality Warranty Management Market Value Share (%) and BPS Analysis by Country, 2020-2035
  • Figure 115: Oceania Quality Warranty Management Market Y-o-Y Growth (%) Projections by Country, 2020-2035
  • Figure 116: Oceania Quality Warranty Management Market Value (US$ Mn) Analysis by Application, 2020-2035
  • Figure 117: Oceania Quality Warranty Management Market Volume (Units) Analysis by Application, 2020-2035
  • Figure 118: Oceania Quality Warranty Management Market Value Share (%) and BPS Analysis by Application, 2020-2035
  • Figure 119: Oceania Quality Warranty Management Market Y-o-Y Growth (%) Projections by Application, 2020-2035
  • Figure 120: Oceania Quality Warranty Management Market Value (US$ Mn) Analysis by End Use, 2020-2035
  • Figure 121: Oceania Quality Warranty Management Market Volume (Units) Analysis by End Use, 2020-2035
  • Figure 122: Oceania Quality Warranty Management Market Value Share (%) and BPS Analysis by End Use, 2020-2035
  • Figure 123: Oceania Quality Warranty Management Market Y-o-Y Growth (%) Projections by End Use, 2020-2035
  • Figure 124: Oceania Quality Warranty Management Market Attractiveness by Application, 2020-2035
  • Figure 125: Oceania Quality Warranty Management Market Attractiveness by End Use, 2020-2035
  • Figure 126: Oceania Quality Warranty Management Market Attractiveness by Country, 2020-2035
  • Figure 127: MEA Quality Warranty Management Market Value (US$ Mn) by Application, 2020-2035
  • Figure 128: MEA Quality Warranty Management Market Value (US$ Mn) by End Use, 2020-2035
  • Figure 129: MEA Quality Warranty Management Market Value (US$ Mn) by Country, 2020-2035
  • Figure 130: MEA Quality Warranty Management Market Value (US$ Mn) Analysis by Country, 2020-2035
  • Figure 131: MEA Quality Warranty Management Market Volume (Units) Analysis by Country, 2020-2035
  • Figure 132: MEA Quality Warranty Management Market Value Share (%) and BPS Analysis by Country, 2020-2035
  • Figure 133: MEA Quality Warranty Management Market Y-o-Y Growth (%) Projections by Country, 2020-2035
  • Figure 134: MEA Quality Warranty Management Market Value (US$ Mn) Analysis by Application, 2020-2035
  • Figure 135: MEA Quality Warranty Management Market Volume (Units) Analysis by Application, 2020-2035
  • Figure 136: MEA Quality Warranty Management Market Value Share (%) and BPS Analysis by Application, 2020-2035
  • Figure 137: MEA Quality Warranty Management Market Y-o-Y Growth (%) Projections by Application, 2020-2035
  • Figure 138: MEA Quality Warranty Management Market Value (US$ Mn) Analysis by End Use, 2020-2035
  • Figure 139: MEA Quality Warranty Management Market Volume (Units) Analysis by End Use, 2020-2035
  • Figure 140: MEA Quality Warranty Management Market Value Share (%) and BPS Analysis by End Use, 2020-2035
  • Figure 141: MEA Quality Warranty Management Market Y-o-Y Growth (%) Projections by End Use, 2020-2035
  • Figure 142: MEA Quality Warranty Management Market Attractiveness by Application, 2020-2035
  • Figure 143: MEA Quality Warranty Management Market Attractiveness by End Use, 2020-2035
  • Figure 144: MEA Quality Warranty Management Market Attractiveness by Country, 2020-2035

Explore Similar Insights

Future Market Insights

Quality Warranty Management Market