Air Quality Monitoring System Market Size and Share Forecast Outlook (2024 to 2034)

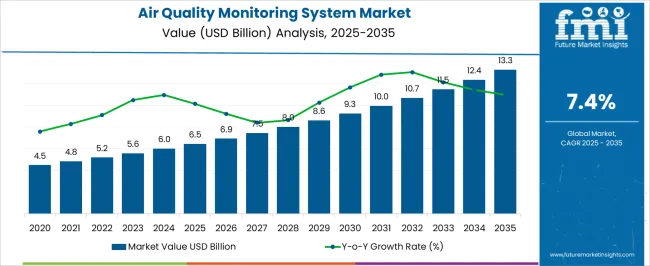
The global air quality monitoring system market is estimated to be worth USD 12.3 billion by 2034. The market is projected to register a 7.5% CAGR until 2034. In 2024, the market is estimated to be valued at USD 6 billion.

Attributes Key Statistics
Air Quality Monitoring System Market Size, 2023 USD 5.5 billion
Estimated Market Value, 2024 USD 6 billion
Projected Market Size, 2034 USD 12.3 billion
Value-based CAGR (2024 to 2034) 7.5%

Key Highlights Shaping the Air Quality Monitoring System Industry

Artificial Intelligence and Data Analytics Transforming the Market

AI and data analytics technologies are transforming the air quality monitoring industry. Businesses can now handle and analyze enormous volumes of data, providing better insights into pollution trends. Companies and regulatory agencies can more effectively tackle environmental issues by using predictive modeling, improving the knowledge of air quality dynamics. By streamlining decision-making procedures and enabling the creation of customized pollution control strategies, data analytics for air quality monitoring promotes a more robust and sustainable corporate environment.

Rising Integration in Smart City Initiatives Presents Opportunities in the Market

Real-time air quality monitoring systems are becoming essential for urban planning due to the global move toward smart cities. In addition to fostering sustainable urban development, citywide sensor networks and smart infrastructure also present financial potential for companies in the infrastructure and technology industries. The demand for advanced air quality monitoring systems increases as cities engage in smart solutions, creating profitable opportunities for companies that provide all-encompassing solutions supporting contemporary urbanization and environmental sustainability.

Drone-based Monitoring for Hard-to-Reach Areas Emerges as a Revolutionary Trend

Using drones fitted with air quality sensors to monitor dangerous or hard-to-reach places is an innovative approach. Companies that invest in drone-based environmental monitoring systems are responding to the market's need for flexible and effective monitoring methods. Drones are an invaluable tool for evaluating air quality in various settings because they provide an unmatched level of flexibility in data collection. By leveraging this trend, companies are presenting themselves as leaders in the new field of airborne environmental monitoring and offering creative solutions. This aligns with the industry's emphasis on technology development and highlights companies' marketability in drone-based air quality monitoring.

Emerging Trends in the Air Quality Monitoring System Market

Trends
  • The combination of reliable connection solutions and IoT technologies is revolutionizing the air quality monitoring system industry.
  • Businesses are realizing the environmental effect of energy projects, which is changing the landscape of air quality monitoring through the integration of renewable energy sources.
  • The market for personal air quality monitoring equipment is being driven by rising consumer awareness of the effects of air pollution on health and the environment. Companies can capitalize on this trend by providing accessible, user-friendly monitoring solutions that meet the demands of specific clients.
  • Technological developments in satellites make air pollution monitoring possible with great resolution. Businesses and governments can gain insights into cross-border pollution sources using satellite-based sensors, which give an aerial perspective of pollution trends.
  • There is growing interest in using biological indicators, such as bio-sensors that use living things, to monitor air quality. These methods use biological organisms' sensitivity to identify contaminants.
Opportunities
  • Businesses have the chance to create innovative solutions due to ongoing developments in sensor technology, data analytics, and artificial intelligence. Software and hardware advancements for environmental monitoring can give an advantage over competitors.
  • Innovative and diverse monitoring systems can be developed by partnering with companies outside conventional environmental sectors, such as manufacturing, healthcare, and technology.
  • The growing emphasis on indoor air quality offers companies a chance to provide customized solutions for homes, workplaces, and commercial establishments.
  • There's a chance to expand monitoring options to address transportation-related air quality concerns. Businesses can tackle the environmental effects of the transportation sector by creating specific systems to detect pollution around roads, airports, and shipping terminals.
  • Air quality monitoring companies can have a competitive advantage by specializing in industry emission monitoring solutions. Pressure on industries to monitor and cut emissions is growing.
Challenges
  • Businesses incur significant initial expenditures when implementing environmental monitoring technologies. This can make it more difficult for smaller firms to enter the market and prevent widespread adoption, especially in developing nations.
  • The absence of standardized procedures throughout the sector is a problem. Inconsistent standards can cause compatibility concerns across monitoring systems, preventing seamless integration and collaboration among equipment from various manufacturers.

Air Quality Monitoring System Industry Analysis by Top Investment Segments

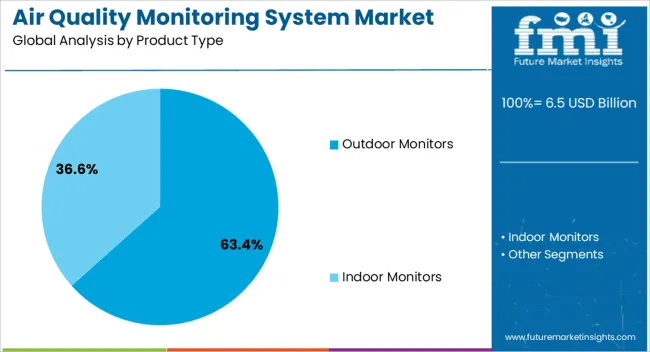
Indoor Monitors Dominate the Market by Type

Top Product Type Indoor Monitors
CAGR (2024 to 2034) 7.4%

Based on the product type, the indoor monitors segment is projected to rise at a 7.4% CAGR through 2034.

  • Indoor air quality is becoming increasingly important due to changing lifestyle habits, such as spending more time indoors, working remotely, and emphasizing home surroundings. The demand for real-time air quality monitoring systems is growing as people spend more time indoors, making them indispensable to leading healthy lives.
  • The market demand is driven by incorporating indoor air quality monitoring into smart building systems. By utilizing technology, smart buildings improve air quality and ventilation, among other building management functions. Indoor monitors that work well with smart building systems help create more energy- and health-efficient interior environments.

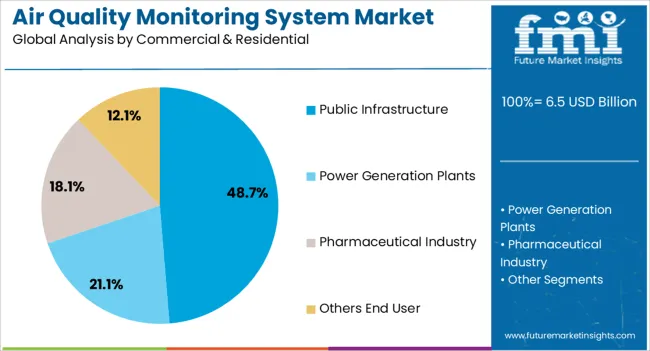
Commercial & Residential Sectors to Lead the Market by End User

Top End User Commercial & Residential
CAGR (2024 to 2034) 7.2%

Based on the end user, the commercial and residential segment is anticipated to thrive at a 7.2% CAGR through 2034.

  • Both commercial and residential consumers are becoming conscious of indoor allergens and their effects on respiratory health. The rise of illnesses such as asthma has boosted the demand for atmospheric monitoring systems capable of detecting and managing indoor allergen levels, resulting in a safer environment for those with respiratory disorders.
  • The incorporation of home automation and smart buildings with high-quality air monitoring equipment significantly influences market demand. In order to manage indoor environments more effectively and responsively, businesses and households are looking for integrated solutions that do more than just monitor air quality. These solutions can additionally assist with overall building or home automation.

Analysis of Top Countries Deploying and Regulating Air Quality Monitoring Systems

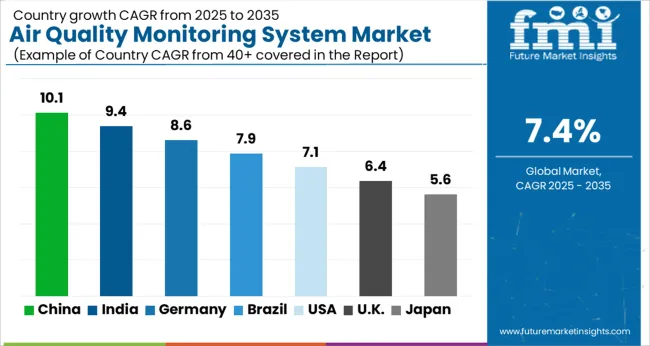
Country Value-based CAGR (2024 to 2034)
United States 7.7%
United Kingdom 8.1%
China 7.8%
Japan 8.5%
South Korea 9.9%

Rise of ESG Rating Agencies Favors Market Development in the United States

The United States air quality monitoring system market is predicted to expand at a 7.7% CAGR through 2034.

  • One factor contributing to the growth of the air quality monitoring system industry in the United States is the emergence of specialist environmental, social, and governance (ESG) rating organizations. Companies that aim to achieve high ESG ratings understand how critical environmental performance is, especially air quality control. By investing in monitoring systems, businesses can boost their ESG ratings and attract more investors, clients, and partners. Sustainability is becoming a bigger factor in the economy.
  • High-quality air monitoring equipment is in high demand in the United States due to the growing risk of environmental-related lawsuits and liability. Companies in industries like manufacturing and energy invest in robust monitoring systems to reduce legal risks.

Ambitious Net-zero Commitments to Augment Sales in the United Kingdom

The demand for air quality monitoring systems in the United Kingdom is anticipated to rise at an 8.1% CAGR through 2034.

  • The market for air quality monitoring systems is mostly being driven by the United Kingdom's aggressive net zero by 2050commitment. Businesses that understand the strategic value of achieving net-zero objectives invest in monitoring systems to evaluate and reduce their environmental effects.
  • The United Kingdom is experiencing increased green financing and sustainable investments, driving market growth. Businesses that offer advanced air quality monitoring systems are in an advantageous position to draw in green finances. Following the trends in sustainable finance strengthens financial stability and supplies funds for market penetration and technical advancement.

Rising Integration in Agricultural Practices Propels Market Growth in China

The air quality monitoring system market in China is estimated to rise at a 7.8% CAGR through 2034.

  • The incorporation of air quality monitoring into agricultural activities is a distinct factor propelling market expansion. China's air quality problems are largely caused by agriculture. Businesses that provide agriculture-specific air monitoring systems support sustainable farming methods. This emphasis on the synergy between environmental monitoring and agriculture creates new business opportunities and tackles the complex issues related to the nation's air quality.
  • China's fast industrialization and urbanization drive the demand for air quality monitoring systems. High pollution levels are caused by the concentration of companies and the growth of metropolitan areas, which calls for extensive monitoring programs.

Incorporation of Air Quality Monitoring Healthcare Systems in Japan

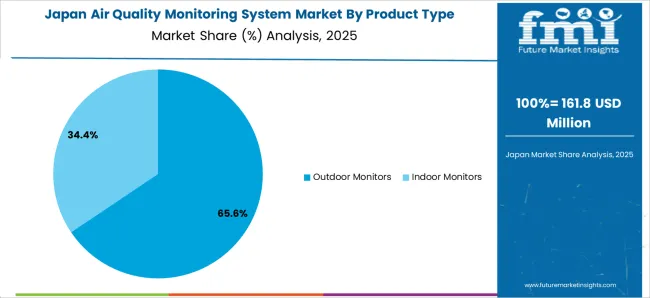
The air quality monitoring system industry in Japan is predicted to expand at an 8.5% CAGR through 2034.

  • The incorporation of air quality monitoring with healthcare systems and telemedicine is a unique aspect propelling market expansion. Companies providing real-time data regarding air quality for healthcare applications also support preventative healthcare initiatives. By integrating with telemedicine platforms, businesses can contribute to remote health monitoring and stay up to date with Japan's changing healthcare environment.
  • Japan's elderly population and related health consciousness help drive market growth. Companies that sell air quality monitoring devices benefit from people's increased awareness of health problems, particularly respiratory ailments.

Surging Demand for Health Tech Bolsters Market Growth in South Korea

The demand for air quality monitoring systems in South Korea is projected to rise at a 9.9% CAGR through 2034.

  • Consumer awareness and the need for health-tech solutions are driving the growth of the air quality monitoring market. South Korean customers, particularly those living in metropolitan areas, highly value health and wellness.
  • The emphasis on green building certification in South Korea fuels demand for air quality monitoring equipment. As more buildings seek green certifications, organizations that provide monitoring systems for indoor air quality management become increasingly important.

Competitive Landscape of the Air Quality Monitoring System Market

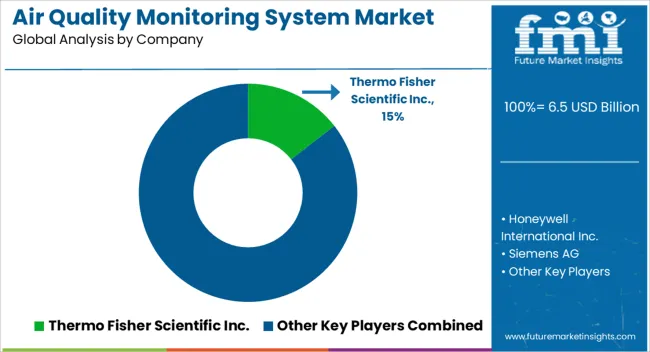
The air quality monitoring system market is marked by fierce competition among leading players, each contending for market dominance in a world driven by global environmental concerns and shifting regulatory frameworks. Prominent industry titans like Thermo Fisher Scientific, Siemens AG, and Honeywell International lead the market, which is attributable to their vast resources, wide range of products, and international presence. These behemoths present themselves as all-inclusive solution providers, offering a range of monitoring services and technology to fulfill the ever-changing and complicated demands of governments and enterprises to comply with strict air quality regulations.

Recent Developments

  • In October 2023, Vaisala, a global pioneer in meteorological, environmental, and industrial measures, announced the release of its new Beam Weather Station, a compact weather and environmental monitoring station designed for cities, road authorities, and industrial zones.
  • In April 2023, NASA launched the Tropospheric Emissions: Monitoring of Pollution (TEMPO) instrument. This powerful new tool will revolutionize Earthly life by enabling scientists to observe air quality from space with unprecedented resolution for foremost air pollutants.
  • In November 2023, the innovative drone-based multi-gas sensing and mapping system was launched by DroneAcharya Aerial Innovations Limited, which raised the bar for environmental monitoring in India.

Leading Players in the Air Quality Monitoring System Industry

  • Thermo Fisher Scientific Inc.
  • Honeywell International Inc.
  • Siemens AG
  • Emerson Electric Co.
  • 3M Company
  • Teledyne Technologies Incorporated
  • Aeroqual Ltd.
  • HORIBA, Ltd.
  • TSI Incorporated
  • Testo SE & Co. KGaA
  • AeroVironment, Inc.
  • OPSIS AB
  • Ecotech Pty Ltd.
  • Kistler Group
  • Air Quality Monitoring Network (AQMesh)
  • ECOM America Ltd.
  • Tisch Environmental Inc.
  • Vaisala Corporation
  • Environmental Sensors Inc.
  • Airpointer, Inc.

Top Segments Studied in the Air Quality Monitoring System Market

By Product Type:

  • Indoor Monitors
  • Outdoor Monitors

By Commercial & Residential:

  • Public Infrastructure
  • Power generation plants
  • Pharmaceutical Industry
  • Others End User

By Region:

  • North America
  • Latin America
  • Western Europe
  • Eastern Europe
  • Asia Pacific (APAC)
  • Middle East & Africa (MEA)
  • Japan

Table of Content

  • 1. Executive Summary
  • 2. Market Overview
  • 3. Market Background
  • 4. Global Market Analysis 2019 to 2023 and Forecast, 2024 to 2034
  • 5. Global Market Analysis 2019 to 2023 and Forecast 2024 to 2034, By Product
    • 5.1. Indoor Air Quality Monitors
    • 5.2. Outdoor Air Quality Monitors
  • 6. Global Market Analysis 2019 to 2023 and Forecast 2024 to 2034, By Pollutants
    • 6.1. Chemical Pollutant
      • 6.1.1. Nitrogen Oxides
      • 6.1.2. Sulfur Oxides
      • 6.1.3. Carbon Oxides
      • 6.1.4. Volatile Organic Compounds
      • 6.1.5. Other
    • 6.2. Physical Pollutant
    • 6.3. Biological Pollutant
  • 7. Global Market Analysis 2019 to 2023 and Forecast 2024 to 2034, By Sampling Method
    • 7.1. Active/Continuous Monitoring
    • 7.2. Manual Monitoring
    • 7.3. Passive Monitoring
    • 7.4. Stack Monitoring
  • 8. Global Market Analysis 2019 to 2023 and Forecast 2024 to 2034, By End-Use
    • 8.1. Government Agencies & Academic Institutes
    • 8.2. Government and Residential Users
    • 8.3. Petrochemical Industry
    • 8.4. Power Generation Plants
    • 8.5. Pharmaceutical Industry
    • 8.6. Smart City Authorities
    • 8.7. Others
  • 9. Global Market Analysis 2019 to 2023 and Forecast 2024 to 2034, By Region
    • 9.1. North America
    • 9.2. Latin America
    • 9.3. Western Europe
    • 9.4. Eastern Europe
    • 9.5. South Asia and Pacific
    • 9.6. East Asia
    • 9.7. Middle East and Africa
  • 10. North America Market Analysis 2019 to 2023 and Forecast 2024 to 2034, By Country
  • 11. Latin America Market Analysis 2019 to 2023 and Forecast 2024 to 2034, By Country
  • 12. Western Europe Market Analysis 2019 to 2023 and Forecast 2024 to 2034, By Country
  • 13. Eastern Europe Market Analysis 2019 to 2023 and Forecast 2024 to 2034, By Country
  • 14. South Asia and Pacific Market Analysis 2019 to 2023 and Forecast 2024 to 2034, By Country
  • 15. East Asia Market Analysis 2019 to 2023 and Forecast 2024 to 2034, By Country
  • 16. Middle East and Africa Market Analysis 2019 to 2023 and Forecast 2024 to 2034, By Country
  • 17. Key Countries Market Analysis
  • 18. Market Structure Analysis
  • 19. Competition Analysis
    • 19.1. 3M Company
    • 19.2. Aeroqual Limited
    • 19.3. Agilent Technologies, Inc
    • 19.4. Emerson Electric Co
    • 19.5. General Electric (GE) Co
    • 19.6. Honeywell International, Inc
    • 19.7. Horiba Ltd
    • 19.8. Merck KGaA
    • 19.9. PerkinElmer, Inc
    • 19.10. Siemens AG
    • 19.11. Tisch Environmental
  • 20. Assumptions & Acronyms Used
  • 21. Research Methodology

List of Tables

Table 1: Global Market Value (US$ Million) Forecast by Region, 2019 to 2034

Table 2: Global Market Volume (Units) Forecast by Region, 2019 to 2034

Table 3: Global Market Value (US$ Million) Forecast by Product, 2019 to 2034

Table 4: Global Market Volume (Units) Forecast by Product, 2019 to 2034

Table 5: Global Market Value (US$ Million) Forecast by Pollutants, 2019 to 2034

Table 6: Global Market Volume (Units) Forecast by Pollutants, 2019 to 2034

Table 7: Global Market Value (US$ Million) Forecast by Sampling Method, 2019 to 2034

Table 8: Global Market Volume (Units) Forecast by Sampling Method, 2019 to 2034

Table 9: Global Market Value (US$ Million) Forecast by End-Use, 2019 to 2034

Table 10: Global Market Volume (Units) Forecast by End-Use, 2019 to 2034

Table 11: North America Market Value (US$ Million) Forecast by Country, 2019 to 2034

Table 12: North America Market Volume (Units) Forecast by Country, 2019 to 2034

Table 13: North America Market Value (US$ Million) Forecast by Product, 2019 to 2034

Table 14: North America Market Volume (Units) Forecast by Product, 2019 to 2034

Table 15: North America Market Value (US$ Million) Forecast by Pollutants, 2019 to 2034

Table 16: North America Market Volume (Units) Forecast by Pollutants, 2019 to 2034

Table 17: North America Market Value (US$ Million) Forecast by Sampling Method, 2019 to 2034

Table 18: North America Market Volume (Units) Forecast by Sampling Method, 2019 to 2034

Table 19: North America Market Value (US$ Million) Forecast by End-Use, 2019 to 2034

Table 20: North America Market Volume (Units) Forecast by End-Use, 2019 to 2034

Table 21: Latin America Market Value (US$ Million) Forecast by Country, 2019 to 2034

Table 22: Latin America Market Volume (Units) Forecast by Country, 2019 to 2034

Table 23: Latin America Market Value (US$ Million) Forecast by Product, 2019 to 2034

Table 24: Latin America Market Volume (Units) Forecast by Product, 2019 to 2034

Table 25: Latin America Market Value (US$ Million) Forecast by Pollutants, 2019 to 2034

Table 26: Latin America Market Volume (Units) Forecast by Pollutants, 2019 to 2034

Table 27: Latin America Market Value (US$ Million) Forecast by Sampling Method, 2019 to 2034

Table 28: Latin America Market Volume (Units) Forecast by Sampling Method, 2019 to 2034

Table 29: Latin America Market Value (US$ Million) Forecast by End-Use, 2019 to 2034

Table 30: Latin America Market Volume (Units) Forecast by End-Use, 2019 to 2034

Table 31: Western Europe Market Value (US$ Million) Forecast by Country, 2019 to 2034

Table 32: Western Europe Market Volume (Units) Forecast by Country, 2019 to 2034

Table 33: Western Europe Market Value (US$ Million) Forecast by Product, 2019 to 2034

Table 34: Western Europe Market Volume (Units) Forecast by Product, 2019 to 2034

Table 35: Western Europe Market Value (US$ Million) Forecast by Pollutants, 2019 to 2034

Table 36: Western Europe Market Volume (Units) Forecast by Pollutants, 2019 to 2034

Table 37: Western Europe Market Value (US$ Million) Forecast by Sampling Method, 2019 to 2034

Table 38: Western Europe Market Volume (Units) Forecast by Sampling Method, 2019 to 2034

Table 39: Western Europe Market Value (US$ Million) Forecast by End-Use, 2019 to 2034

Table 40: Western Europe Market Volume (Units) Forecast by End-Use, 2019 to 2034

Table 41: Eastern Europe Market Value (US$ Million) Forecast by Country, 2019 to 2034

Table 42: Eastern Europe Market Volume (Units) Forecast by Country, 2019 to 2034

Table 43: Eastern Europe Market Value (US$ Million) Forecast by Product, 2019 to 2034

Table 44: Eastern Europe Market Volume (Units) Forecast by Product, 2019 to 2034

Table 45: Eastern Europe Market Value (US$ Million) Forecast by Pollutants, 2019 to 2034

Table 46: Eastern Europe Market Volume (Units) Forecast by Pollutants, 2019 to 2034

Table 47: Eastern Europe Market Value (US$ Million) Forecast by Sampling Method, 2019 to 2034

Table 48: Eastern Europe Market Volume (Units) Forecast by Sampling Method, 2019 to 2034

Table 49: Eastern Europe Market Value (US$ Million) Forecast by End-Use, 2019 to 2034

Table 50: Eastern Europe Market Volume (Units) Forecast by End-Use, 2019 to 2034

Table 51: South Asia and Pacific Market Value (US$ Million) Forecast by Country, 2019 to 2034

Table 52: South Asia and Pacific Market Volume (Units) Forecast by Country, 2019 to 2034

Table 53: South Asia and Pacific Market Value (US$ Million) Forecast by Product, 2019 to 2034

Table 54: South Asia and Pacific Market Volume (Units) Forecast by Product, 2019 to 2034

Table 55: South Asia and Pacific Market Value (US$ Million) Forecast by Pollutants, 2019 to 2034

Table 56: South Asia and Pacific Market Volume (Units) Forecast by Pollutants, 2019 to 2034

Table 57: South Asia and Pacific Market Value (US$ Million) Forecast by Sampling Method, 2019 to 2034

Table 58: South Asia and Pacific Market Volume (Units) Forecast by Sampling Method, 2019 to 2034

Table 59: South Asia and Pacific Market Value (US$ Million) Forecast by End-Use, 2019 to 2034

Table 60: South Asia and Pacific Market Volume (Units) Forecast by End-Use, 2019 to 2034

Table 61: East Asia Market Value (US$ Million) Forecast by Country, 2019 to 2034

Table 62: East Asia Market Volume (Units) Forecast by Country, 2019 to 2034

Table 63: East Asia Market Value (US$ Million) Forecast by Product, 2019 to 2034

Table 64: East Asia Market Volume (Units) Forecast by Product, 2019 to 2034

Table 65: East Asia Market Value (US$ Million) Forecast by Pollutants, 2019 to 2034

Table 66: East Asia Market Volume (Units) Forecast by Pollutants, 2019 to 2034

Table 67: East Asia Market Value (US$ Million) Forecast by Sampling Method, 2019 to 2034

Table 68: East Asia Market Volume (Units) Forecast by Sampling Method, 2019 to 2034

Table 69: East Asia Market Value (US$ Million) Forecast by End-Use, 2019 to 2034

Table 70: East Asia Market Volume (Units) Forecast by End-Use, 2019 to 2034

Table 71: Middle East and Africa Market Value (US$ Million) Forecast by Country, 2019 to 2034

Table 72: Middle East and Africa Market Volume (Units) Forecast by Country, 2019 to 2034

Table 73: Middle East and Africa Market Value (US$ Million) Forecast by Product, 2019 to 2034

Table 74: Middle East and Africa Market Volume (Units) Forecast by Product, 2019 to 2034

Table 75: Middle East and Africa Market Value (US$ Million) Forecast by Pollutants, 2019 to 2034

Table 76: Middle East and Africa Market Volume (Units) Forecast by Pollutants, 2019 to 2034

Table 77: Middle East and Africa Market Value (US$ Million) Forecast by Sampling Method, 2019 to 2034

Table 78: Middle East and Africa Market Volume (Units) Forecast by Sampling Method, 2019 to 2034

Table 79: Middle East and Africa Market Value (US$ Million) Forecast by End-Use, 2019 to 2034

Table 80: Middle East and Africa Market Volume (Units) Forecast by End-Use, 2019 to 2034

List of Figures

Figure 1: Global Market Value (US$ Million) by Product, 2024 to 2034

Figure 2: Global Market Value (US$ Million) by Pollutants, 2024 to 2034

Figure 3: Global Market Value (US$ Million) by Sampling Method, 2024 to 2034

Figure 4: Global Market Value (US$ Million) by End-Use, 2024 to 2034

Figure 5: Global Market Value (US$ Million) by Region, 2024 to 2034

Figure 6: Global Market Value (US$ Million) Analysis by Region, 2019 to 2034

Figure 7: Global Market Volume (Units) Analysis by Region, 2019 to 2034

Figure 8: Global Market Value Share (%) and BPS Analysis by Region, 2024 to 2034

Figure 9: Global Market Y-o-Y Growth (%) Projections by Region, 2024 to 2034

Figure 10: Global Market Value (US$ Million) Analysis by Product, 2019 to 2034

Figure 11: Global Market Volume (Units) Analysis by Product, 2019 to 2034

Figure 12: Global Market Value Share (%) and BPS Analysis by Product, 2024 to 2034

Figure 13: Global Market Y-o-Y Growth (%) Projections by Product, 2024 to 2034

Figure 14: Global Market Value (US$ Million) Analysis by Pollutants, 2019 to 2034

Figure 15: Global Market Volume (Units) Analysis by Pollutants, 2019 to 2034

Figure 16: Global Market Value Share (%) and BPS Analysis by Pollutants, 2024 to 2034

Figure 17: Global Market Y-o-Y Growth (%) Projections by Pollutants, 2024 to 2034

Figure 18: Global Market Value (US$ Million) Analysis by Sampling Method, 2019 to 2034

Figure 19: Global Market Volume (Units) Analysis by Sampling Method, 2019 to 2034

Figure 20: Global Market Value Share (%) and BPS Analysis by Sampling Method, 2024 to 2034

Figure 21: Global Market Y-o-Y Growth (%) Projections by Sampling Method, 2024 to 2034

Figure 22: Global Market Value (US$ Million) Analysis by End-Use, 2019 to 2034

Figure 23: Global Market Volume (Units) Analysis by End-Use, 2019 to 2034

Figure 24: Global Market Value Share (%) and BPS Analysis by End-Use, 2024 to 2034

Figure 25: Global Market Y-o-Y Growth (%) Projections by End-Use, 2024 to 2034

Figure 26: Global Market Attractiveness by Product, 2024 to 2034

Figure 27: Global Market Attractiveness by Pollutants, 2024 to 2034

Figure 28: Global Market Attractiveness by Sampling Method, 2024 to 2034

Figure 29: Global Market Attractiveness by End-Use, 2024 to 2034

Figure 30: Global Market Attractiveness by Region, 2024 to 2034

Figure 31: North America Market Value (US$ Million) by Product, 2024 to 2034

Figure 32: North America Market Value (US$ Million) by Pollutants, 2024 to 2034

Figure 33: North America Market Value (US$ Million) by Sampling Method, 2024 to 2034

Figure 34: North America Market Value (US$ Million) by End-Use, 2024 to 2034

Figure 35: North America Market Value (US$ Million) by Country, 2024 to 2034

Figure 36: North America Market Value (US$ Million) Analysis by Country, 2019 to 2034

Figure 37: North America Market Volume (Units) Analysis by Country, 2019 to 2034

Figure 38: North America Market Value Share (%) and BPS Analysis by Country, 2024 to 2034

Figure 39: North America Market Y-o-Y Growth (%) Projections by Country, 2024 to 2034

Figure 40: North America Market Value (US$ Million) Analysis by Product, 2019 to 2034

Figure 41: North America Market Volume (Units) Analysis by Product, 2019 to 2034

Figure 42: North America Market Value Share (%) and BPS Analysis by Product, 2024 to 2034

Figure 43: North America Market Y-o-Y Growth (%) Projections by Product, 2024 to 2034

Figure 44: North America Market Value (US$ Million) Analysis by Pollutants, 2019 to 2034

Figure 45: North America Market Volume (Units) Analysis by Pollutants, 2019 to 2034

Figure 46: North America Market Value Share (%) and BPS Analysis by Pollutants, 2024 to 2034

Figure 47: North America Market Y-o-Y Growth (%) Projections by Pollutants, 2024 to 2034

Figure 48: North America Market Value (US$ Million) Analysis by Sampling Method, 2019 to 2034

Figure 49: North America Market Volume (Units) Analysis by Sampling Method, 2019 to 2034

Figure 50: North America Market Value Share (%) and BPS Analysis by Sampling Method, 2024 to 2034

Figure 51: North America Market Y-o-Y Growth (%) Projections by Sampling Method, 2024 to 2034

Figure 52: North America Market Value (US$ Million) Analysis by End-Use, 2019 to 2034

Figure 53: North America Market Volume (Units) Analysis by End-Use, 2019 to 2034

Figure 54: North America Market Value Share (%) and BPS Analysis by End-Use, 2024 to 2034

Figure 55: North America Market Y-o-Y Growth (%) Projections by End-Use, 2024 to 2034

Figure 56: North America Market Attractiveness by Product, 2024 to 2034

Figure 57: North America Market Attractiveness by Pollutants, 2024 to 2034

Figure 58: North America Market Attractiveness by Sampling Method, 2024 to 2034

Figure 59: North America Market Attractiveness by End-Use, 2024 to 2034

Figure 60: North America Market Attractiveness by Country, 2024 to 2034

Figure 61: Latin America Market Value (US$ Million) by Product, 2024 to 2034

Figure 62: Latin America Market Value (US$ Million) by Pollutants, 2024 to 2034

Figure 63: Latin America Market Value (US$ Million) by Sampling Method, 2024 to 2034

Figure 64: Latin America Market Value (US$ Million) by End-Use, 2024 to 2034

Figure 65: Latin America Market Value (US$ Million) by Country, 2024 to 2034

Figure 66: Latin America Market Value (US$ Million) Analysis by Country, 2019 to 2034

Figure 67: Latin America Market Volume (Units) Analysis by Country, 2019 to 2034

Figure 68: Latin America Market Value Share (%) and BPS Analysis by Country, 2024 to 2034

Figure 69: Latin America Market Y-o-Y Growth (%) Projections by Country, 2024 to 2034

Figure 70: Latin America Market Value (US$ Million) Analysis by Product, 2019 to 2034

Figure 71: Latin America Market Volume (Units) Analysis by Product, 2019 to 2034

Figure 72: Latin America Market Value Share (%) and BPS Analysis by Product, 2024 to 2034

Figure 73: Latin America Market Y-o-Y Growth (%) Projections by Product, 2024 to 2034

Figure 74: Latin America Market Value (US$ Million) Analysis by Pollutants, 2019 to 2034

Figure 75: Latin America Market Volume (Units) Analysis by Pollutants, 2019 to 2034

Figure 76: Latin America Market Value Share (%) and BPS Analysis by Pollutants, 2024 to 2034

Figure 77: Latin America Market Y-o-Y Growth (%) Projections by Pollutants, 2024 to 2034

Figure 78: Latin America Market Value (US$ Million) Analysis by Sampling Method, 2019 to 2034

Figure 79: Latin America Market Volume (Units) Analysis by Sampling Method, 2019 to 2034

Figure 80: Latin America Market Value Share (%) and BPS Analysis by Sampling Method, 2024 to 2034

Figure 81: Latin America Market Y-o-Y Growth (%) Projections by Sampling Method, 2024 to 2034

Figure 82: Latin America Market Value (US$ Million) Analysis by End-Use, 2019 to 2034

Figure 83: Latin America Market Volume (Units) Analysis by End-Use, 2019 to 2034

Figure 84: Latin America Market Value Share (%) and BPS Analysis by End-Use, 2024 to 2034

Figure 85: Latin America Market Y-o-Y Growth (%) Projections by End-Use, 2024 to 2034

Figure 86: Latin America Market Attractiveness by Product, 2024 to 2034

Figure 87: Latin America Market Attractiveness by Pollutants, 2024 to 2034

Figure 88: Latin America Market Attractiveness by Sampling Method, 2024 to 2034

Figure 89: Latin America Market Attractiveness by End-Use, 2024 to 2034

Figure 90: Latin America Market Attractiveness by Country, 2024 to 2034

Figure 91: Western Europe Market Value (US$ Million) by Product, 2024 to 2034

Figure 92: Western Europe Market Value (US$ Million) by Pollutants, 2024 to 2034

Figure 93: Western Europe Market Value (US$ Million) by Sampling Method, 2024 to 2034

Figure 94: Western Europe Market Value (US$ Million) by End-Use, 2024 to 2034

Figure 95: Western Europe Market Value (US$ Million) by Country, 2024 to 2034

Figure 96: Western Europe Market Value (US$ Million) Analysis by Country, 2019 to 2034

Figure 97: Western Europe Market Volume (Units) Analysis by Country, 2019 to 2034

Figure 98: Western Europe Market Value Share (%) and BPS Analysis by Country, 2024 to 2034

Figure 99: Western Europe Market Y-o-Y Growth (%) Projections by Country, 2024 to 2034

Figure 100: Western Europe Market Value (US$ Million) Analysis by Product, 2019 to 2034

Figure 101: Western Europe Market Volume (Units) Analysis by Product, 2019 to 2034

Figure 102: Western Europe Market Value Share (%) and BPS Analysis by Product, 2024 to 2034

Figure 103: Western Europe Market Y-o-Y Growth (%) Projections by Product, 2024 to 2034

Figure 104: Western Europe Market Value (US$ Million) Analysis by Pollutants, 2019 to 2034

Figure 105: Western Europe Market Volume (Units) Analysis by Pollutants, 2019 to 2034

Figure 106: Western Europe Market Value Share (%) and BPS Analysis by Pollutants, 2024 to 2034

Figure 107: Western Europe Market Y-o-Y Growth (%) Projections by Pollutants, 2024 to 2034

Figure 108: Western Europe Market Value (US$ Million) Analysis by Sampling Method, 2019 to 2034

Figure 109: Western Europe Market Volume (Units) Analysis by Sampling Method, 2019 to 2034

Figure 110: Western Europe Market Value Share (%) and BPS Analysis by Sampling Method, 2024 to 2034

Figure 111: Western Europe Market Y-o-Y Growth (%) Projections by Sampling Method, 2024 to 2034

Figure 112: Western Europe Market Value (US$ Million) Analysis by End-Use, 2019 to 2034

Figure 113: Western Europe Market Volume (Units) Analysis by End-Use, 2019 to 2034

Figure 114: Western Europe Market Value Share (%) and BPS Analysis by End-Use, 2024 to 2034

Figure 115: Western Europe Market Y-o-Y Growth (%) Projections by End-Use, 2024 to 2034

Figure 116: Western Europe Market Attractiveness by Product, 2024 to 2034

Figure 117: Western Europe Market Attractiveness by Pollutants, 2024 to 2034

Figure 118: Western Europe Market Attractiveness by Sampling Method, 2024 to 2034

Figure 119: Western Europe Market Attractiveness by End-Use, 2024 to 2034

Figure 120: Western Europe Market Attractiveness by Country, 2024 to 2034

Figure 121: Eastern Europe Market Value (US$ Million) by Product, 2024 to 2034

Figure 122: Eastern Europe Market Value (US$ Million) by Pollutants, 2024 to 2034

Figure 123: Eastern Europe Market Value (US$ Million) by Sampling Method, 2024 to 2034

Figure 124: Eastern Europe Market Value (US$ Million) by End-Use, 2024 to 2034

Figure 125: Eastern Europe Market Value (US$ Million) by Country, 2024 to 2034

Figure 126: Eastern Europe Market Value (US$ Million) Analysis by Country, 2019 to 2034

Figure 127: Eastern Europe Market Volume (Units) Analysis by Country, 2019 to 2034

Figure 128: Eastern Europe Market Value Share (%) and BPS Analysis by Country, 2024 to 2034

Figure 129: Eastern Europe Market Y-o-Y Growth (%) Projections by Country, 2024 to 2034

Figure 130: Eastern Europe Market Value (US$ Million) Analysis by Product, 2019 to 2034

Figure 131: Eastern Europe Market Volume (Units) Analysis by Product, 2019 to 2034

Figure 132: Eastern Europe Market Value Share (%) and BPS Analysis by Product, 2024 to 2034

Figure 133: Eastern Europe Market Y-o-Y Growth (%) Projections by Product, 2024 to 2034

Figure 134: Eastern Europe Market Value (US$ Million) Analysis by Pollutants, 2019 to 2034

Figure 135: Eastern Europe Market Volume (Units) Analysis by Pollutants, 2019 to 2034

Figure 136: Eastern Europe Market Value Share (%) and BPS Analysis by Pollutants, 2024 to 2034

Figure 137: Eastern Europe Market Y-o-Y Growth (%) Projections by Pollutants, 2024 to 2034

Figure 138: Eastern Europe Market Value (US$ Million) Analysis by Sampling Method, 2019 to 2034

Figure 139: Eastern Europe Market Volume (Units) Analysis by Sampling Method, 2019 to 2034

Figure 140: Eastern Europe Market Value Share (%) and BPS Analysis by Sampling Method, 2024 to 2034

Figure 141: Eastern Europe Market Y-o-Y Growth (%) Projections by Sampling Method, 2024 to 2034

Figure 142: Eastern Europe Market Value (US$ Million) Analysis by End-Use, 2019 to 2034

Figure 143: Eastern Europe Market Volume (Units) Analysis by End-Use, 2019 to 2034

Figure 144: Eastern Europe Market Value Share (%) and BPS Analysis by End-Use, 2024 to 2034

Figure 145: Eastern Europe Market Y-o-Y Growth (%) Projections by End-Use, 2024 to 2034

Figure 146: Eastern Europe Market Attractiveness by Product, 2024 to 2034

Figure 147: Eastern Europe Market Attractiveness by Pollutants, 2024 to 2034

Figure 148: Eastern Europe Market Attractiveness by Sampling Method, 2024 to 2034

Figure 149: Eastern Europe Market Attractiveness by End-Use, 2024 to 2034

Figure 150: Eastern Europe Market Attractiveness by Country, 2024 to 2034

Figure 151: South Asia and Pacific Market Value (US$ Million) by Product, 2024 to 2034

Figure 152: South Asia and Pacific Market Value (US$ Million) by Pollutants, 2024 to 2034

Figure 153: South Asia and Pacific Market Value (US$ Million) by Sampling Method, 2024 to 2034

Figure 154: South Asia and Pacific Market Value (US$ Million) by End-Use, 2024 to 2034

Figure 155: South Asia and Pacific Market Value (US$ Million) by Country, 2024 to 2034

Figure 156: South Asia and Pacific Market Value (US$ Million) Analysis by Country, 2019 to 2034

Figure 157: South Asia and Pacific Market Volume (Units) Analysis by Country, 2019 to 2034

Figure 158: South Asia and Pacific Market Value Share (%) and BPS Analysis by Country, 2024 to 2034

Figure 159: South Asia and Pacific Market Y-o-Y Growth (%) Projections by Country, 2024 to 2034

Figure 160: South Asia and Pacific Market Value (US$ Million) Analysis by Product, 2019 to 2034

Figure 161: South Asia and Pacific Market Volume (Units) Analysis by Product, 2019 to 2034

Figure 162: South Asia and Pacific Market Value Share (%) and BPS Analysis by Product, 2024 to 2034

Figure 163: South Asia and Pacific Market Y-o-Y Growth (%) Projections by Product, 2024 to 2034

Figure 164: South Asia and Pacific Market Value (US$ Million) Analysis by Pollutants, 2019 to 2034

Figure 165: South Asia and Pacific Market Volume (Units) Analysis by Pollutants, 2019 to 2034

Figure 166: South Asia and Pacific Market Value Share (%) and BPS Analysis by Pollutants, 2024 to 2034

Figure 167: South Asia and Pacific Market Y-o-Y Growth (%) Projections by Pollutants, 2024 to 2034

Figure 168: South Asia and Pacific Market Value (US$ Million) Analysis by Sampling Method, 2019 to 2034

Figure 169: South Asia and Pacific Market Volume (Units) Analysis by Sampling Method, 2019 to 2034

Figure 170: South Asia and Pacific Market Value Share (%) and BPS Analysis by Sampling Method, 2024 to 2034

Figure 171: South Asia and Pacific Market Y-o-Y Growth (%) Projections by Sampling Method, 2024 to 2034

Figure 172: South Asia and Pacific Market Value (US$ Million) Analysis by End-Use, 2019 to 2034

Figure 173: South Asia and Pacific Market Volume (Units) Analysis by End-Use, 2019 to 2034

Figure 174: South Asia and Pacific Market Value Share (%) and BPS Analysis by End-Use, 2024 to 2034

Figure 175: South Asia and Pacific Market Y-o-Y Growth (%) Projections by End-Use, 2024 to 2034

Figure 176: South Asia and Pacific Market Attractiveness by Product, 2024 to 2034

Figure 177: South Asia and Pacific Market Attractiveness by Pollutants, 2024 to 2034

Figure 178: South Asia and Pacific Market Attractiveness by Sampling Method, 2024 to 2034

Figure 179: South Asia and Pacific Market Attractiveness by End-Use, 2024 to 2034

Figure 180: South Asia and Pacific Market Attractiveness by Country, 2024 to 2034

Figure 181: East Asia Market Value (US$ Million) by Product, 2024 to 2034

Figure 182: East Asia Market Value (US$ Million) by Pollutants, 2024 to 2034

Figure 183: East Asia Market Value (US$ Million) by Sampling Method, 2024 to 2034

Figure 184: East Asia Market Value (US$ Million) by End-Use, 2024 to 2034

Figure 185: East Asia Market Value (US$ Million) by Country, 2024 to 2034

Figure 186: East Asia Market Value (US$ Million) Analysis by Country, 2019 to 2034

Figure 187: East Asia Market Volume (Units) Analysis by Country, 2019 to 2034

Figure 188: East Asia Market Value Share (%) and BPS Analysis by Country, 2024 to 2034

Figure 189: East Asia Market Y-o-Y Growth (%) Projections by Country, 2024 to 2034

Figure 190: East Asia Market Value (US$ Million) Analysis by Product, 2019 to 2034

Figure 191: East Asia Market Volume (Units) Analysis by Product, 2019 to 2034

Figure 192: East Asia Market Value Share (%) and BPS Analysis by Product, 2024 to 2034

Figure 193: East Asia Market Y-o-Y Growth (%) Projections by Product, 2024 to 2034

Figure 194: East Asia Market Value (US$ Million) Analysis by Pollutants, 2019 to 2034

Figure 195: East Asia Market Volume (Units) Analysis by Pollutants, 2019 to 2034

Figure 196: East Asia Market Value Share (%) and BPS Analysis by Pollutants, 2024 to 2034

Figure 197: East Asia Market Y-o-Y Growth (%) Projections by Pollutants, 2024 to 2034

Figure 198: East Asia Market Value (US$ Million) Analysis by Sampling Method, 2019 to 2034

Figure 199: East Asia Market Volume (Units) Analysis by Sampling Method, 2019 to 2034

Figure 200: East Asia Market Value Share (%) and BPS Analysis by Sampling Method, 2024 to 2034

Figure 201: East Asia Market Y-o-Y Growth (%) Projections by Sampling Method, 2024 to 2034

Figure 202: East Asia Market Value (US$ Million) Analysis by End-Use, 2019 to 2034

Figure 203: East Asia Market Volume (Units) Analysis by End-Use, 2019 to 2034

Figure 204: East Asia Market Value Share (%) and BPS Analysis by End-Use, 2024 to 2034

Figure 205: East Asia Market Y-o-Y Growth (%) Projections by End-Use, 2024 to 2034

Figure 206: East Asia Market Attractiveness by Product, 2024 to 2034

Figure 207: East Asia Market Attractiveness by Pollutants, 2024 to 2034

Figure 208: East Asia Market Attractiveness by Sampling Method, 2024 to 2034

Figure 209: East Asia Market Attractiveness by End-Use, 2024 to 2034

Figure 210: East Asia Market Attractiveness by Country, 2024 to 2034

Figure 211: Middle East and Africa Market Value (US$ Million) by Product, 2024 to 2034

Figure 212: Middle East and Africa Market Value (US$ Million) by Pollutants, 2024 to 2034

Figure 213: Middle East and Africa Market Value (US$ Million) by Sampling Method, 2024 to 2034

Figure 214: Middle East and Africa Market Value (US$ Million) by End-Use, 2024 to 2034

Figure 215: Middle East and Africa Market Value (US$ Million) by Country, 2024 to 2034

Figure 216: Middle East and Africa Market Value (US$ Million) Analysis by Country, 2019 to 2034

Figure 217: Middle East and Africa Market Volume (Units) Analysis by Country, 2019 to 2034

Figure 218: Middle East and Africa Market Value Share (%) and BPS Analysis by Country, 2024 to 2034

Figure 219: Middle East and Africa Market Y-o-Y Growth (%) Projections by Country, 2024 to 2034

Figure 220: Middle East and Africa Market Value (US$ Million) Analysis by Product, 2019 to 2034

Figure 221: Middle East and Africa Market Volume (Units) Analysis by Product, 2019 to 2034

Figure 222: Middle East and Africa Market Value Share (%) and BPS Analysis by Product, 2024 to 2034

Figure 223: Middle East and Africa Market Y-o-Y Growth (%) Projections by Product, 2024 to 2034

Figure 224: Middle East and Africa Market Value (US$ Million) Analysis by Pollutants, 2019 to 2034

Figure 225: Middle East and Africa Market Volume (Units) Analysis by Pollutants, 2019 to 2034

Figure 226: Middle East and Africa Market Value Share (%) and BPS Analysis by Pollutants, 2024 to 2034

Figure 227: Middle East and Africa Market Y-o-Y Growth (%) Projections by Pollutants, 2024 to 2034

Figure 228: Middle East and Africa Market Value (US$ Million) Analysis by Sampling Method, 2019 to 2034

Figure 229: Middle East and Africa Market Volume (Units) Analysis by Sampling Method, 2019 to 2034

Figure 230: Middle East and Africa Market Value Share (%) and BPS Analysis by Sampling Method, 2024 to 2034

Figure 231: Middle East and Africa Market Y-o-Y Growth (%) Projections by Sampling Method, 2024 to 2034

Figure 232: Middle East and Africa Market Value (US$ Million) Analysis by End-Use, 2019 to 2034

Figure 233: Middle East and Africa Market Volume (Units) Analysis by End-Use, 2019 to 2034

Figure 234: Middle East and Africa Market Value Share (%) and BPS Analysis by End-Use, 2024 to 2034

Figure 235: Middle East and Africa Market Y-o-Y Growth (%) Projections by End-Use, 2024 to 2034

Figure 236: Middle East and Africa Market Attractiveness by Product, 2024 to 2034

Figure 237: Middle East and Africa Market Attractiveness by Pollutants, 2024 to 2034

Figure 238: Middle East and Africa Market Attractiveness by Sampling Method, 2024 to 2034

Figure 239: Middle East and Africa Market Attractiveness by End-Use, 2024 to 2034

Figure 240: Middle East and Africa Market Attractiveness by Country, 2024 to 2034

Frequently Asked Questions

How Big is the Air Quality Monitoring System Market?

The global air quality monitoring system market is estimated to be valued at USD 6 billion in 2024.

What is the Projected CAGR of the Air Quality Monitoring System Market?

The market is estimated to increase at a 7.5% CAGR through 2034.

What is the Future Outlook for the Air Quality Monitoring System Market?

The market is anticipated to be worth USD 12.3 billion by 2034.

Which is the Leading Product Type in the Air Quality Monitoring System Market?

Indoor monitors are the leading product type in the market.

Which Country is Rising at a Higher CAGR in the Air Quality Monitoring System Market?

The market in South Korea is predicted to rise at a CAGR of 9.9% through 2034.

Explore Similar Insights

Future Market Insights

Air Quality Monitoring System Market