The railway flatcar market is estimated at USD 358.7 million in 2025 and is forecasted to reach USD 679.8 million by 2035, growing at a CAGR of 6.6%. The forecasted growth reflects a steady rise driven primarily by increasing demand for freight transportation efficiency, advancements in rail infrastructure, and adoption of specialized flatcar designs for heavy and oversized cargo. From 2025 to 2026, the market rises to USD 382.4 million, representing a notable year-over-year increase of 6.6%, driven by expanding industrial logistics requirements and modernization of railway fleets in developing regions. Early adoption of automation and smart rail technologies also fuels demand in the initial phase of the forecast period.
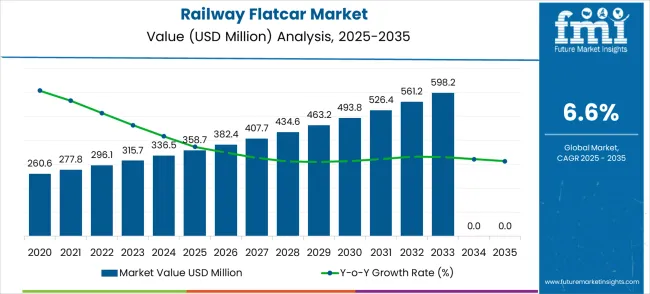
From 2027 to 2030, the market demonstrates consistent expansion, moving from USD 407.7 million in 2027 to USD 493.8 million in 2030. This period marks constant growth with annual increments averaging 6.5% to 6.8%. Key drivers include government investments in rail freight corridors, particularly in Asia and North America, and regulatory encouragement for shifting freight from road to rail to lower emissions. The rise of intermodal logistics solutions also enhances the demand for flatcars, as they provide flexibility for carrying diverse cargo types. These developments highlight a strategic shift in logistics operations globally.
| Railway Flatcar Market | Value |
|---|---|
| Market Value (2025) | USD 358.7 million |
| Market Forecast Value (2035) | USD 679.8 million |
| Market Forecast CAGR | 6.6% |
The period between 2031 and 2035 shows a gradual acceleration in market value, rising from USD 526.4 million in 2031 to USD 679.8 million by 2035. This phase reflects the maturation of growth dynamics and the influence of long-term industry drivers such as global trade expansion and continued investment in rail infrastructure upgrades. Notable inflection points appear in 2032 and 2033, where annual growth edges higher, reflecting the integration of advanced lightweight materials and modular flatcar designs that improve payload efficiency. Policy initiatives supporting environmentally green transportation amplify market momentum during these years.
While growth remains steady, certain restraints could influence the trajectory. Raw material price volatility, particularly in steel and alloys, can affect manufacturing costs. Economic slowdowns or trade disruptions may reduce demand for flatcar capacity, impacting YoY growth in specific years. The market’s consistent growth pattern reflects resilience and long-term opportunity. Industry stakeholders are positioned to benefit from predictable expansion, driven by evolving global logistics requirements and green transport trends.
Market expansion is being supported by the rapid increase in infrastructure development projects worldwide and the corresponding need for efficient heavy equipment transport solutions that provide superior load capacity and operational safety. Modern construction and infrastructure projects rely on specialized transport equipment and rail-based logistics to ensure optimal project execution including large-scale construction, emergency response deployments, and municipal infrastructure development. Even minor transport inefficiencies can require comprehensive project logistics adjustments to maintain optimal construction timelines and operational performance.
The growing complexity of infrastructure projects and increasing demand for heavy-duty transport solutions are driving demand for advanced railway flatcars from certified manufacturers with appropriate load capacity capabilities and technical expertise. Construction companies and emergency response organizations are increasingly requiring documented equipment reliability and transport efficiency to maintain project schedules and operational effectiveness. Industry specifications and safety standards are establishing standardized heavy transport procedures that require specialized flatcar technologies and trained rail operators.
The shift toward green transportation practices and reduced carbon emissions is further accelerating adoption of rail-based transport solutions that minimize environmental impact while optimizing logistics efficiency. Growing focus on emergency preparedness and disaster response capabilities is creating demand for specialized flatcars that can rapidly deploy heavy equipment and emergency response vehicles to affected areas. Increasing focus on municipal infrastructure modernization and smart city development is driving investments in rail transport solutions that can support efficient movement of construction equipment and materials.
The Railway Flatcar market is entering a new phase of growth, driven by demand for infrastructure development, emergency response capabilities, and evolving logistics efficiency and safety standards. By 2035, these pathways together can unlock USD 120-150 million in incremental revenue opportunities beyond baseline growth.
Pathway A -- Mechanical Drive System Leadership (Proven Reliability) The mechanical type segment already holds the largest share due to its reliability and cost-effectiveness. Expanding automation integration, enhanced loading systems, and improved safety features can consolidate leadership. Opportunity pool: USD 35-45 million.
Pathway B -- Construction & Engineering Applications (Infrastructure Development) Construction & engineering applications account for the majority of demand. Growing infrastructure projects, especially mega construction initiatives, will drive higher adoption of specialized flatcar transport systems. Opportunity pool: USD 30-40 million.
Pathway C -- Emergency Response & Disaster Management Government focus on emergency preparedness and disaster response capabilities is expanding demand for rapid deployment flatcar systems. Specialized emergency response configurations offer significant growth potential. Opportunity pool: USD 20-25 million.
Pathway D -- Emerging Market Expansion Asia-Pacific, Latin America, and Africa present growing demand due to infrastructure development and rail network expansion. Targeting regional rail operators and cost-effective solutions will accelerate adoption. Opportunity pool: USD 15-20 million.
Pathway E -- Smart Rail & Digital Integration Advanced telematics, GPS tracking, and digital integration capabilities offer premium positioning for modern rail operations and integrated logistics systems. Opportunity pool: USD 10-15 million.
Pathway F -- Municipal Infrastructure & Smart Cities Urban development and smart city initiatives are creating demand for specialized flatcars supporting municipal infrastructure projects and public works operations. Opportunity pool: USD 8-12 million.
Pathway G -- Service, Maintenance & Lifecycle Support Recurring revenue from maintenance contracts, parts supply, and lifecycle support services creates long-term revenue streams for manufacturers and service providers. Opportunity pool: USD 6-10 million.
Pathway H -- Electric & Hybrid Drive Systems Growing environmental consciousness and electrification trends offer opportunities for electric and hybrid flatcar drive systems in environmentally sensitive applications. Opportunity pool: USD 4-8 million.
The market is segmented by drive type, application, and region. By drive type, the market is divided into mechanical type, electrically type, hydraulic type, and others. Based on application, the market is categorized into construction & engineering industry, emergency response & fire protection industry, municipal & infrastructure industry, and others. Regionally, the market is divided into North America, Europe, East Asia, South Asia & Pacific, Latin America, and Middle East & Africa.
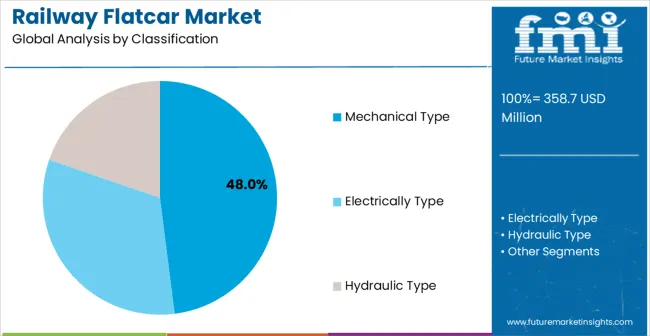
In 2025, the mechanical type railway flatcar segment is projected to capture around 48% of the total market share, making it the leading drive technology category. This dominance is largely driven by the widespread adoption of proven mechanical systems that provide reliable performance and cost-effective operation across diverse transport applications. The mechanical type flatcar is particularly favored for its ability to deliver consistent loading and unloading performance with minimal maintenance requirements, ensuring operational reliability and reduced lifecycle costs.
Construction contractors, emergency response organizations, municipal authorities, and industrial operators increasingly prefer this drive type, as it meets diverse transport requirements without imposing excessive operational complexity or specialized maintenance demands. The availability of well-established service networks, along with comprehensive parts availability and technical support from leading manufacturers, further reinforces the segment's market position.
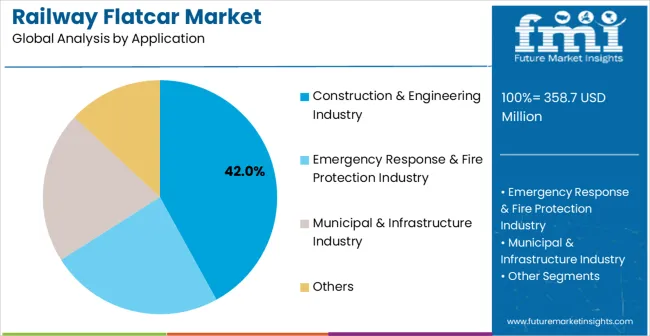
The construction & engineering industry segment is expected to represent 42% of railway flatcar demand in 2025, highlighting its position as the most significant application sector. This dominance stems from the unique operational needs of construction projects, where efficient transport of heavy equipment and materials is critical to project success and timeline management. Construction sites often feature requirements for moving large machinery, prefabricated components, and construction materials that exceed the capacity of conventional transport methods. Railway flatcars are particularly well-suited to these environments due to their ability to handle oversized and heavyweight cargo while maintaining transport efficiency and safety standards.
As construction activities expand globally and emphasize improved logistics efficiency, the demand for specialized flatcar transport continues to rise. The segment also benefits from increased infrastructure development and urbanization projects, where contractors are increasingly prioritizing rail transport as an essential tool to improve project logistics and reduce transportation costs.
The market is advancing steadily due to increasing infrastructure development projects and growing recognition of rail transport advantages over road transport for heavy cargo applications. The market faces challenges including higher initial investment compared to road transport alternatives, need for specialized rail infrastructure, and varying rail gauge standards across different geographic regions. Infrastructure development efforts and logistics optimization programs continue to influence flatcar design and market adoption patterns.
The growing development of smart rail systems and Internet of Things capabilities is enabling higher operational efficiency with improved cargo monitoring and predictive maintenance characteristics. Enhanced IoT technologies and optimized sensor systems provide superior transport visibility while maintaining safety compliance requirements. These technologies are particularly valuable for large-scale logistics operations that require reliable transport performance supporting extensive construction and infrastructure projects with minimal operational disruption and consistent delivery schedules.
Modern railway flatcar manufacturers are incorporating advanced automated loading systems and enhanced safety features that improve operational efficiency and worker safety effectiveness. Integration of hydraulic loading mechanisms and automated securing systems enables superior cargo handling and comprehensive safety capabilities. Advanced automation features support operation across diverse project environments while meeting various safety requirements and operational specifications, enabling seamless integration with construction site logistics and emergency response protocols.
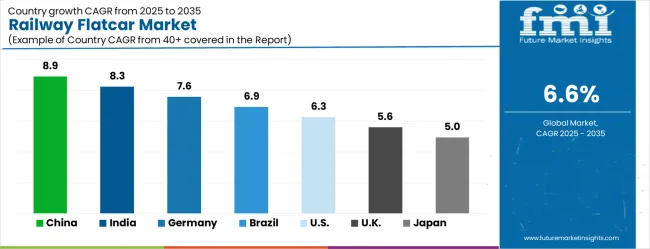
| Country | CAGR (2025-2035) |
|---|---|
| China | 8.9% |
| India | 8.3% |
| Germany | 7.6% |
| Brazil | 6.9% |
| United States | 6.3% |
| United Kingdom | 5.6% |
| Japan | 5.0% |
The market is growing robustly, with China leading at an 8.9% CAGR through 2035, driven by massive infrastructure development projects and increasing adoption of rail-based heavy transport solutions. India follows at 8.3%, supported by rising railway infrastructure expansion and growing demand for specialized freight transport equipment. Germany grows steadily at 7.6%, integrating advanced flatcar technology into its established rail infrastructure and industrial logistics systems. Brazil records 6.9%, focusing railway modernization and infrastructure development initiatives. The United States shows solid growth at 6.3%, focusing on rail infrastructure renewal and freight transport efficiency. The United Kingdom demonstrates steady progress at 5.6%, maintaining established rail transport and construction applications. Japan records 5.0% growth, concentrating on precision rail technology development and operational efficiency optimization.
The report covers an in-depth analysis of 40+ countries; top-performing countries are highlighted below.
China is anticipated to achieve a CAGR of 8.9% between 2025 and 2035, supported by its expanding freight rail network and infrastructure modernization projects. The demand for railway flatcars is being driven by large-scale industrial projects, heavy cargo transport needs, and increased bulk material movement. Government investments in high-speed rail and freight corridors have encouraged manufacturing upgrades and fleet expansions. Domestic manufacturers are enhancing flatcar designs to improve load capacity and efficiency while reducing operational costs. Adoption of advanced materials and automation in manufacturing processes is creating stronger market momentum. The growth in cross-border rail trade, particularly under initiatives like Belt and Road, is also boosting the demand for specialized flatcars designed for heavy and oversized cargo.
India is projected to grow at a CAGR of 8.3% during 2025–2035, driven by ongoing expansion in freight rail capacity and modernization of rolling stock. The government’s focus on strengthening logistics efficiency through initiatives such as dedicated freight corridors has increased flatcar demand. Heavy industries including steel, cement, and chemicals require specialized flatcars for bulk transport, fueling market growth. Indian rail manufacturers are adopting modular designs and durable materials to enhance service life and efficiency. International collaborations are also supporting the development of technologically advanced flatcars. Increased industrial production and growing export requirements for raw materials further strengthen demand. These trends position India as one of the key markets for railway flatcar manufacturing over the next decade.
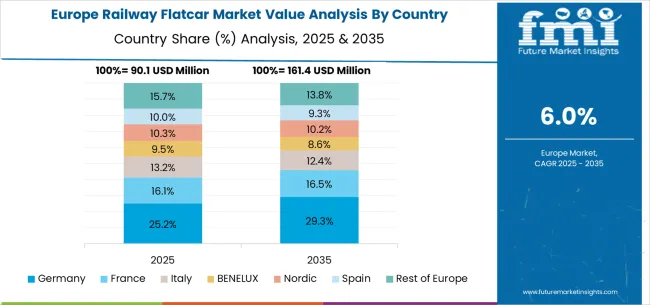
Germany is expected to advance at a CAGR of 7.6% between 2025 and 2035, supported by its focus on modern rail logistics and green transport solutions. The growth of intermodal freight transport, combining rail and road networks, has strengthened the need for specialized flatcars. German manufacturers are developing advanced designs with higher payload capacity and improved energy efficiency. Compliance with European standards for cargo safety and interoperability drives innovations in flatcar technology. The expansion of the freight rail corridor across Europe also creates demand for robust, adaptable flatcar solutions. Germany’s strong industrial base, especially in automotive and heavy manufacturing, ensures steady growth in flatcar demand for transporting large equipment and components.
Brazil is forecasted to register a CAGR of 6.9% from 2025 to 2035, supported by infrastructure modernization and expanding demand for bulk transportation. The mining, agriculture, and energy sectors contribute significantly to flatcar utilization, transporting commodities such as iron ore, soybeans, and coal. Government initiatives to improve rail freight efficiency have stimulated investment in new flatcar models and maintenance upgrades. Local manufacturers are adopting stronger and more durable flatcar designs to withstand heavy loads in challenging environments. The expansion of cross-country rail corridors has further increased the need for specialized flatcars, while export growth in raw materials drives higher demand. This positions Brazil as a growing market for railway flatcar production and innovation.
The United States is projected to register a CAGR of 6.3% between 2025 and 2035, supported by modernization of freight rail infrastructure and increasing demand for heavy load transport. The market is driven by coal, chemicals, and automotive sectors requiring specialized flatcars for oversized and heavy freight. USA rail operators are upgrading fleets with advanced materials to improve durability and reduce maintenance costs. The adoption of automated monitoring and tracking systems for flatcars is enhancing operational efficiency. Expansion of intermodal rail terminals and connections to ports is further strengthening demand. These factors create a positive growth environment for the railway flatcar industry in the United States.
The United Kingdom is expected to grow at a CAGR of 5.6% from 2025 to 2035, driven by freight rail modernization and intermodal logistics expansion. Increasing focus on reducing road congestion and carbon footprint is enhancing the role of rail transport. Flatcars are in high demand for carrying heavy machinery, construction equipment, and intermodal containers. Investments in port connectivity and rail freight corridors have improved operational efficiency, stimulating flatcar demand. UK rail manufacturers are developing flatcars with modular capabilities to meet diverse cargo requirements. The adoption of advanced maintenance systems is also improving flatcar lifespan and reducing downtime. These developments place the UK as a growing market for flatcar innovation.
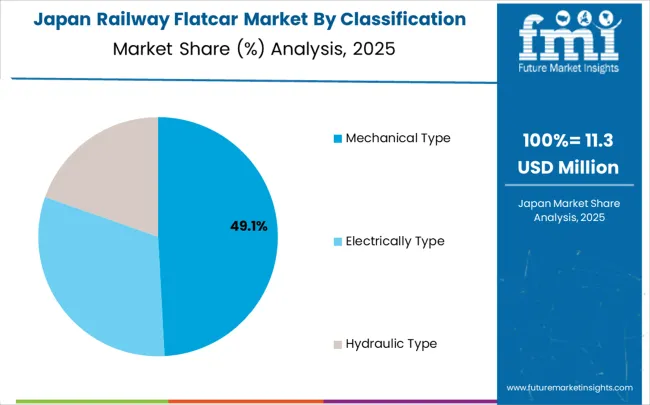
Japan is forecasted to grow at a CAGR of 5.0% during 2025–2035, supported by its strong rail network and focus on freight efficiency. Flatcars are increasingly used in transporting heavy industrial goods, manufacturing equipment, and containerized cargo. The demand is supported by Japan’s growing focus on integrated logistics and just-in-time supply chain models. Domestic manufacturers are focusing on lightweight yet durable flatcar designs to improve operational efficiency and energy consumption. The government’s initiatives to enhance port-rail connectivity and expand freight corridors further fuel demand. Japan’s investments in advanced manufacturing techniques also enable higher customization in flatcar production, meeting diverse industry needs. These factors support steady growth in the market over the forecast period.
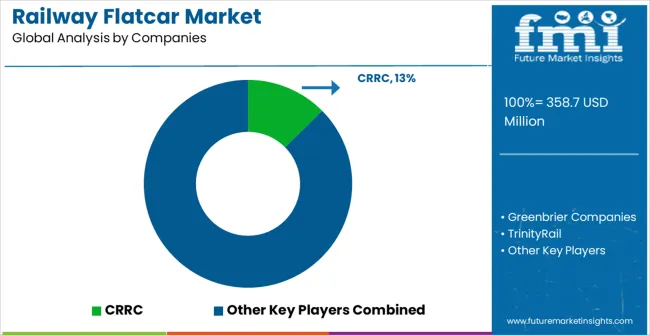
The market is defined by competition among specialized rail equipment manufacturers, rolling stock companies, and integrated rail solution providers. Companies are investing in advanced drive system development, automated loading technology integration, safety enhancement improvements, and comprehensive service capabilities to deliver reliable, efficient, and versatile flatcar solutions. Strategic partnerships, technological innovation, and market expansion are central to strengthening product portfolios and market presence.
CRRC offers comprehensive railway flatcar solutions with established manufacturing expertise and market-leading rail equipment capabilities. Greenbrier Companies provides specialized flatcar systems with focus on freight transport and industrial applications. TrinityRail delivers innovative rail transport solutions with focus on operational efficiency and safety optimization. United Wagon Company specializes in heavy-duty flatcar platforms with advanced load handling capabilities.
TMH (Transmashholding) offers professional-grade railway equipment with comprehensive engineering and service support capabilities. FreightCar America delivers North American rail solutions with focus on freight transport efficiency. Nippon Sharyo provides Japanese-engineered rail equipment with focus on precision and reliability. Multiple regional manufacturers including Inner Mongolia First Machinery Group, Chongqing Changzheng Heavy Industry, Jinxi Axle Company, and international players like Uralvagonzavod, Altaivagon, and Tatravagónka Poprad offer specialized flatcar solutions across global and regional market segments.
| Item | Value |
|---|---|
| Quantitative Units | USD 358.7 million |
| Drive Type | Mechanical Type, Electrically Type, Hydraulic Type, Others |
| Application | Construction & Engineering Industry, Emergency Response & Fire Protection Industry, Municipal & Infrastructure Industry, Others |
| Regions Covered | North America, Europe, East Asia, South Asia & Pacific, Latin America, Middle East & Africa |
| Country Covered | China, India, Germany, Brazil, United States, United Kingdom, Japan, and 40+ countries |
| Key Companies Profiled | CRRC, Greenbrier Companies, TrinityRail, United Wagon Company, TMH (Transmashholding), FreightCar America, Nippon Sharyo, Kasgro Rail Corporation, Amsted Rail, RM Rail, Inner Mongolia First Machinery Group Co., Ltd., Chongqing Changzheng Heavy Industry Co., Ltd., Jinxi Axle Company Limited, Jinan Dongfang Xinxing Vehicle Co., Ltd., Uralvagonzavod, Altaivagon, Tatravagónka Poprad, National Steel Car, UTLX, American Railcar Transport, Titagarh Wagons, Jupiter Wagons, Texmaco Rail & Engineering |
| Additional Attributes | Dollar sales by drive type and application segment, regional demand trends across major markets, competitive landscape with established rail equipment manufacturers and emerging technology providers, customer preferences for different drive systems and loading configurations, integration with rail transport systems and logistics protocols, innovations in automated loading technologies and safety systems, and adoption of smart rail features with enhanced operational workflows for improved transport efficiency and cargo handling capabilities. |
The global railway flatcar market is estimated to be valued at USD 358.7 million in 2025.
The market size for the railway flatcar market is projected to reach USD 679.8 million by 2035.
The railway flatcar market is expected to grow at a 6.6% CAGR between 2025 and 2035.
The key product types in railway flatcar market are mechanical type, electrically type and hydraulic type.
In terms of application, construction & engineering industry segment to command 42.0% share in the railway flatcar market in 2025.


Our Research Products

The "Full Research Suite" delivers actionable market intel, deep dives on markets or technologies, so clients act faster, cut risk, and unlock growth.

The Leaderboard benchmarks and ranks top vendors, classifying them as Established Leaders, Leading Challengers, or Disruptors & Challengers.

Locates where complements amplify value and substitutes erode it, forecasting net impact by horizon

We deliver granular, decision-grade intel: market sizing, 5-year forecasts, pricing, adoption, usage, revenue, and operational KPIs—plus competitor tracking, regulation, and value chains—across 60 countries broadly.

Spot the shifts before they hit your P&L. We track inflection points, adoption curves, pricing moves, and ecosystem plays to show where demand is heading, why it is changing, and what to do next across high-growth markets and disruptive tech

Real-time reads of user behavior. We track shifting priorities, perceptions of today’s and next-gen services, and provider experience, then pace how fast tech moves from trial to adoption, blending buyer, consumer, and channel inputs with social signals (#WhySwitch, #UX).

Partner with our analyst team to build a custom report designed around your business priorities. From analysing market trends to assessing competitors or crafting bespoke datasets, we tailor insights to your needs.
Supplier Intelligence
Discovery & Profiling
Capacity & Footprint
Performance & Risk
Compliance & Governance
Commercial Readiness
Who Supplies Whom
Scorecards & Shortlists
Playbooks & Docs
Category Intelligence
Definition & Scope
Demand & Use Cases
Cost Drivers
Market Structure
Supply Chain Map
Trade & Policy
Operating Norms
Deliverables
Buyer Intelligence
Account Basics
Spend & Scope
Procurement Model
Vendor Requirements
Terms & Policies
Entry Strategy
Pain Points & Triggers
Outputs
Pricing Analysis
Benchmarks
Trends
Should-Cost
Indexation
Landed Cost
Commercial Terms
Deliverables
Brand Analysis
Positioning & Value Prop
Share & Presence
Customer Evidence
Go-to-Market
Digital & Reputation
Compliance & Trust
KPIs & Gaps
Outputs
Full Research Suite comprises of:
Market outlook & trends analysis
Interviews & case studies
Strategic recommendations
Vendor profiles & capabilities analysis
5-year forecasts
8 regions and 60+ country-level data splits
Market segment data splits
12 months of continuous data updates
DELIVERED AS:
PDF EXCEL ONLINE
Railway Communication Equipment Market Size and Share Forecast Outlook 2025 to 2035
Railway Rolling Stock Market Forecast and Outlook 2025 to 2035
Railway System Market Size and Share Forecast Outlook 2025 to 2035
Railway Air Conditioning System Market Size and Share Forecast Outlook 2025 to 2035
Railway Braking System Market Size and Share Forecast Outlook 2025 to 2035
Railway CNC Wheel Lathe Market Size and Share Forecast Outlook 2025 to 2035
Railway Roof Switches Market Size and Share Forecast Outlook 2025 to 2035
Railway Window Market Size and Share Forecast Outlook 2025 to 2035
Railway Maintenance Machinery Market Size and Share Forecast Outlook 2025 to 2035
Railway Control Stands Market Size and Share Forecast Outlook 2025 to 2035
Railway Horn Market Size and Share Forecast Outlook 2025 to 2035
Railway Axlebox Housing Market Analysis - Size, Share, and Forecast Outlook 2025 to 2035
Railway After-Cooler Market - Growth & Demand 2025 to 2035
Railway Coupler Market Growth & Demand 2025 to 2035
Railway Generators Market Growth - Trends & Forecast 2025 to 2035
Railway Draft Gears Market Growth – Trends & Forecast 2025 to 2035
Railway Emergency Valves Market Trends and Forecast 2025 to 2035
Railway Air Filter Market – Growth & Demand 2025 to 2035
Railway Fishplate Market Growth – Trends & Forecast 2025 to 2035
Railway Traction Motor Market Growth – Trends & Forecast 2025 to 2035

Thank you!
You will receive an email from our Business Development Manager. Please be sure to check your SPAM/JUNK folder too.
Chat With
MaRIA