Reports

- Global Locations -

Headquarters

Future Market Insights, Inc.

Christiana Corporate, 200
Continental Drive, Suite 401,
Newark, Delaware - 19713,
United States

T: +1-845-579-5705

Americas

Future Market Insights, Inc.

616 Corporate Way, Suite 2-9018,
Valley Cottage, NY 10989, United States

T: +1-347-918-3531

MEA

Future Market Insights

1602-6 Jumeirah Bay X2 Tower, Plot No: JLT-PH2-X2A,
Jumeirah Lakes Towers, Dubai,
United Arab Emirates

Europe

Future Market Insights

3rd Floor, 207 Regent Street,
W1B 3HH London
United Kingdom

T: + 44 (0) 20 8123 9659
D: +44 (0) 20 3287 4268

Asia Pacific

Future Market Insights

IndiaLand Global Tech Park, Unit UG-1, Behind Grand HighStreet, Phase 1, Hinjawadi, MH, Pune – 411057, India

Railway Horn Market Outlook (2023 to 2033)

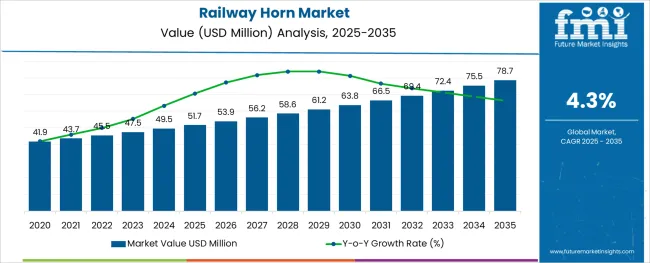
The global railway horn market is valued at USD 47.5 million by 2023 and is expected to grow at a CAGR of 4.30% during the forecast period. The railway horn market is expected to reach USD 72.3 million by 2033.

An increase in the sales of railway horns is anticipated to drive the railway horn market during the assessment period. The ability to customize an automobile horn's appearance as well as its frequency and volume gives the automotive industry more variety.

The lifespan of a railway horn is extremely short and entirely dependent on usage. Due to the noise pollution, it creates, the market for railway horns may not expand as quickly as anticipated.

Attributes Details
Market CAGR (2023 to 2033) 4.30%
Market Size (2022) USD 45.3 million
Market Size (2023) USD 47.5 million
Market Size (2033) USD 72.3 million

Don't pay for what you don't need

Customize your report by selecting specific countries or regions and save 30%!

Important Market Factors Affecting the Growth of the Market

Global governing bodies have imposed several strict standards on manufacturing firms regarding the volume of railway horns. Globally increasing vehicle sales and production are anticipated to fuel the railway horn market.

Another factor that is anticipated to drive the market is the low cost and simplicity of horn production. OEMs are putting a lot of effort into creating horns that can be heard from a distance. OEMs produce horns with certain intensity so that they don't abruptly distract the driver of another vehicle. Railway horns can be modified to suit the needs of the user.

Key Challenges Encountered by the Market

High-intensity horns lead to noise pollution, which is expected to impede the expansion of the railway horn market.

The market for railway horns has seen a restriction on production options and offerings for some manufacturers as a result of growing health concerns and targeted regulation intended to cut certain frequencies.

Nikhil Kaitwade
Nikhil Kaitwade

Principal Consultant

Talk to Analyst

Find your sweet spots for generating winning opportunities in this market.

Which Emerging Trends Are Driving Demand for Railway Horns?

Demand for railway horns is being driven by need. Although the type of usage affects the life cycle of a railway horn, it is generally believed that a horn system has a minimum life cycle of two to four years. Therefore, the growing replacement of railway horns offers a stable market opportunity for railway horns.

Comparative View of Adjacent Railway Horn Market

Railway Horn Market:

Attributes Railway Horn Market
CAGR (2023 to 2033) 4.3%
Market Value (2023) US$ 47.5 Million
Opportunity Demand for railway horns may also be boosted by growing knowledge of the effectiveness of using car horns as a deterrent to such incidents.
Key Trends During the anticipated timeframe, an increase in the number of accidents and fatalities brought on by careless driving may be a key trend driving the railway horn market’s expansion.

Railway Wiring Harness Market:

Attributes Railway Wiring Harness Market
CAGR (2023 to 2033) 5.40%
Market Value (2023) US$ 4,366.50 Million
Growth Factor Advancements in railway electrical and mechanical systems are projected to drive market expansion.
Opportunity The introduction of driverless trains is seen as a possible opportunity for the market.
Key Trends The development of better transportation infrastructures is likely to drive market expansion.

Railway Telematics Market:

Attributes Railway Telematics Market
CAGR (2023 to 2033) 7.5%
Market Value (2023) US$ 13.18 Billion
Growth Factor The increased demand for a safe, secure, and efficient transportation system is expected to drive market expansion.
Opportunity Due to improved telematics technologies, advanced transportation systems are less likely to see deaths, adding to growth.
Key Trends The increasing demand for digitalization of railcar tracking and rail freight transportation will fuel growth.

Get the data you need at a Fraction of the cost

Personalize your report by choosing insights you need
and save 40%!

Which is the Leading Segment in the Market by Horn Type?

The market is divided into electric and air horns based on horn type. Over the course of the forecast period, the electric horn segment is anticipated to rule the market.

Electric horns are typically found in passenger and commercial vehicles because of how loud they are and how easily they can be adjusted to suit the needs of the user. Electric horns' low price and simplicity of installation are predicted to keep them in the lead throughout the forecast period.

Based on Design Type Which Is the Most Prominent Segment in the Market?

The three main types of railway horns are flat, spiral, and trumpet.

The flat horn market segment currently has the largest market share and is anticipated to keep leading during the forecast period. In comparison to spiral and trumpet-shaped horns, flat horns are smaller in size and have a longer lifespan.
Regional Outlook

Asia Pacific Insights

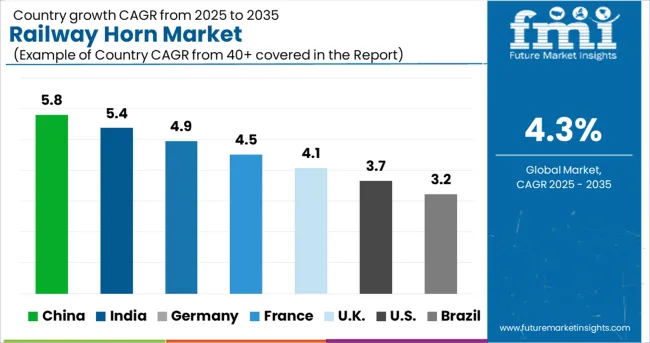
Due to rising vehicle production and sales in this region, it is anticipated that the Asia Pacific may hold the largest market share for railway horns and may continue to dominate the market for the assessment period. China has a CAGR of 4.9% in the railway horn market during the forecast period.

How may the Growth of the Railway Horn Market Escalate across India?

India may dominate the railway horn market with a CAGR of 5.9%. These areas have the highest potential for the railway horn market because of the developing automotive industry and steady aftermarket prospects.

How is Japan's Aiding Railway Market Growth for Horn in the Asia Pacific?

Given the massive production of railway horns in the rising countries, the Asia Pacific i.e. Japan might expect a rise in the industry in the next years with a market share of 5%. In addition, the rapid expansion is a reaction to the OEMs' high production in quickly developing nations. Numerous laws and regulations require safety measures in cars, including horn systems.

Europe Insights

The railway horn market is predicted to place Europe in second place overall. The railway horn market in Germany is to have a market share of 4.5% from 2023 to 2033.

Germany and Italy are the two countries that contribute most to the market for railway horns in Western Europe due to the region's robust export market.

What Accounts for United Kingdom’s Railway Horn Sales?

The market for railway horns in the United Kingdom is to grow at a CAGR of 3.4% from 2023 to 2033. The recovering sales of the light commercial vehicle segment are also anticipated to increase the market for railway horn revenue contribution.

The factors driving this region's market are the rising demand for railway horns and the increasingly stringent regulations for both driver and pedestrian safety.

North America Insights

Over the forecast period, the North American railway horn system market is anticipated to grow at the fastest CAGR. In North America, it is anticipated that as sales of vehicles with electric horns increase, the railway horn market may expand.

How may the USA Perform in the Global Railway Horn Market Landscape?

Demand for railway horns is likely to rise as a result of increased production and an uptick in vehicle sales in the area. As sales of hybrid and electric vehicles increase, the market for railway horns is anticipated to expand in the USA. The USA railway horn system market is anticipated to have a market share of 19% for the assessment period.

The railway horn market is expected to contribute even more to revenue as light commercial vehicle sales begin to recover.

How is the Market Progressing in Canada?

Due to the growing use of horns, which reduce noise pollution, Canada is predicted to experience strong market growth. It is anticipated that the sales of passenger and light commercial railways may increase demand for railway horns in the area. The rapidly altering dynamics of the automotive industries are predicted to drive the market.

The market for railway horns in Latin America is anticipated to grow at a relatively moderate rate through 2018 before returning to steady growth over the course of the forecast period.

How is the Start-up Ecosystem in the Railway Horn Market?

By involving start-ups and other organizations, Indian Railways has undertaken a significant innovation initiative. Startups for Railways, a policy aimed at bringing scale and efficiency in the field of operation, maintenance, and infrastructure creation through the participation of a very large and untapped startup ecosystem, was introduced on Monday by Ashwini Vaishnaw, Minister of Railways, Communications, Electronics & Information Technology.

Amount up to 1.5 crores may be given to the innovator on an equal sharing basis with the option of milestone payments.
How Competition Influences the Market?

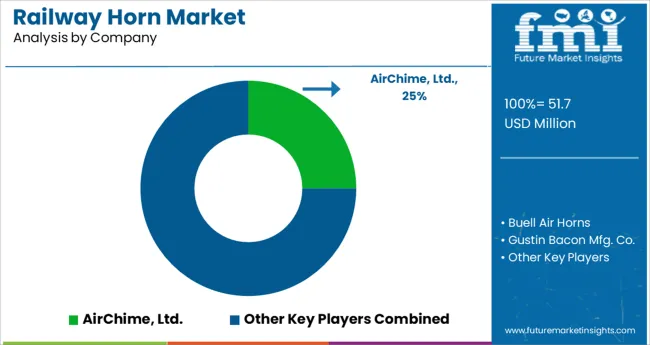
Many domestic players participate in the domestic supply dynamics of the market for railway horns. The market for railway horns is regionally fragmented.

Recent Development:

  • Loan:

DENSO and Sumitomo Mitsui Banking Corporation, or SMBC, have agreed to terms for INR. 400 crore Sustainability loan. In accordance with our voluntary and predetermined sustainability performance objectives, DENSO and SMBC have entered into an agreement for a sustainability-linked loan for the working capital needs of three Indian DENSO Corporation subsidiaries.

  • Expansion:

Leading technology and service provider Bosch is expanding its AIoT operations in India by converting its headquarters in Adugodi, Bengaluru, into a new smart campus called Spark.NXT.

Bosch has spent INR 800 crores over the past five years building the campus, which has the ability to house 10,000 associates. The 76-acre location is Bosch's first smart campus in India and offers a variety of smart solutions based on security, sustainability, and user experience for staff members, guests, and facility management.

  • Introduction:

The founding of AirChime, Ltd. can be traced back to Robert Swanson's work in 1949. Swanson aimed to create an air horn that would sound like a traditional steam whistle. Swanson created the six-note model H6 based on prehistoric Chinese musical theory.

Through the removal of pointless moving components, AirChime considerably enhanced the earlier horns with the introduction of the M series in 1950. The Southern Railway, which needed new horns for its motive power, was one of AirChime M's first clients.

The AirChime model K3L has been sold to Nathan Manufacturing, Inc., a part of Micro Precision Group, Inc. in Windham, Connecticut. It is displayed here in a livery that is modeled after Auburn University.

  • Acquisition:

Armstrong International, a leader in the world of effective thermal energy solutions, recently announced the strategic acquisition of Leslie Controls, a producer of commercial pumps, water heaters, control systems, and steam regulators.

A large selection of control valves from Leslie may be included in the acquisition, with the exception of steam water heaters for the USA Marine Corps market. Armstrong's customer base and water heater product line may be expanded as a result of this strategic acquisition, which may also promote market expansion in the power and process sectors globally. In Q3 of 2021, the acquisition was finished.

  • Partnership:

The new WorldSBK 2022 Championship is to begin soon, and FIAMM Energy Technology S.p.A. reaffirms its commitment to Aruba. it Racing - Ducati Team as its primary sponsor.

The two companies have been working together as a team for the past five years. In fact, Aruba has decided to rely on FIAMM Reserve Solutions' expertise for the Data Center power continuity requirements.

Key Players

  • AirChime, Ltd.
  • Buell Air Horns
  • Gustin Bacon Mfg. Co.
  • Leslie Controls, Inc.
  • Prime Manufacturing, Inc.
  • Westinghouse Air Brake Co.

Key Segments

By Horn Type:

  • Air Horn
  • Electric Horn

By Design Type:

  • Flat
  • Spiral
  • Trumpet

By Region:

  • North America
  • Europe
  • Asia Pacific
  • Latin America

Frequently Asked Questions

How is the Railway Horn Market Growing?

The market is predicted to grow at CAGR of 4.3% during the forecast period.

Which Country Holds the Highest Share in the Market?

United States market holds the highest market share of 19.00%.

Which Country Holds the Highest CAGR in the Market for Railway Horn?

Indian market has the highest CAGR of 5.9% for the forecast period.

What is the Current Market Size ?

The market size is anticipated to be over US$ 45.3 Million in 2022.

What is the Future Scope of Growth for the Railway Horn Market?

The market is expected to surpass US$ 72.3 Million by 2033.

Table of Content

1. Executive Summary | Railway Horn Market

    1.1. Global Market Outlook

    1.2. Demand-side Trends

    1.3. Supply-side Trends

    1.4. Technology Roadmap Analysis

    1.5. Analysis and Recommendations

2. Market Overview

    2.1. Market Coverage / Taxonomy

    2.2. Market Definition / Scope / Limitations

3. Market Background

    3.1. Market Dynamics

        3.1.1. Drivers

        3.1.2. Restraints

        3.1.3. Opportunity

        3.1.4. Trends

    3.2. Scenario Forecast

        3.2.1. Demand in Optimistic Scenario

        3.2.2. Demand in Likely Scenario

        3.2.3. Demand in Conservative Scenario

    3.3. Opportunity Map Analysis

    3.4. Investment Feasibility Matrix

    3.5. PESTLE and Porter’s Analysis

    3.6. Regulatory Landscape

        3.6.1. By Key Regions

        3.6.2. By Key Countries

    3.7. Regional Parent Market Outlook

4. Global Market Analysis 2018 to 2022 and Forecast, 2023 to 2033

    4.1. Historical Market Size Value (US$ Million) Analysis, 2018 to 2022

    4.2. Current and Future Market Size Value (US$ Million) Projections, 2023 to 2033

        4.2.1. Y-o-Y Growth Trend Analysis

        4.2.2. Absolute $ Opportunity Analysis

5. Global Market Analysis 2018 to 2022 and Forecast 2023 to 2033, By Train Types

    5.1. Introduction / Key Findings

    5.2. Historical Market Size Value (US$ Million) Analysis By Train Types, 2018 to 2022

    5.3. Current and Future Market Size Value (US$ Million) Analysis and Forecast By Train Types, 2023 to 2033

        5.3.1. Passenger Trains

            5.3.1.1. Long-Distance Trains

            5.3.1.2. High-Speed Rail

            5.3.1.3. Inter-City Trains

            5.3.1.4. Regional Trains

            5.3.1.5. Short-Distance Trains

            5.3.1.6. Commuter Trains

        5.3.2. Within City Trains

            5.3.2.1. Rapid Transit Trains

            5.3.2.2. Tram

            5.3.2.3. Light Rail

            5.3.2.4. Monorail

            5.3.2.5. Maglev

            5.3.2.6. Railcar

            5.3.2.7. Named Trains

            5.3.2.8. Automated People Mover (APM) Trains

        5.3.3. Freight Trains

    5.4. Y-o-Y Growth Trend Analysis By Train Types, 2018 to 2022

    5.5. Absolute $ Opportunity Analysis By Train Types, 2023 to 2033

6. Global Market Analysis 2018 to 2022 and Forecast 2023 to 2033, By Horn System Types

    6.1. Introduction / Key Findings

    6.2. Historical Market Size Value (US$ Million) Analysis By Horn System Types, 2018 to 2022

    6.3. Current and Future Market Size Value (US$ Million) Analysis and Forecast By Horn System Types, 2023 to 2033

        6.3.1. Three Chime Horn Systems

        6.3.2. Five Chime Horn Systems

    6.4. Y-o-Y Growth Trend Analysis By Horn System Types, 2018 to 2022

    6.5. Absolute $ Opportunity Analysis By Horn System Types, 2023 to 2033

7. Global Market Analysis 2018 to 2022 and Forecast 2023 to 2033, By Region

    7.1. Introduction

    7.2. Historical Market Size Value (US$ Million) Analysis By Region, 2018 to 2022

    7.3. Current Market Size Value (US$ Million) Analysis and Forecast By Region, 2023 to 2033

        7.3.1. North America

        7.3.2. Latin America

        7.3.3. Europe

        7.3.4. South Asia

        7.3.5. East Asia

        7.3.6. Oceania

        7.3.7. Middle East and Africa (MEA)

    7.4. Market Attractiveness Analysis By Region

8. North America Market Analysis 2018 to 2022 and Forecast 2023 to 2033, By Country

    8.1. Historical Market Size Value (US$ Million) Trend Analysis By Market Taxonomy, 2018 to 2022

    8.2. Market Size Value (US$ Million) Forecast By Market Taxonomy, 2023 to 2033

        8.2.1. By Country

            8.2.1.1. United States of America

            8.2.1.2. Canada

        8.2.2. By Train Types

        8.2.3. By Horn System Types

    8.3. Market Attractiveness Analysis

        8.3.1. By Country

        8.3.2. By Train Types

        8.3.3. By Horn System Types

    8.4. Key Takeaways

9. Latin America Market Analysis 2018 to 2022 and Forecast 2023 to 2033, By Country

    9.1. Historical Market Size Value (US$ Million) Trend Analysis By Market Taxonomy, 2018 to 2022

    9.2. Market Size Value (US$ Million) Forecast By Market Taxonomy, 2023 to 2033

        9.2.1. By Country

            9.2.1.1. Brazil

            9.2.1.2. Mexico

            9.2.1.3. Rest of Latin America

        9.2.2. By Train Types

        9.2.3. By Horn System Types

    9.3. Market Attractiveness Analysis

        9.3.1. By Country

        9.3.2. By Train Types

        9.3.3. By Horn System Types

    9.4. Key Takeaways

10. Europe Market Analysis 2018 to 2022 and Forecast 2023 to 2033, By Country

    10.1. Historical Market Size Value (US$ Million) Trend Analysis By Market Taxonomy, 2018 to 2022

    10.2. Market Size Value (US$ Million) Forecast By Market Taxonomy, 2023 to 2033

        10.2.1. By Country

            10.2.1.1. Germany

            10.2.1.2. United Kingdom

            10.2.1.3. France

            10.2.1.4. Spain

            10.2.1.5. Italy

            10.2.1.6. Rest of Europe

        10.2.2. By Train Types

        10.2.3. By Horn System Types

    10.3. Market Attractiveness Analysis

        10.3.1. By Country

        10.3.2. By Train Types

        10.3.3. By Horn System Types

    10.4. Key Takeaways

11. South Asia Market Analysis 2018 to 2022 and Forecast 2023 to 2033, By Country

    11.1. Historical Market Size Value (US$ Million) Trend Analysis By Market Taxonomy, 2018 to 2022

    11.2. Market Size Value (US$ Million) Forecast By Market Taxonomy, 2023 to 2033

        11.2.1. By Country

            11.2.1.1. India

            11.2.1.2. Malaysia

            11.2.1.3. Singapore

            11.2.1.4. Thailand

            11.2.1.5. Rest of South Asia

        11.2.2. By Train Types

        11.2.3. By Horn System Types

    11.3. Market Attractiveness Analysis

        11.3.1. By Country

        11.3.2. By Train Types

        11.3.3. By Horn System Types

    11.4. Key Takeaways

12. East Asia Market Analysis 2018 to 2022 and Forecast 2023 to 2033, By Country

    12.1. Historical Market Size Value (US$ Million) Trend Analysis By Market Taxonomy, 2018 to 2022

    12.2. Market Size Value (US$ Million) Forecast By Market Taxonomy, 2023 to 2033

        12.2.1. By Country

            12.2.1.1. China

            12.2.1.2. Japan

            12.2.1.3. South Korea

        12.2.2. By Train Types

        12.2.3. By Horn System Types

    12.3. Market Attractiveness Analysis

        12.3.1. By Country

        12.3.2. By Train Types

        12.3.3. By Horn System Types

    12.4. Key Takeaways

13. Oceania Market Analysis 2018 to 2022 and Forecast 2023 to 2033, By Country

    13.1. Historical Market Size Value (US$ Million) Trend Analysis By Market Taxonomy, 2018 to 2022

    13.2. Market Size Value (US$ Million) Forecast By Market Taxonomy, 2023 to 2033

        13.2.1. By Country

            13.2.1.1. Australia

            13.2.1.2. New Zealand

        13.2.2. By Train Types

        13.2.3. By Horn System Types

    13.3. Market Attractiveness Analysis

        13.3.1. By Country

        13.3.2. By Train Types

        13.3.3. By Horn System Types

    13.4. Key Takeaways

14. MEA Market Analysis 2018 to 2022 and Forecast 2023 to 2033, By Country

    14.1. Historical Market Size Value (US$ Million) Trend Analysis By Market Taxonomy, 2018 to 2022

    14.2. Market Size Value (US$ Million) Forecast By Market Taxonomy, 2023 to 2033

        14.2.1. By Country

            14.2.1.1. GCC Countries

            14.2.1.2. South Africa

            14.2.1.3. Israel

            14.2.1.4. Rest of MEA

        14.2.2. By Train Types

        14.2.3. By Horn System Types

    14.3. Market Attractiveness Analysis

        14.3.1. By Country

        14.3.2. By Train Types

        14.3.3. By Horn System Types

    14.4. Key Takeaways

15. Key Countries Market Analysis

    15.1. United States of America

        15.1.1. Pricing Analysis

        15.1.2. Market Share Analysis, 2022

            15.1.2.1. By Train Types

            15.1.2.2. By Horn System Types

    15.2. Canada

        15.2.1. Pricing Analysis

        15.2.2. Market Share Analysis, 2022

            15.2.2.1. By Train Types

            15.2.2.2. By Horn System Types

    15.3. Brazil

        15.3.1. Pricing Analysis

        15.3.2. Market Share Analysis, 2022

            15.3.2.1. By Train Types

            15.3.2.2. By Horn System Types

    15.4. Mexico

        15.4.1. Pricing Analysis

        15.4.2. Market Share Analysis, 2022

            15.4.2.1. By Train Types

            15.4.2.2. By Horn System Types

    15.5. Germany

        15.5.1. Pricing Analysis

        15.5.2. Market Share Analysis, 2022

            15.5.2.1. By Train Types

            15.5.2.2. By Horn System Types

    15.6. United Kingdom

        15.6.1. Pricing Analysis

        15.6.2. Market Share Analysis, 2022

            15.6.2.1. By Train Types

            15.6.2.2. By Horn System Types

    15.7. France

        15.7.1. Pricing Analysis

        15.7.2. Market Share Analysis, 2022

            15.7.2.1. By Train Types

            15.7.2.2. By Horn System Types

    15.8. Spain

        15.8.1. Pricing Analysis

        15.8.2. Market Share Analysis, 2022

            15.8.2.1. By Train Types

            15.8.2.2. By Horn System Types

    15.9. Italy

        15.9.1. Pricing Analysis

        15.9.2. Market Share Analysis, 2022

            15.9.2.1. By Train Types

            15.9.2.2. By Horn System Types

    15.10. India

        15.10.1. Pricing Analysis

        15.10.2. Market Share Analysis, 2022

            15.10.2.1. By Train Types

            15.10.2.2. By Horn System Types

    15.11. Malaysia

        15.11.1. Pricing Analysis

        15.11.2. Market Share Analysis, 2022

            15.11.2.1. By Train Types

            15.11.2.2. By Horn System Types

    15.12. Singapore

        15.12.1. Pricing Analysis

        15.12.2. Market Share Analysis, 2022

            15.12.2.1. By Train Types

            15.12.2.2. By Horn System Types

    15.13. Thailand

        15.13.1. Pricing Analysis

        15.13.2. Market Share Analysis, 2022

            15.13.2.1. By Train Types

            15.13.2.2. By Horn System Types

    15.14. China

        15.14.1. Pricing Analysis

        15.14.2. Market Share Analysis, 2022

            15.14.2.1. By Train Types

            15.14.2.2. By Horn System Types

    15.15. Japan

        15.15.1. Pricing Analysis

        15.15.2. Market Share Analysis, 2022

            15.15.2.1. By Train Types

            15.15.2.2. By Horn System Types

    15.16. South Korea

        15.16.1. Pricing Analysis

        15.16.2. Market Share Analysis, 2022

            15.16.2.1. By Train Types

            15.16.2.2. By Horn System Types

    15.17. Australia

        15.17.1. Pricing Analysis

        15.17.2. Market Share Analysis, 2022

            15.17.2.1. By Train Types

            15.17.2.2. By Horn System Types

    15.18. New Zealand

        15.18.1. Pricing Analysis

        15.18.2. Market Share Analysis, 2022

            15.18.2.1. By Train Types

            15.18.2.2. By Horn System Types

    15.19. GCC Countries

        15.19.1. Pricing Analysis

        15.19.2. Market Share Analysis, 2022

            15.19.2.1. By Train Types

            15.19.2.2. By Horn System Types

    15.20. South Africa

        15.20.1. Pricing Analysis

        15.20.2. Market Share Analysis, 2022

            15.20.2.1. By Train Types

            15.20.2.2. By Horn System Types

    15.21. Israel

        15.21.1. Pricing Analysis

        15.21.2. Market Share Analysis, 2022

            15.21.2.1. By Train Types

            15.21.2.2. By Horn System Types

16. Market Structure Analysis

    16.1. Competition Dashboard

    16.2. Competition Benchmarking

    16.3. Market Share Analysis of Top Players

        16.3.1. By Regional

        16.3.2. By Train Types

        16.3.3. By Horn System Types

17. Competition Analysis

    17.1. Competition Deep Dive

        17.1.1. AirChime, Ltd.

            17.1.1.1. Overview

            17.1.1.2. Product Portfolio

            17.1.1.3. Profitability by Market Segments

            17.1.1.4. Sales Footprint

            17.1.1.5. Strategy Overview

                17.1.1.5.1. Marketing Strategy

        17.1.2. Buell Air Horns.

            17.1.2.1. Overview

            17.1.2.2. Product Portfolio

            17.1.2.3. Profitability by Market Segments

            17.1.2.4. Sales Footprint

            17.1.2.5. Strategy Overview

                17.1.2.5.1. Marketing Strategy

        17.1.3. Gustin Bacon Mfg. Co.

            17.1.3.1. Overview

            17.1.3.2. Product Portfolio

            17.1.3.3. Profitability by Market Segments

            17.1.3.4. Sales Footprint

            17.1.3.5. Strategy Overview

                17.1.3.5.1. Marketing Strategy

        17.1.4. Leslie Controls, Inc.

            17.1.4.1. Overview

            17.1.4.2. Product Portfolio

            17.1.4.3. Profitability by Market Segments

            17.1.4.4. Sales Footprint

            17.1.4.5. Strategy Overview

                17.1.4.5.1. Marketing Strategy

        17.1.5. Prime Manufacturing, Inc.

            17.1.5.1. Overview

            17.1.5.2. Product Portfolio

            17.1.5.3. Profitability by Market Segments

            17.1.5.4. Sales Footprint

            17.1.5.5. Strategy Overview

                17.1.5.5.1. Marketing Strategy

        17.1.6. Westinghouse Air Brake Co.

            17.1.6.1. Overview

            17.1.6.2. Product Portfolio

            17.1.6.3. Profitability by Market Segments

            17.1.6.4. Sales Footprint

            17.1.6.5. Strategy Overview

                17.1.6.5.1. Marketing Strategy

        17.1.7. Denso Corporation

            17.1.7.1. Overview

            17.1.7.2. Product Portfolio

            17.1.7.3. Profitability by Market Segments

            17.1.7.4. Sales Footprint

            17.1.7.5. Strategy Overview

                17.1.7.5.1. Marketing Strategy

        17.1.8. Wolo Manufacturing Corp.

            17.1.8.1. Overview

            17.1.8.2. Product Portfolio

            17.1.8.3. Profitability by Market Segments

            17.1.8.4. Sales Footprint

            17.1.8.5. Strategy Overview

                17.1.8.5.1. Marketing Strategy

        17.1.9. Imasen Electric Industrial Co., Ltd.

            17.1.9.1. Overview

            17.1.9.2. Product Portfolio

            17.1.9.3. Profitability by Market Segments

            17.1.9.4. Sales Footprint

            17.1.9.5. Strategy Overview

                17.1.9.5.1. Marketing Strategy

        17.1.10. MARUKO KEIHOKI Co., LTD.

            17.1.10.1. Overview

            17.1.10.2. Product Portfolio

            17.1.10.3. Profitability by Market Segments

            17.1.10.4. Sales Footprint

            17.1.10.5. Strategy Overview

                17.1.10.5.1. Marketing Strategy

18. Assumptions & Acronyms Used

19. Research Methodology

List of Tables

Table 1: Global Market Value (US$ Million) Forecast by Region, 2018 to 2033

Table 2: Global Market Value (US$ Million) Forecast by Train Types, 2018 to 2033

Table 3: Global Market Value (US$ Million) Forecast by Horn System Types, 2018 to 2033

Table 4: North America Market Value (US$ Million) Forecast by Country, 2018 to 2033

Table 5: North America Market Value (US$ Million) Forecast by Train Types, 2018 to 2033

Table 6: North America Market Value (US$ Million) Forecast by Horn System Types, 2018 to 2033

Table 7: Latin America Market Value (US$ Million) Forecast by Country, 2018 to 2033

Table 8: Latin America Market Value (US$ Million) Forecast by Train Types, 2018 to 2033

Table 9: Latin America Market Value (US$ Million) Forecast by Horn System Types, 2018 to 2033

Table 10: Europe Market Value (US$ Million) Forecast by Country, 2018 to 2033

Table 11: Europe Market Value (US$ Million) Forecast by Train Types, 2018 to 2033

Table 12: Europe Market Value (US$ Million) Forecast by Horn System Types, 2018 to 2033

Table 13: South Asia Market Value (US$ Million) Forecast by Country, 2018 to 2033

Table 14: South Asia Market Value (US$ Million) Forecast by Train Types, 2018 to 2033

Table 15: South Asia Market Value (US$ Million) Forecast by Horn System Types, 2018 to 2033

Table 16: East Asia Market Value (US$ Million) Forecast by Country, 2018 to 2033

Table 17: East Asia Market Value (US$ Million) Forecast by Train Types, 2018 to 2033

Table 18: East Asia Market Value (US$ Million) Forecast by Horn System Types, 2018 to 2033

Table 19: Oceania Market Value (US$ Million) Forecast by Country, 2018 to 2033

Table 20: Oceania Market Value (US$ Million) Forecast by Train Types, 2018 to 2033

Table 21: Oceania Market Value (US$ Million) Forecast by Horn System Types, 2018 to 2033

Table 22: MEA Market Value (US$ Million) Forecast by Country, 2018 to 2033

Table 23: MEA Market Value (US$ Million) Forecast by Train Types, 2018 to 2033

Table 24: MEA Market Value (US$ Million) Forecast by Horn System Types, 2018 to 2033

List of Charts

Figure 1: Global Market Value (US$ Million) by Train Types, 2023 to 2033

Figure 2: Global Market Value (US$ Million) by Horn System Types, 2023 to 2033

Figure 3: Global Market Value (US$ Million) by Region, 2023 to 2033

Figure 4: Global Market Value (US$ Million) Analysis by Region, 2018 to 2033

Figure 5: Global Market Value Share (%) and BPS Analysis by Region, 2023 to 2033

Figure 6: Global Market Y-o-Y Growth (%) Projections by Region, 2023 to 2033

Figure 7: Global Market Value (US$ Million) Analysis by Train Types, 2018 to 2033

Figure 8: Global Market Value Share (%) and BPS Analysis by Train Types, 2023 to 2033

Figure 9: Global Market Y-o-Y Growth (%) Projections by Train Types, 2023 to 2033

Figure 10: Global Market Value (US$ Million) Analysis by Horn System Types, 2018 to 2033

Figure 11: Global Market Value Share (%) and BPS Analysis by Horn System Types, 2023 to 2033

Figure 12: Global Market Y-o-Y Growth (%) Projections by Horn System Types, 2023 to 2033

Figure 13: Global Market Attractiveness by Train Types, 2023 to 2033

Figure 14: Global Market Attractiveness by Horn System Types, 2023 to 2033

Figure 15: Global Market Attractiveness by Region, 2023 to 2033

Figure 16: North America Market Value (US$ Million) by Train Types, 2023 to 2033

Figure 17: North America Market Value (US$ Million) by Horn System Types, 2023 to 2033

Figure 18: North America Market Value (US$ Million) by Country, 2023 to 2033

Figure 19: North America Market Value (US$ Million) Analysis by Country, 2018 to 2033

Figure 20: North America Market Value Share (%) and BPS Analysis by Country, 2023 to 2033

Figure 21: North America Market Y-o-Y Growth (%) Projections by Country, 2023 to 2033

Figure 22: North America Market Value (US$ Million) Analysis by Train Types, 2018 to 2033

Figure 23: North America Market Value Share (%) and BPS Analysis by Train Types, 2023 to 2033

Figure 24: North America Market Y-o-Y Growth (%) Projections by Train Types, 2023 to 2033

Figure 25: North America Market Value (US$ Million) Analysis by Horn System Types, 2018 to 2033

Figure 26: North America Market Value Share (%) and BPS Analysis by Horn System Types, 2023 to 2033

Figure 27: North America Market Y-o-Y Growth (%) Projections by Horn System Types, 2023 to 2033

Figure 28: North America Market Attractiveness by Train Types, 2023 to 2033

Figure 29: North America Market Attractiveness by Horn System Types, 2023 to 2033

Figure 30: North America Market Attractiveness by Country, 2023 to 2033

Figure 31: Latin America Market Value (US$ Million) by Train Types, 2023 to 2033

Figure 32: Latin America Market Value (US$ Million) by Horn System Types, 2023 to 2033

Figure 33: Latin America Market Value (US$ Million) by Country, 2023 to 2033

Figure 34: Latin America Market Value (US$ Million) Analysis by Country, 2018 to 2033

Figure 35: Latin America Market Value Share (%) and BPS Analysis by Country, 2023 to 2033

Figure 36: Latin America Market Y-o-Y Growth (%) Projections by Country, 2023 to 2033

Figure 37: Latin America Market Value (US$ Million) Analysis by Train Types, 2018 to 2033

Figure 38: Latin America Market Value Share (%) and BPS Analysis by Train Types, 2023 to 2033

Figure 39: Latin America Market Y-o-Y Growth (%) Projections by Train Types, 2023 to 2033

Figure 40: Latin America Market Value (US$ Million) Analysis by Horn System Types, 2018 to 2033

Figure 41: Latin America Market Value Share (%) and BPS Analysis by Horn System Types, 2023 to 2033

Figure 42: Latin America Market Y-o-Y Growth (%) Projections by Horn System Types, 2023 to 2033

Figure 43: Latin America Market Attractiveness by Train Types, 2023 to 2033

Figure 44: Latin America Market Attractiveness by Horn System Types, 2023 to 2033

Figure 45: Latin America Market Attractiveness by Country, 2023 to 2033

Figure 46: Europe Market Value (US$ Million) by Train Types, 2023 to 2033

Figure 47: Europe Market Value (US$ Million) by Horn System Types, 2023 to 2033

Figure 48: Europe Market Value (US$ Million) by Country, 2023 to 2033

Figure 49: Europe Market Value (US$ Million) Analysis by Country, 2018 to 2033

Figure 50: Europe Market Value Share (%) and BPS Analysis by Country, 2023 to 2033

Figure 51: Europe Market Y-o-Y Growth (%) Projections by Country, 2023 to 2033

Figure 52: Europe Market Value (US$ Million) Analysis by Train Types, 2018 to 2033

Figure 53: Europe Market Value Share (%) and BPS Analysis by Train Types, 2023 to 2033

Figure 54: Europe Market Y-o-Y Growth (%) Projections by Train Types, 2023 to 2033

Figure 55: Europe Market Value (US$ Million) Analysis by Horn System Types, 2018 to 2033

Figure 56: Europe Market Value Share (%) and BPS Analysis by Horn System Types, 2023 to 2033

Figure 57: Europe Market Y-o-Y Growth (%) Projections by Horn System Types, 2023 to 2033

Figure 58: Europe Market Attractiveness by Train Types, 2023 to 2033

Figure 59: Europe Market Attractiveness by Horn System Types, 2023 to 2033

Figure 60: Europe Market Attractiveness by Country, 2023 to 2033

Figure 61: South Asia Market Value (US$ Million) by Train Types, 2023 to 2033

Figure 62: South Asia Market Value (US$ Million) by Horn System Types, 2023 to 2033

Figure 63: South Asia Market Value (US$ Million) by Country, 2023 to 2033

Figure 64: South Asia Market Value (US$ Million) Analysis by Country, 2018 to 2033

Figure 65: South Asia Market Value Share (%) and BPS Analysis by Country, 2023 to 2033

Figure 66: South Asia Market Y-o-Y Growth (%) Projections by Country, 2023 to 2033

Figure 67: South Asia Market Value (US$ Million) Analysis by Train Types, 2018 to 2033

Figure 68: South Asia Market Value Share (%) and BPS Analysis by Train Types, 2023 to 2033

Figure 69: South Asia Market Y-o-Y Growth (%) Projections by Train Types, 2023 to 2033

Figure 70: South Asia Market Value (US$ Million) Analysis by Horn System Types, 2018 to 2033

Figure 71: South Asia Market Value Share (%) and BPS Analysis by Horn System Types, 2023 to 2033

Figure 72: South Asia Market Y-o-Y Growth (%) Projections by Horn System Types, 2023 to 2033

Figure 73: South Asia Market Attractiveness by Train Types, 2023 to 2033

Figure 74: South Asia Market Attractiveness by Horn System Types, 2023 to 2033

Figure 75: South Asia Market Attractiveness by Country, 2023 to 2033

Figure 76: East Asia Market Value (US$ Million) by Train Types, 2023 to 2033

Figure 77: East Asia Market Value (US$ Million) by Horn System Types, 2023 to 2033

Figure 78: East Asia Market Value (US$ Million) by Country, 2023 to 2033

Figure 79: East Asia Market Value (US$ Million) Analysis by Country, 2018 to 2033

Figure 80: East Asia Market Value Share (%) and BPS Analysis by Country, 2023 to 2033

Figure 81: East Asia Market Y-o-Y Growth (%) Projections by Country, 2023 to 2033

Figure 82: East Asia Market Value (US$ Million) Analysis by Train Types, 2018 to 2033

Figure 83: East Asia Market Value Share (%) and BPS Analysis by Train Types, 2023 to 2033

Figure 84: East Asia Market Y-o-Y Growth (%) Projections by Train Types, 2023 to 2033

Figure 85: East Asia Market Value (US$ Million) Analysis by Horn System Types, 2018 to 2033

Figure 86: East Asia Market Value Share (%) and BPS Analysis by Horn System Types, 2023 to 2033

Figure 87: East Asia Market Y-o-Y Growth (%) Projections by Horn System Types, 2023 to 2033

Figure 88: East Asia Market Attractiveness by Train Types, 2023 to 2033

Figure 89: East Asia Market Attractiveness by Horn System Types, 2023 to 2033

Figure 90: East Asia Market Attractiveness by Country, 2023 to 2033

Figure 91: Oceania Market Value (US$ Million) by Train Types, 2023 to 2033

Figure 92: Oceania Market Value (US$ Million) by Horn System Types, 2023 to 2033

Figure 93: Oceania Market Value (US$ Million) by Country, 2023 to 2033

Figure 94: Oceania Market Value (US$ Million) Analysis by Country, 2018 to 2033

Figure 95: Oceania Market Value Share (%) and BPS Analysis by Country, 2023 to 2033

Figure 96: Oceania Market Y-o-Y Growth (%) Projections by Country, 2023 to 2033

Figure 97: Oceania Market Value (US$ Million) Analysis by Train Types, 2018 to 2033

Figure 98: Oceania Market Value Share (%) and BPS Analysis by Train Types, 2023 to 2033

Figure 99: Oceania Market Y-o-Y Growth (%) Projections by Train Types, 2023 to 2033

Figure 100: Oceania Market Value (US$ Million) Analysis by Horn System Types, 2018 to 2033

Figure 101: Oceania Market Value Share (%) and BPS Analysis by Horn System Types, 2023 to 2033

Figure 102: Oceania Market Y-o-Y Growth (%) Projections by Horn System Types, 2023 to 2033

Figure 103: Oceania Market Attractiveness by Train Types, 2023 to 2033

Figure 104: Oceania Market Attractiveness by Horn System Types, 2023 to 2033

Figure 105: Oceania Market Attractiveness by Country, 2023 to 2033

Figure 106: MEA Market Value (US$ Million) by Train Types, 2023 to 2033

Figure 107: MEA Market Value (US$ Million) by Horn System Types, 2023 to 2033

Figure 108: MEA Market Value (US$ Million) by Country, 2023 to 2033

Figure 109: MEA Market Value (US$ Million) Analysis by Country, 2018 to 2033

Figure 110: MEA Market Value Share (%) and BPS Analysis by Country, 2023 to 2033

Figure 111: MEA Market Y-o-Y Growth (%) Projections by Country, 2023 to 2033

Figure 112: MEA Market Value (US$ Million) Analysis by Train Types, 2018 to 2033

Figure 113: MEA Market Value Share (%) and BPS Analysis by Train Types, 2023 to 2033

Figure 114: MEA Market Y-o-Y Growth (%) Projections by Train Types, 2023 to 2033

Figure 115: MEA Market Value (US$ Million) Analysis by Horn System Types, 2018 to 2033

Figure 116: MEA Market Value Share (%) and BPS Analysis by Horn System Types, 2023 to 2033

Figure 117: MEA Market Y-o-Y Growth (%) Projections by Horn System Types, 2023 to 2033

Figure 118: MEA Market Attractiveness by Train Types, 2023 to 2033

Figure 119: MEA Market Attractiveness by Horn System Types, 2023 to 2033

Figure 120: MEA Market Attractiveness by Country, 2023 to 2033

Recommendations

Automotive

Electric Motor Horn Market

Published : August 2023

Automotive

Bus Bellows Market

Published : November 2022

Explore Automotive Insights

View Reports