Reports

- Global Locations -

Headquarters

Future Market Insights, Inc.

Christiana Corporate, 200
Continental Drive, Suite 401,
Newark, Delaware - 19713,
United States

T: +1-845-579-5705

Americas

Future Market Insights, Inc.

616 Corporate Way, Suite 2-9018,
Valley Cottage, NY 10989, United States

T: +1-347-918-3531

MEA

Future Market Insights

1602-6 Jumeirah Bay X2 Tower, Plot No: JLT-PH2-X2A,
Jumeirah Lakes Towers, Dubai,
United Arab Emirates

Europe

Future Market Insights

3rd Floor, 207 Regent Street,
W1B 3HH London
United Kingdom

T: + 44 (0) 20 8123 9659
D: +44 (0) 20 3287 4268

Asia Pacific

Future Market Insights

IndiaLand Global Tech Park, Unit UG-1, Behind Grand HighStreet, Phase 1, Hinjawadi, MH, Pune – 411057, India

Global Railway Telematics Market Outlook (2023 to 2033)

The size of the railway telematics market in terms of value was estimated at approximately US$ 6,234.5 Million in 2022. As per the market analysis report released by FMI, it is anticipated to register a CAGR of 7.1% from 2023 to 2033. This promising growth rate is expected to take the overall value of the market from US$ 6,708.3 Million in 2023 to US$ 13,320.1 Million by 2033.

The growing demand for railway telematics is expected to be aided by the spike in demand for a reliable, secure, and economical transportation system. Because of improved telematics technology, advanced transportation systems have become less likely to encounter any trouble, attracting government attention around the world.

Railway telematics services have also become important for modern fleet owners as they relate to railcar safety and other issues with much priority. For instance, Trinsight is a digital unified platform or app for real-time solutions including location finding, condition recognition, as well as status detection of the railcars and components. It was introduced by Trinity Rail Group in February 2021 to improve fleet operations' safety, effectiveness, and management.

In light of the many recent advances made in the field of location tracking and predictive maintenance of railcars, the adoption of railway telematics is expected to increase. Moreover, with the growing volume of cargo deliveries across emerging economies, the demand for railway telematics by the logistics industry for freight transportation is expected to increase exponentially in the coming days.

Unfortunately, global trade limitations along with the pandemic shutdown also impeded market expansion for a brief period of time in the recent past. These impediments dropped the railway telematics market growth significantly from 4.6% recorded during the years following 2018. However, the market has revived again after the realization of the product's utility during lockdown time.

Attributes Details
Railway Telematics Market Share (2022) US$ 6,234.5Million
Railway Telematics Market Size Value (2023) US$ 6,708.3Million
Railway Telematics Market Size Value (2033) US$ 13,320.1Million
Railway Telematics Market Growth Rate (2023 to 2033) 7.1%

Don't pay for what you don't need

Customize your report by selecting specific countries or regions and save 30%!

What are the Driving Factors for the Global Railway Telematics Market in the Forecast Years?

The market is benefiting from increased budgetary support for the construction of railroads and the growing need for safer, more secure, and more effective transportation networks in emerging economies. Worldwide urbanization is also progressing at a promising rate, which is enabling smart cities to adopt all types of modern technology for the up gradation of the transport system. A few of the other major reasons projected to propel the development of railway telematics are the rising need for the digitization of railcar monitoring and the expansion of telecommunication network connectivity in 3rd world economies.

Category-wise Insights

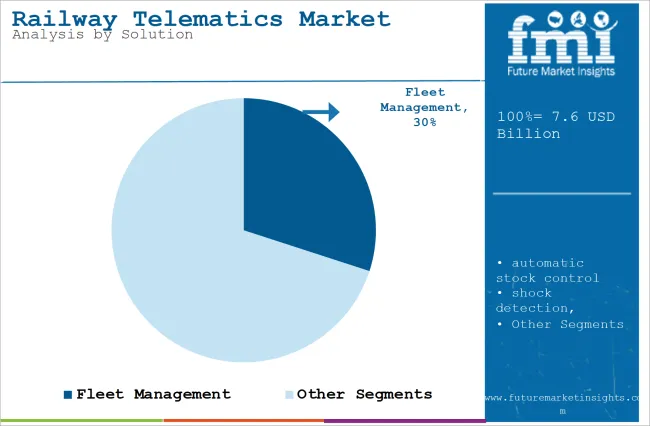
In contemporary times, the market is dominated by the fleet management sector, which represented even more than 30% of the profit share generated globally. Further again, the railcar tracking and tracing market segment are predicted to grow at a higher rate of 8.2% from 2023 to 2033. This surge in demand for the segment can be correlated with a rise in demand for freight wagon preventive analytics to spot operational problems.

Control Units Still Remain the Crucial Component for the Success of Railway Telematics

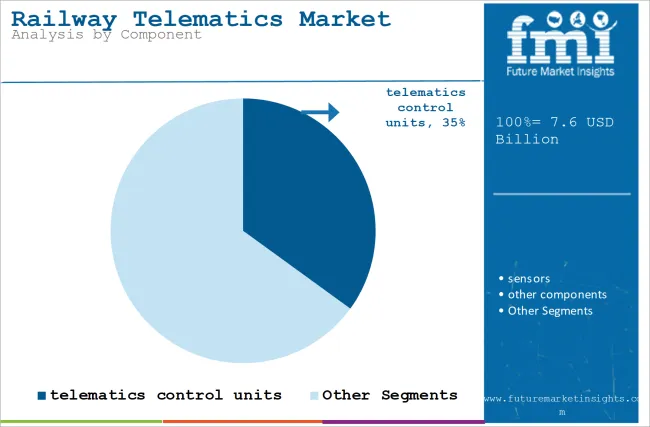
According to the previous records, more than 50% of the total market was accounted for by the telematics control unit category. Solutions for both railcar two-way management and surveillance are provided by telematics control units. Advanced TCUs are already being used in railcars, resulting in improvements in upkeep, safety, and economics.

However, over the projection period, the sensors component segment is expected to register the highest CAGR of 8.5% than its counterparts. The increase in government efforts and funding for the creation of smart railway networks could be credited to the growth of this sector in the last few years.

The Refrigerated Railcars are Getting more attention from the Railway Telematics Market Players

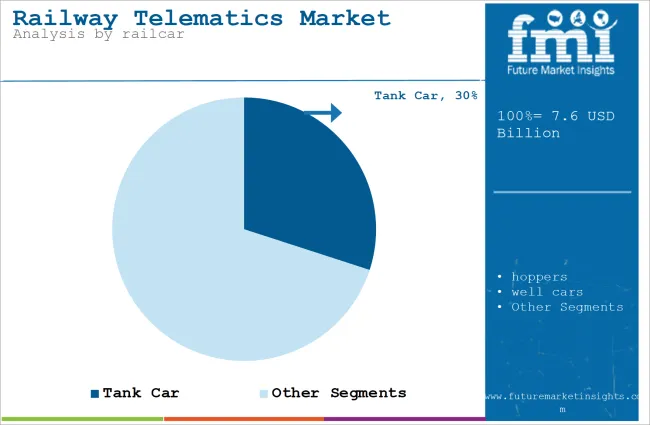
Until the year 2022, the hoppers railcar category dominated with a revenue share of more than 23%. Further, during Over through the projected period, it is expected that this category would acquire a lot of traction and maintain its position. The trend for hopper railcars is anticipated to be driven by the increasing need for containers to be transported and tracked across numerous logistics and freight service companies.

Contrarily, from 2023 to 2033, the refrigerated boxcars market segment is anticipated to grow at the highest Growth rate of 8.5%. This category is expanding as a result of the rising need for an efficient transportation system for perishable goods. refrigerated boxcars are also now used in a number of other industries, including chemicals and pharmaceuticals.

Nikhil Kaitwade
Nikhil Kaitwade

Principal Consultant

Talk to Analyst

Find your sweet spots for generating winning opportunities in this market.

Comparative View of Adjacent Railway Telematics Market

Railway Telematics Market:

Attributes Railway Telematics Market
CAGR (2023 to 2033) 7.1%
Market Value (2023) US$ 6.7 Billion
Growth Factor The growing complexity of the freight management work.
Future Opportunities Stringent regulations for improved safety of railway transport
Market Trends Adoption of advanced digital technologies for better product performance.

Smart Railways Market:

Attributes Smart Railways Market
CAGR (2023 to 2033) 16.3%
Market Value (2023) US$ 27 Billion
Growth Factor Growth of passenger count in all major cities of the world.
Future Opportunities Increased spending on the establishment of smart cities.
Market Trends Long-term collaboration with service sector companies.

Railway Management System Market:

Attributes Railway Management System Market
CAGR (2023 to 2033) 10.5%
Market Value (2023) US$ 5 Billion
Growth Factor Growing requirement of real-time management.
Future Opportunities Integration of telecom services for active notification.
Market Trends Market players are offering wholesome and comprehensive solutions.

Country-wise Insights

United States of America Railway Telematics Market Players to Speed Up the Research and Development Spending to Remain Competitive

In 2022 and the preceding years, the highest market share belonged to the USA which contributes an average of 18.5% revenue every year, In the present year, 2023 it is estimated to generate a revenue of nearly US$ 1,241 Million as per available statistics.

Undoubtedly one of the key reasons for the leading position of the USA is the existence of many original equipment manufacturers in the country. Manufacturers like Robert Bosch, Amsted Digital, and others particularly are driving the growth of the railway telematics industry in the US.

Robert Bosch confirmed the conclusion of a supply agreement with Lineas Company in October 2020 in order to digitalize the latter's fleet of wagons. Bosch's famous Nexeed Track and Trace solution software is anticipated to be placed on 2,600 wagons as part of supply and inventory tracking for Linea's fleet optimization.

Germany to Lead the Business of Railway Telematics in Europe

As Germany is the leading economy compared to all other European countries, it has a higher requirement for freight train management software and solutions. Consequently, it uses railway telematics services amounting to almost US$ 315 Million every year.

On the other hand, sensing the huge gap in the adoption of this some key players have come together to bridge it in the near past. Aiming for the development of an automated rail coupling, DB Cargo led cooperation with five European firms in July 2020. Six businesses from Switzerland, Germany, Austria, and France received this project's grant from the German Federal Transport and Digital Facilities Department.

Japan Railway Telematics Market to Compete with China's Growing Influence

As per the Asia Pacific market survey figures, Japan contributes almost 5.2% of the overall market. In the present year 2023, it is estimated to generate a revenue of almost US$ 349 Million by adoption as well as outsourcing of telematics services. Some of the regional players such as Hitachi are now competing at the global level with their quality services and better products.

Hitachi Company stated in April 2021 that it will purchase Perpetuum Company of the UK in order to improve its digital railcar maintenance operations. In the worldwide railway telematics business, this organization is anticipated to introduce maintenance services for all OEMs and operators soon.

Meanwhile, China remains the major competing market for Japan which is growing at a faster rate than recorded before. As per the numbers obtained from the recent report, China is projected to witness a year-on-year growth rate of 4.3% over the forecast years.

India Market Gives a Promising Start for Railway Telematics Business

A life-size mock-up of the train set model for the Metro Line in Mumbai city, the commercial capital of India, was presented in November 2019 by Alstom and Mumbai Metro Rail Corporation (MMRC). The brand-new, recognizable, and original design for Mumbai Metro complies with all industrial and technological requirements including telematics services.

Such developments and ventures are anticipated to hasten the implementation of the Global Positioning System (GPS) and other telematics technologies for the Indian railway fleet during the forecast years. Accordingly, this market report pegs the annual average growth in demand for railway telematics at 5.4% for 2023 to 2033.

Get the data you need at a Fraction of the cost

Personalize your report by choosing insights you need
and save 40%!

Competitive Landscape

Smart and digital transportation solutions that make use of technology over expanding railcar networks are anticipated to be crucial to the success of the railway sector in the coming years. Many railway telematics service providers are now benefitting from new technologies like integrated services, asset management solutions, and predictive analytics algorithms.

Integration of autonomous stock control to assign ideal routes, timetables, and capacities, and procuring idle railcars in almost real-time is also at the development stage. Furthermore, shock detection and satellite communication are some of the futuristic endeavors that have attracted many new players into the market recently.

In recent years, many instances of multiple companies collaborating for expanding their services and acquiring a new customer base can be witnessed frequently in this sector. For illustration, important railway companies in the US like Norfolk Southern, GATX corporation, Trinity Rail, and Genesee & Wyoming, Watco announced in the year 2020 of entering into a joint venture called Rail Pulse.

Recent Developments By the Railway Telematics Industry Players

  • Wabtec introduced two new products in September 2019 that are intended for Modular Control Architecture - Fleet Migration (MCA FM), which is a modern replacement for the control systems now installed in all Wabtec locomotives. In order to equip railways for the transportation of the future with increased fuel efficiency and dependability, both systems incorporate higher-generation technology and solution capabilities.
  • ST 9100 is a dual-mode telematics device aimed at managing assets even at the most distant locations that were introduced by ORBCOMM Company in December 2020.

Key Players Profiled in the Railway Telematics Market Report

  • Siemens AG
  • Alstom SA
  • Knorr-Bremse AG
  • Robert Bosch GmbH
  • Hitachi Ltd.
  • Intermodal Telematics
  • Intrex Telematics
  • ORBCOMM
  • Railnova
  • Savvy Telematics
  • Trinity Industries

Key Segments

By Solution:

  • Fleet Management
  • Automatic Stock Control
  • Shock Detection
  • Remote data access
  • Railcar tracking and tracing
  • Reefer Wagon Management
  • ETA
  • others

By Railcar:

  • Hoppers
  • Tank cars
  • Well cars
  • Boxcars
  • Refrigerated Boxcars
  • Others

By Components:

  • TCU
  • Sensor
  • Others

By Train Type:

  • Passenger Train
  • Freight Train
  • Others

By Region:

  • North America
  • Latin America
  • Europe
  • East Asia
  • South Asia and the Pacific
  • Middle East and Africa (MEA)

Frequently Asked Questions

What is the Growth Outlook of the Railway Telematics Market?

The global railway telematics market is to grow at 7.1% during the forecast period.

What is the projected Value of Railway Telematics Market By 2033?

The global railway telematics market is predicted to be valued at US$ 13,320.1 Million by 2033.

What was the Historical Size of the Railway Telematics Market?

The global railway telematics market was valued at US$ 6,234.5 Million in 2022.

Which Country is the Dominant Share Holder in the Railway Telematics Market?

The USA accounts for the largest revenue share of US$ 1,241 Million in the year 2023.

Which Country has the Highest Growth Potential in the Railway Telematics Market?

India is predicted to witness the highest CAGR of 5.4% in the railway telematics market.

Table of Content

1. Executive Summary | Railway Telematics Market

    1.1. Global Market Outlook

    1.2. Demand-side Trends

    1.3. Supply-side Trends

    1.4. Technology Roadmap Analysis

    1.5. Analysis and Recommendations

2. Market Overview

    2.1. Market Coverage / Taxonomy

    2.2. Market Definition / Scope / Limitations

3. Market Background

    3.1. Market Dynamics

        3.1.1. Drivers

        3.1.2. Restraints

        3.1.3. Opportunity

        3.1.4. Trends

    3.2. Scenario Forecast

        3.2.1. Demand in Optimistic Scenario

        3.2.2. Demand in Likely Scenario

        3.2.3. Demand in Conservative Scenario

    3.3. Opportunity Map Analysis

    3.4. Investment Feasibility Matrix

    3.5. PESTLE and Porter’s Analysis

    3.6. Regulatory Landscape

        3.6.1. By Key Regions

        3.6.2. By Key Countries

    3.7. Regional Parent Market Outlook

4. Global Market Analysis 2018 to 2022 and Forecast, 2023 to 2033

    4.1. Historical Market Size Value (US$ Million) Analysis, 2018 to 2022

    4.2. Current and Future Market Size Value (US$ Million) Projections, 2023 to 2033

        4.2.1. Y-o-Y Growth Trend Analysis

        4.2.2. Absolute $ Opportunity Analysis

5. Global Market Analysis 2018 to 2022 and Forecast 2023 to 2033, By Solution

    5.1. Introduction / Key Findings

    5.2. Historical Market Size Value (US$ Million) Analysis By Solution, 2018 to 2022

    5.3. Current and Future Market Size Value (US$ Million) Analysis and Forecast By Solution, 2023 to 2033

        5.3.1. Fleet Management

        5.3.2. Automatic Stock Control

        5.3.3. Remote Data Access

        5.3.4. Railcar Tracking and Tracing

        5.3.5. Others

    5.4. Y-o-Y Growth Trend Analysis By Solution, 2018 to 2022

    5.5. Absolute $ Opportunity Analysis By Solution, 2023 to 2033

6. Global Market Analysis 2018 to 2022 and Forecast 2023 to 2033, By Railcar

    6.1. Introduction / Key Findings

    6.2. Historical Market Size Value (US$ Million) Analysis By Railcar, 2018 to 2022

    6.3. Current and Future Market Size Value (US$ Million) Analysis and Forecast By Railcar, 2023 to 2033

        6.3.1. Hoppers

        6.3.2. Tank Cars

        6.3.3. Well Cars

        6.3.4. Boxcars

        6.3.5. Refrigerated Boxcars

        6.3.6. Others

    6.4. Y-o-Y Growth Trend Analysis By Railcar, 2018 to 2022

    6.5. Absolute $ Opportunity Analysis By Railcar, 2023 to 2033

7. Global Market Analysis 2018 to 2022 and Forecast 2023 to 2033, By Component Type 

    7.1. Introduction / Key Findings

    7.2. Historical Market Size Value (US$ Million) Analysis By Component Type, 2018 to 2022

    7.3. Current and Future Market Size Value (US$ Million) Analysis and Forecast By Component Type, 2023 to 2033

        7.3.1. Telematics Control Unit

        7.3.2. Sensors

    7.4. Y-o-Y Growth Trend Analysis By Component Type, 2018 to 2022

    7.5. Absolute $ Opportunity Analysis By Component Type, 2023 to 2033

8. Global Market Analysis 2018 to 2022 and Forecast 2023 to 2033, By Region

    8.1. Introduction

    8.2. Historical Market Size Value (US$ Million) Analysis By Region, 2018 to 2022

    8.3. Current Market Size Value (US$ Million) Analysis and Forecast By Region, 2023 to 2033

        8.3.1. North America

        8.3.2. Latin America

        8.3.3. Europe

        8.3.4. Asia Pacific

        8.3.5. Middle East and Africa (MEA)

    8.4. Market Attractiveness Analysis By Region

9. North America Market Analysis 2018 to 2022 and Forecast 2023 to 2033, By Country

    9.1. Historical Market Size Value (US$ Million) Trend Analysis By Market Taxonomy, 2018 to 2022

    9.2. Market Size Value (US$ Million) Forecast By Market Taxonomy, 2023 to 2033

        9.2.1. By Country

            9.2.1.1. United States of America

            9.2.1.2. Canada

        9.2.2. By Solution

        9.2.3. By Railcar

        9.2.4. By Component Type

    9.3. Market Attractiveness Analysis

        9.3.1. By Country

        9.3.2. By Solution

        9.3.3. By Railcar

        9.3.4. By Component Type

    9.4. Key Takeaways

10. Latin America Market Analysis 2018 to 2022 and Forecast 2023 to 2033, By Country

    10.1. Historical Market Size Value (US$ Million) Trend Analysis By Market Taxonomy, 2018 to 2022

    10.2. Market Size Value (US$ Million) Forecast By Market Taxonomy, 2023 to 2033

        10.2.1. By Country

            10.2.1.1. Brazil

            10.2.1.2. Mexico

            10.2.1.3. Rest of Latin America

        10.2.2. By Solution

        10.2.3. By Railcar

        10.2.4. By Component Type

    10.3. Market Attractiveness Analysis

        10.3.1. By Country

        10.3.2. By Solution

        10.3.3. By Railcar

        10.3.4. By Component Type

    10.4. Key Takeaways

11. Europe Market Analysis 2018 to 2022 and Forecast 2023 to 2033, By Country

    11.1. Historical Market Size Value (US$ Million) Trend Analysis By Market Taxonomy, 2018 to 2022

    11.2. Market Size Value (US$ Million) Forecast By Market Taxonomy, 2023 to 2033

        11.2.1. By Country

            11.2.1.1. Germany

            11.2.1.2. United Kingdom

            11.2.1.3. France

            11.2.1.4. Spain

            11.2.1.5. Italy

            11.2.1.6. Rest of Europe

        11.2.2. By Solution

        11.2.3. By Railcar

        11.2.4. By Component Type

    11.3. Market Attractiveness Analysis

        11.3.1. By Country

        11.3.2. By Solution

        11.3.3. By Railcar

        11.3.4. By Component Type

    11.4. Key Takeaways

12. Asia Pacific Market Analysis 2018 to 2022 and Forecast 2023 to 2033, By Country

    12.1. Historical Market Size Value (US$ Million) Trend Analysis By Market Taxonomy, 2018 to 2022

    12.2. Market Size Value (US$ Million) Forecast By Market Taxonomy, 2023 to 2033

        12.2.1. By Country

            12.2.1.1. China

            12.2.1.2. Japan

            12.2.1.3. South Korea

            12.2.1.4. Singapore

            12.2.1.5. Thailand

            12.2.1.6. Indonesia

            12.2.1.7. Australia

            12.2.1.8. New Zealand

            12.2.1.9. Rest of Asia Pacific

        12.2.2. By Solution

        12.2.3. By Railcar

        12.2.4. By Component Type

    12.3. Market Attractiveness Analysis

        12.3.1. By Country

        12.3.2. By Solution

        12.3.3. By Railcar

        12.3.4. By Component Type

    12.4. Key Takeaways

13. MEA Market Analysis 2018 to 2022 and Forecast 2023 to 2033, By Country

    13.1. Historical Market Size Value (US$ Million) Trend Analysis By Market Taxonomy, 2018 to 2022

    13.2. Market Size Value (US$ Million) Forecast By Market Taxonomy, 2023 to 2033

        13.2.1. By Country

            13.2.1.1. GCC Countries

            13.2.1.2. South Africa

            13.2.1.3. Israel

            13.2.1.4. Rest of MEA

        13.2.2. By Solution

        13.2.3. By Railcar

        13.2.4. By Component Type

    13.3. Market Attractiveness Analysis

        13.3.1. By Country

        13.3.2. By Solution

        13.3.3. By Railcar

        13.3.4. By Component Type

    13.4. Key Takeaways

14. Key Countries Market Analysis

    14.1. United States of America

        14.1.1. Pricing Analysis

        14.1.2. Market Share Analysis, 2022

            14.1.2.1. By Solution

            14.1.2.2. By Railcar

            14.1.2.3. By Component Type

    14.2. Canada

        14.2.1. Pricing Analysis

        14.2.2. Market Share Analysis, 2022

            14.2.2.1. By Solution

            14.2.2.2. By Railcar

            14.2.2.3. By Component Type

    14.3. Brazil

        14.3.1. Pricing Analysis

        14.3.2. Market Share Analysis, 2022

            14.3.2.1. By Solution

            14.3.2.2. By Railcar

            14.3.2.3. By Component Type

    14.4. Mexico

        14.4.1. Pricing Analysis

        14.4.2. Market Share Analysis, 2022

            14.4.2.1. By Solution

            14.4.2.2. By Railcar

            14.4.2.3. By Component Type

    14.5. Germany

        14.5.1. Pricing Analysis

        14.5.2. Market Share Analysis, 2022

            14.5.2.1. By Solution

            14.5.2.2. By Railcar

            14.5.2.3. By Component Type

    14.6. United Kingdom

        14.6.1. Pricing Analysis

        14.6.2. Market Share Analysis, 2022

            14.6.2.1. By Solution

            14.6.2.2. By Railcar

            14.6.2.3. By Component Type

    14.7. France

        14.7.1. Pricing Analysis

        14.7.2. Market Share Analysis, 2022

            14.7.2.1. By Solution

            14.7.2.2. By Railcar

            14.7.2.3. By Component Type

    14.8. Spain

        14.8.1. Pricing Analysis

        14.8.2. Market Share Analysis, 2022

            14.8.2.1. By Solution

            14.8.2.2. By Railcar

            14.8.2.3. By Component Type

    14.9. Italy

        14.9.1. Pricing Analysis

        14.9.2. Market Share Analysis, 2022

            14.9.2.1. By Solution

            14.9.2.2. By Railcar

            14.9.2.3. By Component Type

    14.10. China

        14.10.1. Pricing Analysis

        14.10.2. Market Share Analysis, 2022

            14.10.2.1. By Solution

            14.10.2.2. By Railcar

            14.10.2.3. By Component Type

    14.11. Japan

        14.11.1. Pricing Analysis

        14.11.2. Market Share Analysis, 2022

            14.11.2.1. By Solution

            14.11.2.2. By Railcar

            14.11.2.3. By Component Type

    14.12. South Korea

        14.12.1. Pricing Analysis

        14.12.2. Market Share Analysis, 2022

            14.12.2.1. By Solution

            14.12.2.2. By Railcar

            14.12.2.3. By Component Type

    14.13. Singapore

        14.13.1. Pricing Analysis

        14.13.2. Market Share Analysis, 2022

            14.13.2.1. By Solution

            14.13.2.2. By Railcar

            14.13.2.3. By Component Type

    14.14. Thailand

        14.14.1. Pricing Analysis

        14.14.2. Market Share Analysis, 2022

            14.14.2.1. By Solution

            14.14.2.2. By Railcar

            14.14.2.3. By Component Type

    14.15. Indonesia

        14.15.1. Pricing Analysis

        14.15.2. Market Share Analysis, 2022

            14.15.2.1. By Solution

            14.15.2.2. By Railcar

            14.15.2.3. By Component Type

    14.16. Australia

        14.16.1. Pricing Analysis

        14.16.2. Market Share Analysis, 2022

            14.16.2.1. By Solution

            14.16.2.2. By Railcar

            14.16.2.3. By Component Type

    14.17. New Zealand

        14.17.1. Pricing Analysis

        14.17.2. Market Share Analysis, 2022

            14.17.2.1. By Solution

            14.17.2.2. By Railcar

            14.17.2.3. By Component Type

    14.18. GCC Countries

        14.18.1. Pricing Analysis

        14.18.2. Market Share Analysis, 2022

            14.18.2.1. By Solution

            14.18.2.2. By Railcar

            14.18.2.3. By Component Type

    14.19. South Africa

        14.19.1. Pricing Analysis

        14.19.2. Market Share Analysis, 2022

            14.19.2.1. By Solution

            14.19.2.2. By Railcar

            14.19.2.3. By Component Type

    14.20. Israel

        14.20.1. Pricing Analysis

        14.20.2. Market Share Analysis, 2022

            14.20.2.1. By Solution

            14.20.2.2. By Railcar

            14.20.2.3. By Component Type

15. Market Structure Analysis

    15.1. Competition Dashboard

    15.2. Competition Benchmarking

    15.3. Market Share Analysis of Top Players

        15.3.1. By Regional

        15.3.2. By Solution

        15.3.3. By Railcar

        15.3.4. By Component Type

16. Competition Analysis

    16.1. Competition Deep Dive

        16.1.1. Siemens AG

            16.1.1.1. Overview

            16.1.1.2. Product Portfolio

            16.1.1.3. Profitability by Market Segments

            16.1.1.4. Sales Footprint

            16.1.1.5. Strategy Overview

                16.1.1.5.1. Marketing Strategy

        16.1.2. Hitachi Ltd.

            16.1.2.1. Overview

            16.1.2.2. Product Portfolio

            16.1.2.3. Profitability by Market Segments

            16.1.2.4. Sales Footprint

            16.1.2.5. Strategy Overview

                16.1.2.5.1. Marketing Strategy

        16.1.3. Alstom SA

            16.1.3.1. Overview

            16.1.3.2. Product Portfolio

            16.1.3.3. Profitability by Market Segments

            16.1.3.4. Sales Footprint

            16.1.3.5. Strategy Overview

                16.1.3.5.1. Marketing Strategy

        16.1.4. Knorr-Bremse AG

            16.1.4.1. Overview

            16.1.4.2. Product Portfolio

            16.1.4.3. Profitability by Market Segments

            16.1.4.4. Sales Footprint

            16.1.4.5. Strategy Overview

                16.1.4.5.1. Marketing Strategy

        16.1.5. Robert Bosch GmbH

            16.1.5.1. Overview

            16.1.5.2. Product Portfolio

            16.1.5.3. Profitability by Market Segments

            16.1.5.4. Sales Footprint

            16.1.5.5. Strategy Overview

                16.1.5.5.1. Marketing Strategy

        16.1.6. Intermodal Telematics BV

            16.1.6.1. Overview

            16.1.6.2. Product Portfolio

            16.1.6.3. Profitability by Market Segments

            16.1.6.4. Sales Footprint

            16.1.6.5. Strategy Overview

                16.1.6.5.1. Marketing Strategy

        16.1.7. Orbcomm

            16.1.7.1. Overview

            16.1.7.2. Product Portfolio

            16.1.7.3. Profitability by Market Segments

            16.1.7.4. Sales Footprint

            16.1.7.5. Strategy Overview

                16.1.7.5.1. Marketing Strategy

        16.1.8. Railnova

            16.1.8.1. Overview

            16.1.8.2. Product Portfolio

            16.1.8.3. Profitability by Market Segments

            16.1.8.4. Sales Footprint

            16.1.8.5. Strategy Overview

                16.1.8.5.1. Marketing Strategy

        16.1.9. TrinityRail

            16.1.9.1. Overview

            16.1.9.2. Product Portfolio

            16.1.9.3. Profitability by Market Segments

            16.1.9.4. Sales Footprint

            16.1.9.5. Strategy Overview

                16.1.9.5.1. Marketing Strategy

        16.1.10. Savvy Telematic Systems AG

            16.1.10.1. Overview

            16.1.10.2. Product Portfolio

            16.1.10.3. Profitability by Market Segments

            16.1.10.4. Sales Footprint

            16.1.10.5. Strategy Overview

                16.1.10.5.1. Marketing Strategy

17. Assumptions & Acronyms Used

18. Research Methodology

List of Tables

Table 1: Global Market Value (US$ Million) Forecast by Region, 2018 to 2033

Table 2: Global Market Value (US$ Million) Forecast by Solution, 2018 to 2033

Table 3: Global Market Value (US$ Million) Forecast by Railcar, 2018 to 2033

Table 4: Global Market Value (US$ Million) Forecast by Component Type, 2018 to 2033

Table 5: North America Market Value (US$ Million) Forecast by Country, 2018 to 2033

Table 6: North America Market Value (US$ Million) Forecast by Solution, 2018 to 2033

Table 7: North America Market Value (US$ Million) Forecast by Railcar, 2018 to 2033

Table 8: North America Market Value (US$ Million) Forecast by Component Type, 2018 to 2033

Table 9: Latin America Market Value (US$ Million) Forecast by Country, 2018 to 2033

Table 10: Latin America Market Value (US$ Million) Forecast by Solution, 2018 to 2033

Table 11: Latin America Market Value (US$ Million) Forecast by Railcar, 2018 to 2033

Table 12: Latin America Market Value (US$ Million) Forecast by Component Type, 2018 to 2033

Table 13: Europe Market Value (US$ Million) Forecast by Country, 2018 to 2033

Table 14: Europe Market Value (US$ Million) Forecast by Solution, 2018 to 2033

Table 15: Europe Market Value (US$ Million) Forecast by Railcar, 2018 to 2033

Table 16: Europe Market Value (US$ Million) Forecast by Component Type, 2018 to 2033

Table 17: Asia Pacific Market Value (US$ Million) Forecast by Country, 2018 to 2033

Table 18: Asia Pacific Market Value (US$ Million) Forecast by Solution, 2018 to 2033

Table 19: Asia Pacific Market Value (US$ Million) Forecast by Railcar, 2018 to 2033

Table 20: Asia Pacific Market Value (US$ Million) Forecast by Component Type, 2018 to 2033

Table 21: MEA Market Value (US$ Million) Forecast by Country, 2018 to 2033

Table 22: MEA Market Value (US$ Million) Forecast by Solution, 2018 to 2033

Table 23: MEA Market Value (US$ Million) Forecast by Railcar, 2018 to 2033

Table 24: MEA Market Value (US$ Million) Forecast by Component Type, 2018 to 2033

List of Charts

Figure 1: Global Market Value (US$ Million) by Solution, 2023 to 2033

Figure 2: Global Market Value (US$ Million) by Railcar, 2023 to 2033

Figure 3: Global Market Value (US$ Million) by Component Type, 2023 to 2033

Figure 4: Global Market Value (US$ Million) by Region, 2023 to 2033

Figure 5: Global Market Value (US$ Million) Analysis by Region, 2018 to 2033

Figure 6: Global Market Value Share (%) and BPS Analysis by Region, 2023 to 2033

Figure 7: Global Market Y-o-Y Growth (%) Projections by Region, 2023 to 2033

Figure 8: Global Market Value (US$ Million) Analysis by Solution, 2018 to 2033

Figure 9: Global Market Value Share (%) and BPS Analysis by Solution, 2023 to 2033

Figure 10: Global Market Y-o-Y Growth (%) Projections by Solution, 2023 to 2033

Figure 11: Global Market Value (US$ Million) Analysis by Railcar, 2018 to 2033

Figure 12: Global Market Value Share (%) and BPS Analysis by Railcar, 2023 to 2033

Figure 13: Global Market Y-o-Y Growth (%) Projections by Railcar, 2023 to 2033

Figure 14: Global Market Value (US$ Million) Analysis by Component Type, 2018 to 2033

Figure 15: Global Market Value Share (%) and BPS Analysis by Component Type, 2023 to 2033

Figure 16: Global Market Y-o-Y Growth (%) Projections by Component Type, 2023 to 2033

Figure 17: Global Market Attractiveness by Solution, 2023 to 2033

Figure 18: Global Market Attractiveness by Railcar, 2023 to 2033

Figure 19: Global Market Attractiveness by Component Type, 2023 to 2033

Figure 20: Global Market Attractiveness by Region, 2023 to 2033

Figure 21: North America Market Value (US$ Million) by Solution, 2023 to 2033

Figure 22: North America Market Value (US$ Million) by Railcar, 2023 to 2033

Figure 23: North America Market Value (US$ Million) by Component Type, 2023 to 2033

Figure 24: North America Market Value (US$ Million) by Country, 2023 to 2033

Figure 25: North America Market Value (US$ Million) Analysis by Country, 2018 to 2033

Figure 26: North America Market Value Share (%) and BPS Analysis by Country, 2023 to 2033

Figure 27: North America Market Y-o-Y Growth (%) Projections by Country, 2023 to 2033

Figure 28: North America Market Value (US$ Million) Analysis by Solution, 2018 to 2033

Figure 29: North America Market Value Share (%) and BPS Analysis by Solution, 2023 to 2033

Figure 30: North America Market Y-o-Y Growth (%) Projections by Solution, 2023 to 2033

Figure 31: North America Market Value (US$ Million) Analysis by Railcar, 2018 to 2033

Figure 32: North America Market Value Share (%) and BPS Analysis by Railcar, 2023 to 2033

Figure 33: North America Market Y-o-Y Growth (%) Projections by Railcar, 2023 to 2033

Figure 34: North America Market Value (US$ Million) Analysis by Component Type, 2018 to 2033

Figure 35: North America Market Value Share (%) and BPS Analysis by Component Type, 2023 to 2033

Figure 36: North America Market Y-o-Y Growth (%) Projections by Component Type, 2023 to 2033

Figure 37: North America Market Attractiveness by Solution, 2023 to 2033

Figure 38: North America Market Attractiveness by Railcar, 2023 to 2033

Figure 39: North America Market Attractiveness by Component Type, 2023 to 2033

Figure 40: North America Market Attractiveness by Country, 2023 to 2033

Figure 41: Latin America Market Value (US$ Million) by Solution, 2023 to 2033

Figure 42: Latin America Market Value (US$ Million) by Railcar, 2023 to 2033

Figure 43: Latin America Market Value (US$ Million) by Component Type, 2023 to 2033

Figure 44: Latin America Market Value (US$ Million) by Country, 2023 to 2033

Figure 45: Latin America Market Value (US$ Million) Analysis by Country, 2018 to 2033

Figure 46: Latin America Market Value Share (%) and BPS Analysis by Country, 2023 to 2033

Figure 47: Latin America Market Y-o-Y Growth (%) Projections by Country, 2023 to 2033

Figure 48: Latin America Market Value (US$ Million) Analysis by Solution, 2018 to 2033

Figure 49: Latin America Market Value Share (%) and BPS Analysis by Solution, 2023 to 2033

Figure 50: Latin America Market Y-o-Y Growth (%) Projections by Solution, 2023 to 2033

Figure 51: Latin America Market Value (US$ Million) Analysis by Railcar, 2018 to 2033

Figure 52: Latin America Market Value Share (%) and BPS Analysis by Railcar, 2023 to 2033

Figure 53: Latin America Market Y-o-Y Growth (%) Projections by Railcar, 2023 to 2033

Figure 54: Latin America Market Value (US$ Million) Analysis by Component Type, 2018 to 2033

Figure 55: Latin America Market Value Share (%) and BPS Analysis by Component Type, 2023 to 2033

Figure 56: Latin America Market Y-o-Y Growth (%) Projections by Component Type, 2023 to 2033

Figure 57: Latin America Market Attractiveness by Solution, 2023 to 2033

Figure 58: Latin America Market Attractiveness by Railcar, 2023 to 2033

Figure 59: Latin America Market Attractiveness by Component Type, 2023 to 2033

Figure 60: Latin America Market Attractiveness by Country, 2023 to 2033

Figure 61: Europe Market Value (US$ Million) by Solution, 2023 to 2033

Figure 62: Europe Market Value (US$ Million) by Railcar, 2023 to 2033

Figure 63: Europe Market Value (US$ Million) by Component Type, 2023 to 2033

Figure 64: Europe Market Value (US$ Million) by Country, 2023 to 2033

Figure 65: Europe Market Value (US$ Million) Analysis by Country, 2018 to 2033

Figure 66: Europe Market Value Share (%) and BPS Analysis by Country, 2023 to 2033

Figure 67: Europe Market Y-o-Y Growth (%) Projections by Country, 2023 to 2033

Figure 68: Europe Market Value (US$ Million) Analysis by Solution, 2018 to 2033

Figure 69: Europe Market Value Share (%) and BPS Analysis by Solution, 2023 to 2033

Figure 70: Europe Market Y-o-Y Growth (%) Projections by Solution, 2023 to 2033

Figure 71: Europe Market Value (US$ Million) Analysis by Railcar, 2018 to 2033

Figure 72: Europe Market Value Share (%) and BPS Analysis by Railcar, 2023 to 2033

Figure 73: Europe Market Y-o-Y Growth (%) Projections by Railcar, 2023 to 2033

Figure 74: Europe Market Value (US$ Million) Analysis by Component Type, 2018 to 2033

Figure 75: Europe Market Value Share (%) and BPS Analysis by Component Type, 2023 to 2033

Figure 76: Europe Market Y-o-Y Growth (%) Projections by Component Type, 2023 to 2033

Figure 77: Europe Market Attractiveness by Solution, 2023 to 2033

Figure 78: Europe Market Attractiveness by Railcar, 2023 to 2033

Figure 79: Europe Market Attractiveness by Component Type, 2023 to 2033

Figure 80: Europe Market Attractiveness by Country, 2023 to 2033

Figure 81: Asia Pacific Market Value (US$ Million) by Solution, 2023 to 2033

Figure 82: Asia Pacific Market Value (US$ Million) by Railcar, 2023 to 2033

Figure 83: Asia Pacific Market Value (US$ Million) by Component Type, 2023 to 2033

Figure 84: Asia Pacific Market Value (US$ Million) by Country, 2023 to 2033

Figure 85: Asia Pacific Market Value (US$ Million) Analysis by Country, 2018 to 2033

Figure 86: Asia Pacific Market Value Share (%) and BPS Analysis by Country, 2023 to 2033

Figure 87: Asia Pacific Market Y-o-Y Growth (%) Projections by Country, 2023 to 2033

Figure 88: Asia Pacific Market Value (US$ Million) Analysis by Solution, 2018 to 2033

Figure 89: Asia Pacific Market Value Share (%) and BPS Analysis by Solution, 2023 to 2033

Figure 90: Asia Pacific Market Y-o-Y Growth (%) Projections by Solution, 2023 to 2033

Figure 91: Asia Pacific Market Value (US$ Million) Analysis by Railcar, 2018 to 2033

Figure 92: Asia Pacific Market Value Share (%) and BPS Analysis by Railcar, 2023 to 2033

Figure 93: Asia Pacific Market Y-o-Y Growth (%) Projections by Railcar, 2023 to 2033

Figure 94: Asia Pacific Market Value (US$ Million) Analysis by Component Type, 2018 to 2033

Figure 95: Asia Pacific Market Value Share (%) and BPS Analysis by Component Type, 2023 to 2033

Figure 96: Asia Pacific Market Y-o-Y Growth (%) Projections by Component Type, 2023 to 2033

Figure 97: Asia Pacific Market Attractiveness by Solution, 2023 to 2033

Figure 98: Asia Pacific Market Attractiveness by Railcar, 2023 to 2033

Figure 99: Asia Pacific Market Attractiveness by Component Type, 2023 to 2033

Figure 100: Asia Pacific Market Attractiveness by Country, 2023 to 2033

Figure 101: MEA Market Value (US$ Million) by Solution, 2023 to 2033

Figure 102: MEA Market Value (US$ Million) by Railcar, 2023 to 2033

Figure 103: MEA Market Value (US$ Million) by Component Type, 2023 to 2033

Figure 104: MEA Market Value (US$ Million) by Country, 2023 to 2033

Figure 105: MEA Market Value (US$ Million) Analysis by Country, 2018 to 2033

Figure 106: MEA Market Value Share (%) and BPS Analysis by Country, 2023 to 2033

Figure 107: MEA Market Y-o-Y Growth (%) Projections by Country, 2023 to 2033

Figure 108: MEA Market Value (US$ Million) Analysis by Solution, 2018 to 2033

Figure 109: MEA Market Value Share (%) and BPS Analysis by Solution, 2023 to 2033

Figure 110: MEA Market Y-o-Y Growth (%) Projections by Solution, 2023 to 2033

Figure 111: MEA Market Value (US$ Million) Analysis by Railcar, 2018 to 2033

Figure 112: MEA Market Value Share (%) and BPS Analysis by Railcar, 2023 to 2033

Figure 113: MEA Market Y-o-Y Growth (%) Projections by Railcar, 2023 to 2033

Figure 114: MEA Market Value (US$ Million) Analysis by Component Type, 2018 to 2033

Figure 115: MEA Market Value Share (%) and BPS Analysis by Component Type, 2023 to 2033

Figure 116: MEA Market Y-o-Y Growth (%) Projections by Component Type, 2023 to 2033

Figure 117: MEA Market Attractiveness by Solution, 2023 to 2033

Figure 118: MEA Market Attractiveness by Railcar, 2023 to 2033

Figure 119: MEA Market Attractiveness by Component Type, 2023 to 2033

Figure 120: MEA Market Attractiveness by Country, 2023 to 2033

Recommendations

Automotive

Off-Highway Vehicle (OHV) Telematics Market

Published : June 2023

Explore Automotive Insights

View Reports

Railway Telematics Market