Railway Rolling Stock Market Outlook for 2024 to 2034

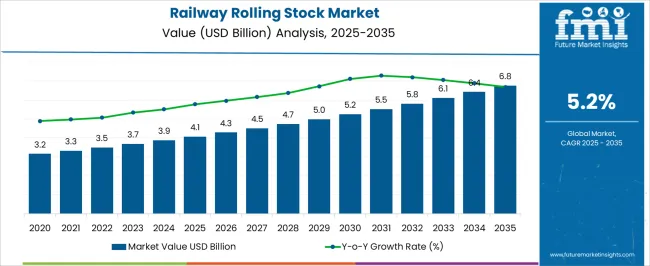
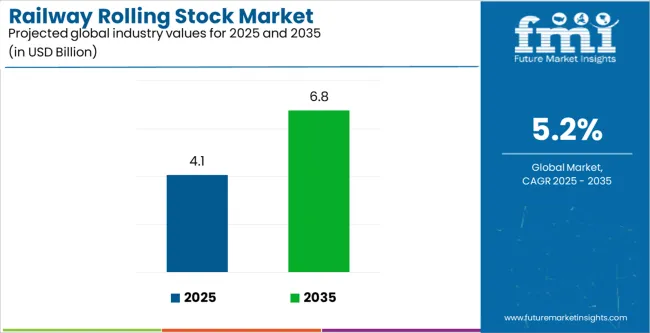
The railway rolling stock market is all set to grow to US$ 6.43 billion by 2034 from US$ 3.87 billion in 2024, registering a moderate CAGR of 5.20% between 2024 and 2034. Investments in the railway infrastructure and adoption of advanced digital solutions advance the railway rolling stock market forward.

Attributes Details
Railway Rolling Stock Market Value for 2024 US$ 3.87 billion
Railway Rolling Stock Market Value for 2034 US$ 6.43 billion
Railway Rolling Stock Market Forecast CAGR for 2024 to 2034 5.20%

Don't pay for what you don't need

Customize your report by selecting specific countries or regions and save 30%!

Investment Opportunities in the Railway Rolling Stock Market

  • Technological advances have enabled the development of energy-efficient rolling stock, such as electric locomotives using regenerative braking, computer vision, and artificial intelligence. As there is a trend toward enhancing railway transportation safety, market players have the opportunity to capitalize on this.
  • Several metropolitan provinces have developed a rigid infrastructure of metro and subway trains that operate on a daily scheduled routine and straightening the commuter tracks. Investments in this may possibly prove to be beneficial.
  • Demand for autonomous trains is becoming a novel trend in the transportation sector, owing to the self-driving feature of the locomotive. Depending on this, diversifying the product portfolio could turn out to be advantageous.

Consumption Analysis of Railway Rolling Stocks

  • Railway infrastructure investments are boosting the railway rolling stock market growth by modernizing locomotives, installing stronger brake systems, and enhancing passenger comfort, thereby enhancing the overall infrastructure.
  • Demand for railway rolling stock is expanding due to the deployment of vehicles that can carry high loads by public and private organizations, improving transportation infrastructures.
  • The railway rolling stock market growth is also attributed to the acquisition of new locomotives, coaches, wagons, infrastructure upgrades such as track reduction, and modern signaling systems.
  • Railway transportation demand surges due to high costs, necessitating real-time condition-based maintenance procedures for rolling stock, infrastructure, and rolling stock OEMs, rail operators, and suppliers.
Nikhil Kaitwade
Nikhil Kaitwade

Principal Consultant

Talk to Analyst

Find your sweet spots for generating winning opportunities in this market.

Historical Performance and Future Growth of the Railway Rolling Stock Market

A historical CAGR of 1.9% was recorded for the market and a 5.2% CAGR is calculated up to 2034. Upon closer examination of the data related to the historical growth and future growth of the railway rolling stock market, it can be stated that a boom in the sales of railway rolling stocks is awaiting in the future.

Attributes Details
Railway Rolling Stock Market Historical CAGR for 2019 to 2023 1.90%

High capital investments, increased costs, competition, stringent regulations, and decarbonization trends may hinder market growth in railway rolling stock manufacturing and railway infrastructure development, requiring additional capital for cost optimization.

Critical aspects that are anticipated to influence the demand for railway rolling stock through 2034.

  • Market players could witness a lucrative opportunity by introducing novel amenities. These include powerful locomotives, regenerative braking systems, and improved passenger coaches.
  • Opportunities exist to develop demand for technological advancements such as electric locomotives, automated track systems, energy-efficient and accurate GPS, etc.
  • The introduction to visual and auditory announcements, easy access to WiFi and ramps for wheelchairs, space for bicycles, and video surveillance have developed a demand for improvements in the railway rolling stock industry.

Market players are going to desire to be prudent and flexible over the anticipated period since these challenging attributes position the industry for accomplishment in subsequent decades.

Key Trends Influencing the Railway Rolling Stock Market

Adoption of Metro and Subway Trains Propels the Demand for Railway Rolling Stocks

  • The progression in the metro and subway stations has given the green signal to the advancement in railway transportation. These include the adoption of high-end railcars, the production and supply of specialized railway rolling stocks, and the adoption of regenerative braking technology for the safety of passengers.
  • The public transport systems provide immense opportunities for newly emerging start-ups to develop technologies suitable for safe and convenient metro and subway transportation.

Autonomous Trains Shoot Up the Trends in the Railway Rolling Stock Market

  • Autonomous locomotives offer rapid transportation speed, enhanced passenger safety, and on-time railway scheduling, developing the market need in the forthcoming decade.
  • Several governments and private entities are developing tracks for autonomous trains with predetermined paths to shoot up the transportation time and develop the work efficiency of the railway rolling stocks.

Tours and Travel Industry Develops Demand for Railway Rolling Stocks

  • The tourism industry offers several options for utilizing railway paths to connect major tourist places on one path. The train tourism market promotes the idea of commuting to significant tourist places on the scheduled and pre-determined railway path.
  • Tourists globally desire train travel owing to its passenger safety, convenience, novel interactions, and scenic views of train travel, boosting the demand for railway rolling stocks.

Get the data you need at a Fraction of the cost

Personalize your report by choosing insights you need
and save 40%!

Category-wise Insights

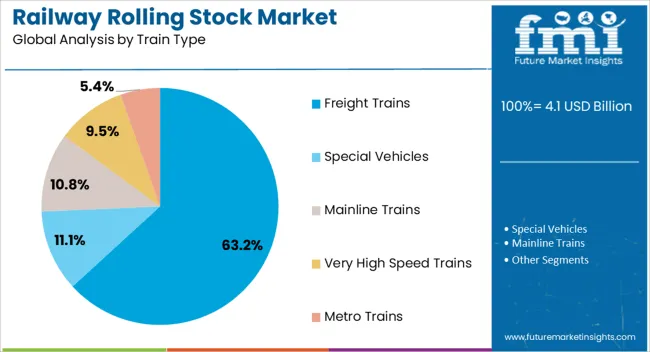
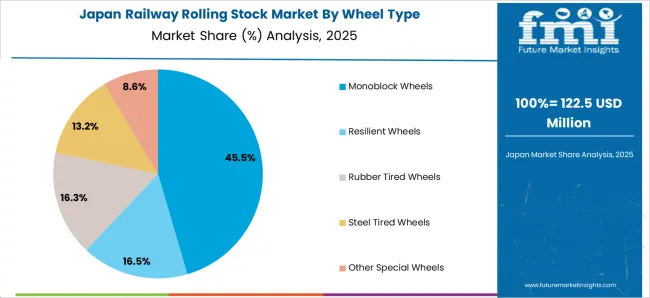
An in-depth segmental analysis of the railway rolling stock market indicates that according to the wheel type, monoblock wheels are in significant demand. Similarly, based on the train type, freight trains are in demand.

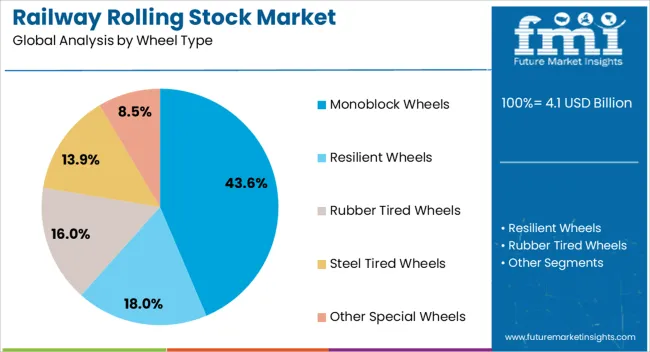
Monoblock Wheels Covers Up To 43.6% of Market Share

Attributes Details
Top Wheel Type Monoblock Wheels
Market share in 2024 43.6%

The railway rolling stock market runs significant demand for monoblock wheels, registering a market share of around 43.60% in 2024. The following aspects display the development of monoblock wheels in the industry:

  • The demand for monoblock wheels is significant in railway transportation owing to their rigid assembly of single parts without any removable components.
  • Monoblock wheels are widely revered for their superior load-bearing capabilities, developing the demand from the railway rolling stock industry.
  • The development of the monoblock wheels for locomotives sparks the demand for several minerals such as aluminum, steel, iron, and copper.
  • The demand for monoblock wheels is significant owing to their durability and long-term utilization factor, which fuels the market development.

Freight Trains Packs up Almost 67.4% of Industry Share

Attributes Details
Top Train Type Freight Trains
Market share in 2024 63.2%

The freight trains are significant in railway transport, which acquires almost 63.2% market share in 2024. The development of freight trains from the following aspects:

  • The demand for freight trains is prominent as they provide a safe and secure transportation option for heavy-duty loads over a predetermined path.
  • Freight trains are a crucial component of the global supply chain, offering a preferred alternative to road transport for high-volume goods internationally and domestically.
  • The digitalization of freight trains offers rail operators significant safety and productivity opportunities, enhancing their professional attractiveness and working conditions.

Country-wise Insights

Based on the statistical data, it can be inferred that the industry in the United States and India is developing at a moderate pace in the upcoming decade. Simultaneously, the railway rolling stock industry in Germany and Japan is hitting the roof due to several factors. The railway rolling stock industry in China registers a lower CAGR than the other countries.

Countries CAGR from 2024 to 2034
United States 5.1%
Germany 6.7%
China 4.8%
Japan 6.7%
India 5.7%

Demand for the Railway Rolling Stock Rise Steeply in the United States

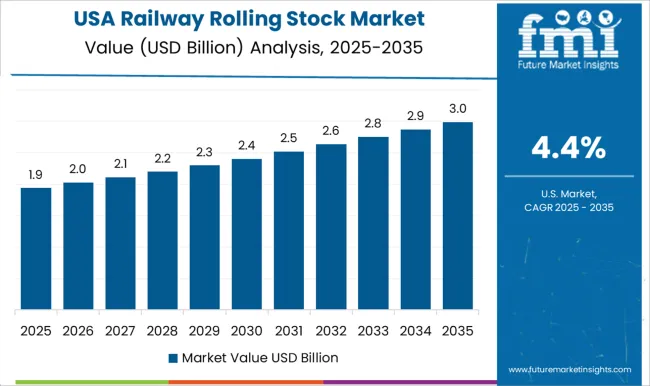
The demand for railway rolling stock in the United States registers a CAGR of 5.1% from 2024 to 2034. Here are a few of the major trends:

  • The large geographical area of the United States offers an enlarged network of railway tracks for transportation.
  • In the United States, several metropolitan areas, such as New York and San Francisco, have integrated Subway and Metro into the daily routine for most of the working-class population.
  • The development of the railway rolling stock industry in the United States results from technological developments done by prominent regional and emerging market players.

Underground Railway Network Develops the Demand for the Railway Rolling Stock in Germany

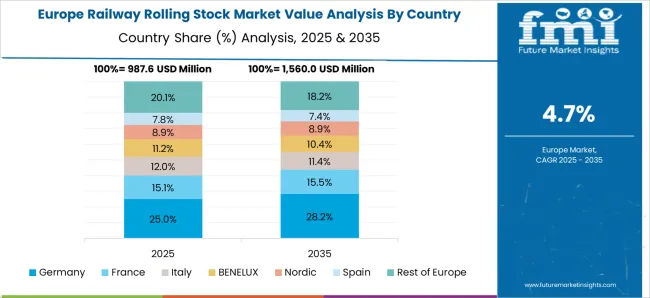
Demand for railway rolling stock in Germany is set to develop at a CAGR of 6.7%. The following factors are propelling the demand for railway rolling stock in Germany:

  • The demand for railway rolling stock in Germany is expected to surge due to the country's developed underground railway network.
  • Germany's underground railway network has been functioning for more than a century, and it is running smoothly owing to its rigid infrastructure.
  • All of the main cities in Germany have been connected with underground and overground railway tracks as civilians still prefer them as the fastest transportation route.

Technological Advancement in China Progresses Railways Rolling Stocks Industry

The demand for railway rolling stock in China is en route to extend at a CAGR of 4.8% between 2024 and 2034. Some of the primary trends in the industry are:
  • The integration of the bullet train in China develops due to technological advancements such as an anti-breaking system and rapid track management.
  • The government is determined to develop the demand for the railway rolling stock by multiplying the utilization of the bullet train.
  • Market players in China are developing novel technology to advance train transportation and offer passenger convenience.

Japan’s Train Transportation offers Fertile Ground for the Railway Rolling Stock Industry

The demand for railway rolling stock in Japan is on its way to report a CAGR of 6.7% from 2024 to 2034. Some of the primary trends are:

  • The average population of Japan prefers railway transportation over road transit as it offers rapid transportation and passenger convenience.
  • Emerging market players in Japan are developing novel technologies to improve railway transit, such as the Maglev train.
  • The demand for rapid cargo transportation is set to increase the development of freight transportation in Japan in the upcoming decade.

India’s Tourism Sector Cultivates the Demand for Railway Rolling Stock

The railway rolling stock industry in India is fixed to register a CAGR of 5.7% by 2034. Among the primary catalysts of the market are:
  • India’s tourism sector demands the development of train and cargo transport to improve passenger expediency.
  • The demand for railway transport in Indian cities is significant as the country offers one of the most complex railway networks in the world.
  • The railway network in India connects several significant places with a high population, therefore developing the demand for the advancement of the railway rolling stock industry in India.

Market Players Shaping the Outlook of the Global Railway Rolling Stock Market

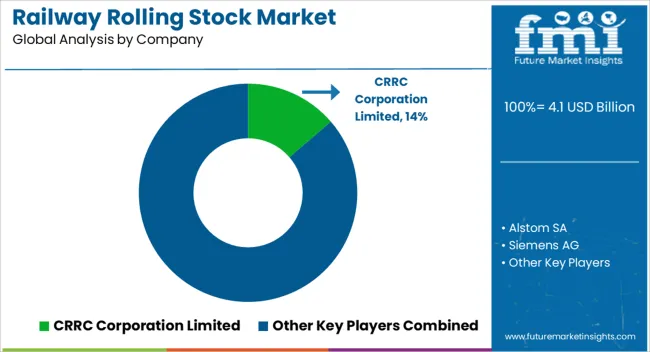
The railway rolling stock industry is saturated with several market players. To thrive in the railway rolling stock market company is anticipated to develop high capital money and a well-established trade network.

In the forthcoming decade, railway companies are expected to use several strategies to develop their network and operations and increase their market share, such as forming partnerships with prominent railway entities. This allows railway companies to combine resources, knowledge, and expertise to succeed in the market.

Another strategy is to introduce pristine and better products and services. Market players plan to get a competitive edge through product launches.

Railway manufacturers strive to improve their rolling stock's safety, efficiency, and comfort through the development and implementation of new technologies as well as innovations. This vaguely includes leveraging advanced technologies such as AI and IoT to reduce expenses and enhance their customers' travel experience.

These strategies above could be proven fruitful in propelling the demand for railway rolling stock in the upcoming decade.

Recent Developments in the Railway Rolling Stock Market

  • In March 2024, Alstom increased its contract to supply 103 new MF19 trains for the Paris metro in Île-de-France, France, with an additional US$ 875 million order. The French rolling stock manufacturer signed the order in 2019 on behalf of Île-de-France Mobilités.
  • In March 2024, Hitachi Rail signed a US$ 216.4 million contract with the Municipality of Naples to supply 22 next-generation trains for the Naples Metro network in Italy. The trains are anticipated to be constructed locally at Hitachi's factories in Pistoia and Naples, replacing smaller trains on Line 6.
  • In February 2024, Siemens Mobility established a leasing subsidiary, Smart Train Lease, to offer short-term, flexible rental of its Mireo Smart trains in Europe, including battery, hydrogen, and electric versions, with plans for medium-term expansion throughout Europe.
  • In November 2023, ABB and Titagarh Rail Systems formed a strategic partnership to supply propulsion systems for metro rolling stock projects in India, aligning with the Indian government's "Make in India" and "Atmanirbhar Bharat" initiatives and already winning orders for Gujarat metro coaches.

Key Companies in the Railway Rolling Stock Market

  • CRRC Corporation Limited
  • Alstom SA
  • Siemens AG
  • GE Transportation
  • IHI Corporation
  • PPF Group N.V.
  • Stadler Rail AG
  • Tatravoganka A.S. Poprad
  • Wabtech Corporation
  • Kawasaki Heavy Industries Ltd.
  • The Greenbrier Companies, Inc.
  • The Kinki Sharyo Co., Ltd.
  • PESA Bydgoszcz SA
  • MAPNA Group

Key Coverage in the Railway Rolling Stock Market Report

  • Rising sales of railway rolling stock in the United States
  • Growth Analysis of the Railway Engine or Locomotive Market
  • Top 10 Emerging trends in the railway rolling stock
  • Analysis of Growth Outlook of the Railway Rolling Stock in the United States
  • Sales Analysis of Locomotive Pantographs Market
  • Comparative Assessment of Passenger coach market and Locomotive market in the United States

Key Segments

By Wheel Type:

  • Monoblock Wheels
  • Resilient Wheels
  • Rubber Tired Wheels
  • Steel Tired Wheels
  • Other Special Wheels

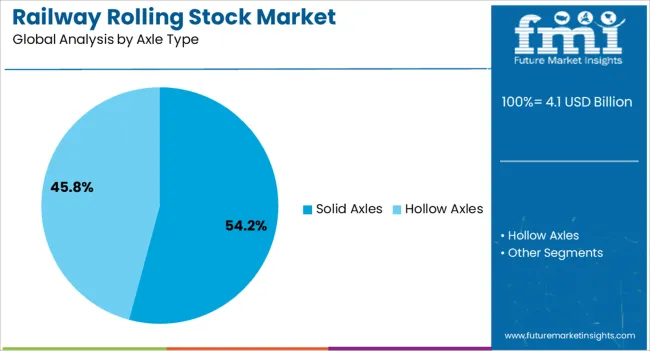
By Axle Type:

  • Hollow Axles
  • Solid Axles

By Train Type:

  • Very High Speed Trains
  • Mainline Trains
  • Metro Trains
  • Freight Trains
  • Special Vehicles

By Sales Channel:

  • OEM
  • Aftermarket

By Region:

  • North America
  • Latin America
  • Europe
  • East Asia
  • South Asia
  • Oceania
  • Middle East and Africa

Frequently Asked Questions

How Big is the Railway Rolling Stock Market?

The market is currently valued at US$ 3.87 billion in 2024.

What is the Future Outlook of the Railway Rolling Stock market?

The market is set to be valued at US$ 6.43 billion by 2034.

What is the Growth Forecast for the Railway Rolling Stock industry?

The railway rolling stock market to register a CAGR of 5.20% from 2024 to 2034.

What are the Classification of Rolling Stock in Railway?

Railway rolling stock are classified as very high-speed trains, mainline trains, metro trains, freight trains, and special vehicles.

Table of Content
1. Executive Summary
    1.1. Global Market Outlook
    1.2. Demand-side Trends
    1.3. Supply-side Trends
    1.4. Technology Roadmap Analysis
    1.5. Analysis and Recommendations
2. Market Overview
    2.1. Market Coverage / Taxonomy
    2.2. Market Definition / Scope / Limitations
3. Market Background
    3.1. Market Dynamics
        3.1.1. Drivers
        3.1.2. Restraints
        3.1.3. Opportunity
        3.1.4. Trends
    3.2. Scenario Forecast
        3.2.1. Demand in Optimistic Scenario
        3.2.2. Demand in Likely Scenario
        3.2.3. Demand in Conservative Scenario
    3.3. Opportunity Map Analysis
    3.4. Product Life Cycle Analysis
    3.5. Supply Chain Analysis
        3.5.1. Supply Side Participants and their Roles
            3.5.1.1. Manufacturer
        3.5.2. Value Added and Value Created at Node in the Supply Chain
        3.5.3. List of Raw Material Suppliers
        3.5.4. List of Existing and Potential Buyer’s
    3.6. Investment Feasibility Matrix
    3.7. Value Chain Analysis
        3.7.1. Profit Margin Analysis
    3.8. PESTLE and Porter’s Analysis
    3.9. Regulatory Landscape
        3.9.1. By Key Regions
        3.9.2. By Key Countries
    3.10. Regional Parent Market Outlook
    3.11. Production and Consumption Statistics
    3.12. Import and Export Statistics
4. Global Market Analysis 2019 to 2023 and Forecast, 2024 to 2034
    4.1. Historical Market Size Value (US$ Million) & Volume (Units) Analysis, 2019 to 2023
    4.2. Current and Future Market Size Value (US$ Million) & Volume (Units) Projections, 2024 to 2034
        4.2.1. Y-o-Y Growth Trend Analysis
        4.2.2. Absolute $ Opportunity Analysis
5. Global Market Analysis 2019 to 2023 and Forecast 2024 to 2034, By Type
    5.1. Introduction / Key Findings
    5.2. Historical Market Size Value (US$ Million) & Volume (Units) Analysis By Type, 2019 to 2023
    5.3. Current and Future Market Size Value (US$ Million) & Volume (Units) Analysis and Forecast By Type, 2024 to 2034
        5.3.1. Locomotive
            5.3.1.1. Diesel Locomotives (DMU)
            5.3.1.2. Electric Locomotives (EMU)
            5.3.1.3. Electro-diesel Locomotives
            5.3.1.4. Others
        5.3.2. Passenger Coaches
        5.3.3. Freight Wagon
        5.3.4. Trams or Light Rails
        5.3.5. Metro or Subways
        5.3.6. Monorail
        5.3.7. Others
    5.4. Y-o-Y Growth Trend Analysis By Type, 2019 to 2023
    5.5. Absolute $ Opportunity Analysis By Type, 2024 to 2034
6. Global Market Analysis 2019 to 2023 and Forecast 2024 to 2034, By End User
    6.1. Introduction / Key Findings
    6.2. Historical Market Size Value (US$ Million) & Volume (Units) Analysis By End User, 2019 to 2023
    6.3. Current and Future Market Size Value (US$ Million) & Volume (Units) Analysis and Forecast By End User, 2024 to 2034
        6.3.1. Passenger Transit
        6.3.2. Cargo or Freight Transit
        6.3.3. Others
    6.4. Y-o-Y Growth Trend Analysis By End User, 2019 to 2023
    6.5. Absolute $ Opportunity Analysis By End User, 2024 to 2034
7. Global Market Analysis 2019 to 2023 and Forecast 2024 to 2034, By Region
    7.1. Introduction
    7.2. Historical Market Size Value (US$ Million) & Volume (Units) Analysis By Region, 2019 to 2023
    7.3. Current Market Size Value (US$ Million) & Volume (Units) Analysis and Forecast By Region, 2024 to 2034
        7.3.1. North America
        7.3.2. Latin America
        7.3.3. Western Europe
        7.3.4. Eastern Europe
        7.3.5. South Asia and Pacific
        7.3.6. East Asia
        7.3.7. Middle East and Africa
    7.4. Market Attractiveness Analysis By Region
8. North America Market Analysis 2019 to 2023 and Forecast 2024 to 2034, By Country
    8.1. Historical Market Size Value (US$ Million) & Volume (Units) Trend Analysis By Market Taxonomy, 2019 to 2023
    8.2. Market Size Value (US$ Million) & Volume (Units) Forecast By Market Taxonomy, 2024 to 2034
        8.2.1. By Country
            8.2.1.1. USA
            8.2.1.2. Canada
        8.2.2. By Type
        8.2.3. By End User
    8.3. Market Attractiveness Analysis
        8.3.1. By Country
        8.3.2. By Type
        8.3.3. By End User
    8.4. Key Takeaways
9. Latin America Market Analysis 2019 to 2023 and Forecast 2024 to 2034, By Country
    9.1. Historical Market Size Value (US$ Million) & Volume (Units) Trend Analysis By Market Taxonomy, 2019 to 2023
    9.2. Market Size Value (US$ Million) & Volume (Units) Forecast By Market Taxonomy, 2024 to 2034
        9.2.1. By Country
            9.2.1.1. Brazil
            9.2.1.2. Mexico
            9.2.1.3. Rest of Latin America
        9.2.2. By Type
        9.2.3. By End User
    9.3. Market Attractiveness Analysis
        9.3.1. By Country
        9.3.2. By Type
        9.3.3. By End User
    9.4. Key Takeaways
10. Western Europe Market Analysis 2019 to 2023 and Forecast 2024 to 2034, By Country
    10.1. Historical Market Size Value (US$ Million) & Volume (Units) Trend Analysis By Market Taxonomy, 2019 to 2023
    10.2. Market Size Value (US$ Million) & Volume (Units) Forecast By Market Taxonomy, 2024 to 2034
        10.2.1. By Country
            10.2.1.1. Germany
            10.2.1.2. UK
            10.2.1.3. France
            10.2.1.4. Spain
            10.2.1.5. Italy
            10.2.1.6. Rest of Western Europe
        10.2.2. By Type
        10.2.3. By End User
    10.3. Market Attractiveness Analysis
        10.3.1. By Country
        10.3.2. By Type
        10.3.3. By End User
    10.4. Key Takeaways
11. Eastern Europe Market Analysis 2019 to 2023 and Forecast 2024 to 2034, By Country
    11.1. Historical Market Size Value (US$ Million) & Volume (Units) Trend Analysis By Market Taxonomy, 2019 to 2023
    11.2. Market Size Value (US$ Million) & Volume (Units) Forecast By Market Taxonomy, 2024 to 2034
        11.2.1. By Country
            11.2.1.1. Poland
            11.2.1.2. Russia
            11.2.1.3. Czech Republic
            11.2.1.4. Romania
            11.2.1.5. Rest of Eastern Europe
        11.2.2. By Type
        11.2.3. By End User
    11.3. Market Attractiveness Analysis
        11.3.1. By Country
        11.3.2. By Type
        11.3.3. By End User
    11.4. Key Takeaways
12. South Asia and Pacific Market Analysis 2019 to 2023 and Forecast 2024 to 2034, By Country
    12.1. Historical Market Size Value (US$ Million) & Volume (Units) Trend Analysis By Market Taxonomy, 2019 to 2023
    12.2. Market Size Value (US$ Million) & Volume (Units) Forecast By Market Taxonomy, 2024 to 2034
        12.2.1. By Country
            12.2.1.1. India
            12.2.1.2. Bangladesh
            12.2.1.3. Australia
            12.2.1.4. New Zealand
            12.2.1.5. Rest of South Asia and Pacific
        12.2.2. By Type
        12.2.3. By End User
    12.3. Market Attractiveness Analysis
        12.3.1. By Country
        12.3.2. By Type
        12.3.3. By End User
    12.4. Key Takeaways
13. East Asia Market Analysis 2019 to 2023 and Forecast 2024 to 2034, By Country
    13.1. Historical Market Size Value (US$ Million) & Volume (Units) Trend Analysis By Market Taxonomy, 2019 to 2023
    13.2. Market Size Value (US$ Million) & Volume (Units) Forecast By Market Taxonomy, 2024 to 2034
        13.2.1. By Country
            13.2.1.1. China
            13.2.1.2. Japan
            13.2.1.3. South Korea
        13.2.2. By Type
        13.2.3. By End User
    13.3. Market Attractiveness Analysis
        13.3.1. By Country
        13.3.2. By Type
        13.3.3. By End User
    13.4. Key Takeaways
14. Middle East and Africa Market Analysis 2019 to 2023 and Forecast 2024 to 2034, By Country
    14.1. Historical Market Size Value (US$ Million) & Volume (Units) Trend Analysis By Market Taxonomy, 2019 to 2023
    14.2. Market Size Value (US$ Million) & Volume (Units) Forecast By Market Taxonomy, 2024 to 2034
        14.2.1. By Country
            14.2.1.1. GCC Countries
            14.2.1.2. South Africa
            14.2.1.3. Israel
            14.2.1.4. Rest of MEA
        14.2.2. By Type
        14.2.3. By End User
    14.3. Market Attractiveness Analysis
        14.3.1. By Country
        14.3.2. By Type
        14.3.3. By End User
    14.4. Key Takeaways
15. Key Countries Market Analysis
    15.1. USA
        15.1.1. Pricing Analysis
        15.1.2. Market Share Analysis, 2023
            15.1.2.1. By Type
            15.1.2.2. By End User
    15.2. Canada
        15.2.1. Pricing Analysis
        15.2.2. Market Share Analysis, 2023
            15.2.2.1. By Type
            15.2.2.2. By End User
    15.3. Brazil
        15.3.1. Pricing Analysis
        15.3.2. Market Share Analysis, 2023
            15.3.2.1. By Type
            15.3.2.2. By End User
    15.4. Mexico
        15.4.1. Pricing Analysis
        15.4.2. Market Share Analysis, 2023
            15.4.2.1. By Type
            15.4.2.2. By End User
    15.5. Germany
        15.5.1. Pricing Analysis
        15.5.2. Market Share Analysis, 2023
            15.5.2.1. By Type
            15.5.2.2. By End User
    15.6. UK
        15.6.1. Pricing Analysis
        15.6.2. Market Share Analysis, 2023
            15.6.2.1. By Type
            15.6.2.2. By End User
    15.7. France
        15.7.1. Pricing Analysis
        15.7.2. Market Share Analysis, 2023
            15.7.2.1. By Type
            15.7.2.2. By End User
    15.8. Spain
        15.8.1. Pricing Analysis
        15.8.2. Market Share Analysis, 2023
            15.8.2.1. By Type
            15.8.2.2. By End User
    15.9. Italy
        15.9.1. Pricing Analysis
        15.9.2. Market Share Analysis, 2023
            15.9.2.1. By Type
            15.9.2.2. By End User
    15.10. Poland
        15.10.1. Pricing Analysis
        15.10.2. Market Share Analysis, 2023
            15.10.2.1. By Type
            15.10.2.2. By End User
    15.11. Russia
        15.11.1. Pricing Analysis
        15.11.2. Market Share Analysis, 2023
            15.11.2.1. By Type
            15.11.2.2. By End User
    15.12. Czech Republic
        15.12.1. Pricing Analysis
        15.12.2. Market Share Analysis, 2023
            15.12.2.1. By Type
            15.12.2.2. By End User
    15.13. Romania
        15.13.1. Pricing Analysis
        15.13.2. Market Share Analysis, 2023
            15.13.2.1. By Type
            15.13.2.2. By End User
    15.14. India
        15.14.1. Pricing Analysis
        15.14.2. Market Share Analysis, 2023
            15.14.2.1. By Type
            15.14.2.2. By End User
    15.15. Bangladesh
        15.15.1. Pricing Analysis
        15.15.2. Market Share Analysis, 2023
            15.15.2.1. By Type
            15.15.2.2. By End User
    15.16. Australia
        15.16.1. Pricing Analysis
        15.16.2. Market Share Analysis, 2023
            15.16.2.1. By Type
            15.16.2.2. By End User
    15.17. New Zealand
        15.17.1. Pricing Analysis
        15.17.2. Market Share Analysis, 2023
            15.17.2.1. By Type
            15.17.2.2. By End User
    15.18. China
        15.18.1. Pricing Analysis
        15.18.2. Market Share Analysis, 2023
            15.18.2.1. By Type
            15.18.2.2. By End User
    15.19. Japan
        15.19.1. Pricing Analysis
        15.19.2. Market Share Analysis, 2023
            15.19.2.1. By Type
            15.19.2.2. By End User
    15.20. South Korea
        15.20.1. Pricing Analysis
        15.20.2. Market Share Analysis, 2023
            15.20.2.1. By Type
            15.20.2.2. By End User
    15.21. GCC Countries
        15.21.1. Pricing Analysis
        15.21.2. Market Share Analysis, 2023
            15.21.2.1. By Type
            15.21.2.2. By End User
    15.22. South Africa
        15.22.1. Pricing Analysis
        15.22.2. Market Share Analysis, 2023
            15.22.2.1. By Type
            15.22.2.2. By End User
    15.23. Israel
        15.23.1. Pricing Analysis
        15.23.2. Market Share Analysis, 2023
            15.23.2.1. By Type
            15.23.2.2. By End User
16. Market Structure Analysis
    16.1. Competition Dashboard
    16.2. Competition Benchmarking
    16.3. Market Share Analysis of Top Players
        16.3.1. By Regional
        16.3.2. By Type
        16.3.3. By End User
17. Competition Analysis
    17.1. Competition Deep Dive
        17.1.1. The Kinki Sharyo Co., Ltd.
            17.1.1.1. Overview
            17.1.1.2. Product Portfolio
            17.1.1.3. Profitability by Market Segments
            17.1.1.4. Sales Footprint
            17.1.1.5. Strategy Overview
                17.1.1.5.1. Marketing Strategy
                17.1.1.5.2. Product Strategy
                17.1.1.5.3. Channel Strategy
        17.1.2. Alstom SA
            17.1.2.1. Overview
            17.1.2.2. Product Portfolio
            17.1.2.3. Profitability by Market Segments
            17.1.2.4. Sales Footprint
            17.1.2.5. Strategy Overview
                17.1.2.5.1. Marketing Strategy
                17.1.2.5.2. Product Strategy
                17.1.2.5.3. Channel Strategy
        17.1.3. Siemens AG
            17.1.3.1. Overview
            17.1.3.2. Product Portfolio
            17.1.3.3. Profitability by Market Segments
            17.1.3.4. Sales Footprint
            17.1.3.5. Strategy Overview
                17.1.3.5.1. Marketing Strategy
                17.1.3.5.2. Product Strategy
                17.1.3.5.3. Channel Strategy
        17.1.4. GE Transportation
            17.1.4.1. Overview
            17.1.4.2. Product Portfolio
            17.1.4.3. Profitability by Market Segments
            17.1.4.4. Sales Footprint
            17.1.4.5. Strategy Overview
                17.1.4.5.1. Marketing Strategy
                17.1.4.5.2. Product Strategy
                17.1.4.5.3. Channel Strategy
        17.1.5. IHI Corporation
            17.1.5.1. Overview
            17.1.5.2. Product Portfolio
            17.1.5.3. Profitability by Market Segments
            17.1.5.4. Sales Footprint
            17.1.5.5. Strategy Overview
                17.1.5.5.1. Marketing Strategy
                17.1.5.5.2. Product Strategy
                17.1.5.5.3. Channel Strategy
        17.1.6. PPF Group N.V.
            17.1.6.1. Overview
            17.1.6.2. Product Portfolio
            17.1.6.3. Profitability by Market Segments
            17.1.6.4. Sales Footprint
            17.1.6.5. Strategy Overview
                17.1.6.5.1. Marketing Strategy
                17.1.6.5.2. Product Strategy
                17.1.6.5.3. Channel Strategy
        17.1.7. Stadler Rail AG
            17.1.7.1. Overview
            17.1.7.2. Product Portfolio
            17.1.7.3. Profitability by Market Segments
            17.1.7.4. Sales Footprint
            17.1.7.5. Strategy Overview
                17.1.7.5.1. Marketing Strategy
                17.1.7.5.2. Product Strategy
                17.1.7.5.3. Channel Strategy
        17.1.8. Tatravoganka A.S. Poprad
            17.1.8.1. Overview
            17.1.8.2. Product Portfolio
            17.1.8.3. Profitability by Market Segments
            17.1.8.4. Sales Footprint
            17.1.8.5. Strategy Overview
                17.1.8.5.1. Marketing Strategy
                17.1.8.5.2. Product Strategy
                17.1.8.5.3. Channel Strategy
        17.1.9. Wabtech Corporation
            17.1.9.1. Overview
            17.1.9.2. Product Portfolio
            17.1.9.3. Profitability by Market Segments
            17.1.9.4. Sales Footprint
            17.1.9.5. Strategy Overview
                17.1.9.5.1. Marketing Strategy
                17.1.9.5.2. Product Strategy
                17.1.9.5.3. Channel Strategy
        17.1.10. Kawasaki Heavy Industries Ltd.
            17.1.10.1. Overview
            17.1.10.2. Product Portfolio
            17.1.10.3. Profitability by Market Segments
            17.1.10.4. Sales Footprint
            17.1.10.5. Strategy Overview
                17.1.10.5.1. Marketing Strategy
                17.1.10.5.2. Product Strategy
                17.1.10.5.3. Channel Strategy
        17.1.11. The Greenbrier Companies, Inc.
            17.1.11.1. Overview
            17.1.11.2. Product Portfolio
            17.1.11.3. Profitability by Market Segments
            17.1.11.4. Sales Footprint
            17.1.11.5. Strategy Overview
                17.1.11.5.1. Marketing Strategy
                17.1.11.5.2. Product Strategy
                17.1.11.5.3. Channel Strategy
18. Assumptions & Acronyms Used
19. Research Methodology
Recommendations

Automotive

Locomotive Lighting Batteries Market

November 2024

REP-GB-12192

Upcoming

Automotive

Locomotive Pantographs Market

December 2022

REP-GB-16119

335 pages

Explore Automotive Insights

View Reports
Future Market Insights

Railway Rolling Stock Market

Schedule a Call