Reports

- Global Locations -

Headquarters

Future Market Insights, Inc.

Christiana Corporate, 200
Continental Drive, Suite 401,
Newark, Delaware - 19713,
United States

T: +1-845-579-5705

Americas

Future Market Insights, Inc.

616 Corporate Way, Suite 2-9018,
Valley Cottage, NY 10989, United States

T: +1-347-918-3531

MEA

Future Market Insights

1602-6 Jumeirah Bay X2 Tower, Plot No: JLT-PH2-X2A,
Jumeirah Lakes Towers, Dubai,
United Arab Emirates

Europe

Future Market Insights

3rd Floor, 207 Regent Street,
W1B 3HH London
United Kingdom

T: + 44 (0) 20 8123 9659
D: +44 (0) 20 3287 4268

Asia Pacific

Future Market Insights

IndiaLand Global Tech Park, Unit UG-1, Behind Grand HighStreet, Phase 1, Hinjawadi, MH, Pune – 411057, India

Railway Control Stands Outlook (2023 to 2033)

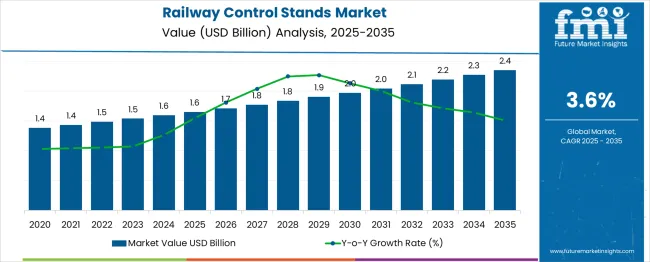
The global railway control stand is valued at US$ 1537.3 million in 2023. It is projected to grow at a moderate CAGR of 3.6% during the forecast period, reaching a value of US$ 2189.6 million by 2033.

Railway control stands can be defined as a train-borne distributed control system, which comprises software, computer devices, human-machine interface, digital and analog input/output (I/O) capability, and data networks that are connected in a secure and fault-resistant manner.

In addition to providing communication interfaces with other train systems, the control system also provides telecommunications with other supporting systems. In addition, for safety reasons, railway systems are physically separated from the Wi-Fi networks available for passengers. On top of that, railway control stands to serve as a communication, control, and train management system for all types of vehicles, including metros, trams, and passenger coaches.

Key Takeaways:

  • The global railway control stands market is projected to reach US$ 2189.6 million by 2033.
  • The market witnessed a 1.9% CAGR between 2018 and 2022.
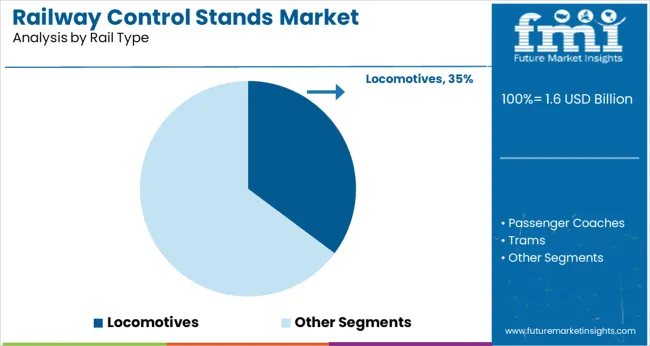
  • Under the rail type, the freight wagon dominates the market with a market share of 35.6% in the forecasted period.
  • Based on the region, demand for railway control stands is expected to capture the market share of 18.4% in the U.S.
Attribute Details
Railway Control Stands Size Value in 2023 US$ 1537.3 million
Railway Control Stands Forecast Value in 2033 US$ 2189.6 million
Railway Control Stands CAGR Global Growth Rate (2023 to 2033) 3.6%

In addition to increased budget allocations for railway development, there is a surge in demand for a secure, safe, and efficient transport system, which drives the growth of the global railway control stands market.

Moreover, the increasing use of public transport services as a solution to minimize traffic congestion is also expected to contribute to the growth of the market in the coming years. Despite this, high capital requirements hinder the market's growth. Rapid improvement in railway infrastructure in developing countries is expected to provide players in the market with significant growth opportunities.

Don't pay for what you don't need

Customize your report by selecting specific countries or regions and save 30%!

2018 to 2022 Railway Control Stands Outlook Compared to 2023 to 2033 Forecast

By 2033, the railway control stands are predicted by FMI to reach over US$ 2189.6 million. It is estimated that the global railway control stands market share increased by 3.6% in the first half of 2023, which is a market share valued at US$ 1537.3 million. Though not equally distributed throughout all regions, this growth is stronger in developing markets. From 2018 to 2022, the railway control stands market was predicted to expand at a sluggish CAGR of 1.9%.

There is an increasing trend among governments across the world to invest in the improvement of railway infrastructure through the integration of new technologies. These efforts are aimed at improving operational efficiency. In addition, governments are developing technologically advanced trains and train monitoring systems.

However, installation and maintenance costs associated with railway control stands are expected to constrain market growth. The complexity of railway control and management solutions is also expected to slow adoption in the coming years.

Competitive Analysis of the Adjacent Railway Control Stands Market

Railway Control Stands Market:

Attributes Railway Control Stands Market
CAGR (2023 to 2033) 3.6%
Market Value (2033) US$ 1834.67 million
Growth Factor Increasing investments in railway infrastructure development to boost sales of railway control stands.
Opportunity The demand and preference for safe, secure, and efficient transportation are creating opportunities for the railway control stands market.

Train Control and Management Systems Market:

Attributes Train Control and Management Systems Market
CAGR (2023 to 2033) 2.1%
Market Value (2033) US$ 5460 million
Growth Factor Increasing investments & supportive government initiatives to boost growth.
Opportunity Increasing investments in emerging regions to showcase productive future opportunities for key players.

Railway Telematics Market:

Attributes Railway Telematics Market
CAGR (2023 to 2033) 7.5%
Market Value (2033) US$ 18900 million
Growth Factor The growing demand for the digitalization of railcar tracking and increasing rail freight transportation to boost sales.
Opportunity Government authorities globally are investing in various smart city projects to improve transportation infrastructure, further creating opportunities.
Nikhil Kaitwade
Nikhil Kaitwade

Principal Consultant

Talk to Analyst

Find your sweet spots for generating winning opportunities in this market.

Comprehensive Analysis of the Drivers Affecting the Railway Control Stands Market

  • Increase in the Allocation of Budget for the Development of Railways

In emerging economies such as India and China, increased budgets are allocated to the development of their railway infrastructure. Accordingly, India allocated US$21.2 billion for its railway sector in 2018 compared to US$18.8 billion in 2017, an increase of 13%. Similarly, several countries around the world are continuously investing in their rail infrastructure and deploying the latest technologies.

For instance, in Saskatchewan, Canadian National Railways (CN) plans to invest US$2.92 billion to enhance railway infrastructure. As a result, budget allocation is a major factor propelling the growth of the railway sector, which, in turn, is boosting the market for railway control stands.

  • Technological Advancement

The advent of technological advancements has resulted in the incorporation of high-speed rails and metro systems throughout the world. Some rails run at much higher speeds than traditional rails, with some of them being capable of reaching speeds of 200 km/hr. These rails operate at much higher speeds than traditional rails.

Owing to these mass rapid transit systems that can operate at high speeds, there seems to be an increasing concern about human safety and security. This has created a need for efficient control stands in these rail systems, resulting in a growing market for railway control stands.

  • Rapid Urbanization

It is a fact that rapid urbanization has improved the quality of living in many countries around the globe, especially those in developing countries. As urbanization grows in number and importance, the need for fast and efficient modes of transportation has increased. For this reason, governments around the world have been adopting high-speed trains and metros to provide mass transit services that are both time-efficient and cost-effective.

The railway control stand is an integral component of these railway systems. The government's initiatives to either embrace railway control solutions for their new rapid transit systems or to upgrade their current control systems to include these solutions have a beneficial impact on the market growth for railway control stands.

Identifying the Restraints of the Railway Control Stands Market

High Capital Expenditures, High Infrastructure, and Maintenance Costs

Installation of railway control stands is a complex process, as it requires the integration of several hardware components according to their technological compatibility. This installation or integration also requires adequate infrastructure. In addition to the infrastructure cost, maintenance costs are quite high for these systems. As a result, the high infrastructure and maintenance costs of these systems limit their adoption to some extent, limiting their market growth.

As an example, Indian railways announced in April 2018 that it was ready to launch the country's first 12,000 horsepower (HP) electric locomotive. The total cost of rolling out 800 high-horsepower locomotives over 11 years is expected to be around $200 billion, with the average locomotive costing $250 million. As a result, the railway control stands market is hindered by the high capital requirements associated with building and maintaining the train network.

Get the data you need at a Fraction of the cost

Personalize your report by choosing insights you need
and save 40%!

Analyzing the Opportunities of the Railway Control Stands Market

An Increase in Demand for a Secure, Safe, and Efficient Transport System

In addition to being secure and cost-effective, railway transportation is the fastest-growing mode of transportation. The newest trains have cameras, sensors, and communication devices on board. Additionally, underground or ground-level trains are highly secured by fences and walls to prevent trespassing in most locations, promoting the growth of this market.

In addition, today's trains consume less energy due to their advanced acceleration, traction, and braking systems. This results in the reduction of energy consumption by around 30% based on the degree of automation. Additionally, these trains offer a flexible way to coordinate in terms of frequency, which raises the performance of the system overall and supports the expansion of the railway sector. As a result, the demand and preference for safe, secure, and efficient transportation are creating opportunities for the railway control stands market.

Category-wise Insights

By Rail Type: Freight Wagons Sector is Set to Rise

Based on rail type, the market is categorized into passenger coaches, trams, locomotives, metros & freight wagons. The freight wagons segment is expected to account for the largest market share of 35.6% during the forecast period.

Governments around the world are promoting public transportation, which is expected to have a significant impact on freight wagon growth. A variety of factors are supporting the growth of the global freight wagons market, from increasing government initiatives to increased preference for public transportation.

Region-wise Insights

The Largest Market Share for Railway Control Stands Market belongs to North America

North American railway control stands accounted for the largest share. Increasing customer demands for comfort and safety have led OEMs based in North America to produce locomotives for a wide range of trains, including light rail, tramways, metros, and conventional trains. Many emerging players offer advanced railway control stations in the region. Thermo King, a railway system manufacturer based in the USA, delivers HVAC systems that can remove viruses from the air in driver cabins.

Due to the huge area of these countries and the long distance traveled for goods and passengers, diesel locomotives are mostly used in the USA and Canada. As a result, electric locomotives would incur significantly higher infrastructure costs. In the United States, rolling stock is mostly used for freight transportation, while airlines are primarily used for passenger transportation.

Strong Asia Pacific Dominance in the Railway Control Stands Market

Asia Pacific region is projected to emerge as a promising market for railway control stands across the forecast period. This region is experiencing a high level of demand due to increased investments in railway infrastructure by economies such as India, China, and Japan. Increasing railway budgets in these economies may also favor shipments of railway control stands. Increasing urbanization in the aforementioned regions is also expected to positively influence sales of railway control stands.

Governments in developing countries are making significant investments to meet the latest end-use requirements for autonomous trains. As an example, India invested US$1.97 billion in 2018 toward infrastructure development to meet the latest automation demand and is expected to invest a further US$777.73 billion by 2022 to fulfill the required infrastructure requirements, which include railway infrastructure development. This is anticipated to offer numerous opportunities for railway control stands in the country.
Country-wise Insights

Improvement in Railway Infrastructure in Diverse Countries

Countries Statistics
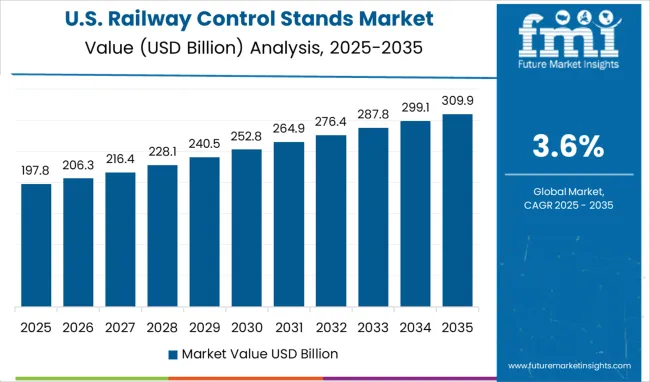
United States The railway control stands in the USA holds the maximum number of shares and has registered a market share of 18.4%. Recent years have seen the development, expansion, and modernization of existing transportation modes undertaken by the USA government. USA railways are being improved with enhanced safety systems and funding is being allocated to complete pending projects to promote rail passenger transportation. The railway system may be redesigned with the help of US$ 80 billion in federal funding as part of the USA President’s US$ 2.3 trillion infrastructure modernization plan.
Germany Europe is identified to hold a significant market share of 4.8% in the railway control stands. In Germany, urban planners and local governments are merging rapid transit and tramway infrastructure with existing infrastructure. Additionally, commuters are seeking eco-friendly, reliable, and cost-effective transportation options. Germany, for example, is actively promoting the use of rapid transit systems to reduce traffic congestion.
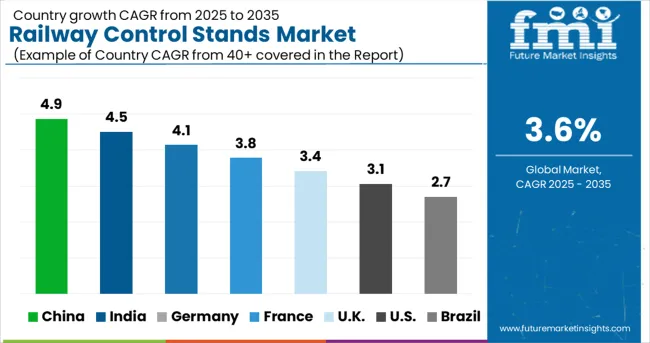
China China is projected to advance at a moderate pace, registering a CAGR of 4.2%. China has witnessed the strongest growth among the other world leaders, with CRCC, CRSC, and CREC capturing 20-25% of the global signaling, rail control, and electrification market. A major reason for this expansion is the expansion of the railway network, which has grown from 75,000 km in 2005 to 150,000 km by 2020.

Start-up Ecosystem

Numerous Opportunities for Emerging Players in Railway Control Stands Dynamics

A significant growth opportunity exists for the emerging players operating in the global market due to the improvement in infrastructure in developing nations and the growth in mining and industrial activities. Moreover, through the introduction of enhanced products, new entrants to railway control stands are gaining a competitive advantage and leveraging advancements in technology.

To remain competitive, these firms invest continually in research and development activities to keep up with consumer preferences and end-use industry requirements. Efforts are being made to strengthen their foothold in the industry. In addition to increasing their visibility within the forum, this will also enhance the further development of the railway control stands.
Competitive Landscape

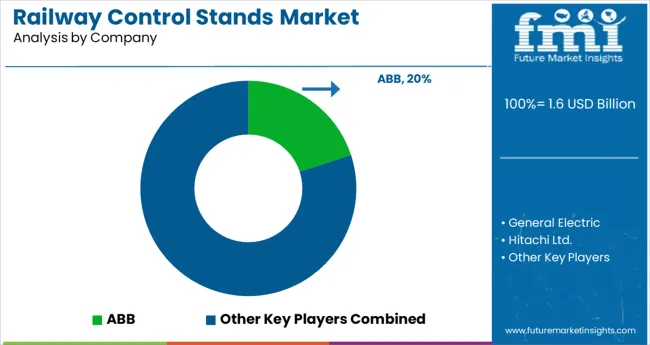
Key players operating the global railway control stand market include

  • Asea Brown Boveri (ABB)
  • General Electric
  • Hitachi Ltd.
  • Mitsubishi Electric Corporation
  • Alstom SA
  • Bombardier Inc.
  • MEN Mikro Elektronik GmbH
  • Siemens AG
  • DEUTA-WERKE GmbH
  • EKE Group
  • Strukton Rail
  • Toshiba Corporation
  • Thales Group

Key Developments for Railway Control Stands Market

  • In February 2022, the CRRC developed a 3000 hp permanent magnet hybrid shunting locomotive that reached 2,000 kilometers without incident. Consumers appreciated the locomotive's low energy consumption and environmental protection as compared to conventional shunting diesel locomotives.
  • With the launch of PTC (Positive Train Control), railcar telematics, and dispatching systems in May 2022, Hitachi Rail has introduced several innovations in automation and digitalization.
  • Siemens developed the first electrically controlled friction brake for rail vehicles in January 2022 called the air-free brake system, also known as an electronic friction brake system. There is no need for compressed air in the braking system. This redesigned brake offers many technological advantages, as well as a decrease in vehicle weight and an increase in vehicle speed.

Scope of Report

Attribute Details
Forecast Period 2023 to 2033
Historical Data Available for 2018 to 2022
Market Analysis US$ billion for Value and MT for Volume
Key Regions Covered North America, Latin America, Europe, East Asia, South Asia, Oceania, and the Middle East & Africa
Key Countries Covered USA, Canada, Brazil, Mexico, Chile, Peru, Germany, United Kingdom, Spain, Italy, France, Russia, Poland, China, India, Japan, Australia, New Zealand, GCC Countries, North Africa, South Africa, and Turkey
Key Segments Covered
  • Rail Type
  • System Type
  • Region
Key Companies Profiled
  • Asea Brown Boveri (ABB)
  • General Electric
  • Hitachi Ltd.
  • Mitsubishi Electric Corporation
  • Alstom SA
  • Bombardier Inc.
  • MEN Mikro Elektronik GmbH
  • Siemens AG
  • DEUTA-WERKE GmbH
  • EKE Group
  • Strukton Rail
  • Toshiba Corporation
  • Thales Group
Report Coverage Market Forecast, Company Share Analysis, Competition Intelligence, DROT Analysis, Market Dynamics and Challenges, and Strategic Growth Initiatives
Customization & Pricing Available upon Request

Railway Control Stands by Category

By Rail Type, the Railway Control Stands Market is Segmented as:

  • Passenger Coaches
  • Trams
  • Locomotives
  • Metros
  • Freight Wagon

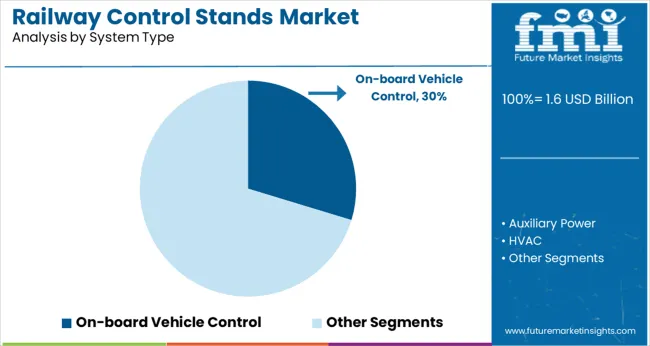
By System Type, the Railway Control Stands Market is Segmented as:

  • Auxiliary Power
  • HVAC
  • Propulsion
  • On-board Vehicle Control
  • Train Information
  • Train Safety

By Region, Railway Control Stands are Segmented as:

  • North America
  • Latin America
  • Europe
  • The Middle East and Africa
  • East Asia

Frequently Asked Questions

Which Region Dominates the Market for Railway Control Stands?

North America dominates the market for railway control stands.

How the Competition is Structured in the Global Railway Control Stands?

The global railway control stands market is highly fragmented with the presence of various leading and emerging players including EKE Group, ABB, General Electric, etc.

What is the Market Scenario of Railway Control Stands?

The railway control stand is expected to reach a value of US$ 2189.6 million by 2033.

At what rate is global Railway Control Stands expected to grow?

The railway control stand is expected to increase at a CAGR of around 3.6% over the forecast period.

Table of Content

1. Executive Summary

    1.1. Global Market Outlook

    1.2. Demand-side Trends

    1.3. Supply-side Trends

    1.4. Technology Roadmap Analysis

    1.5. Analysis and Recommendations

2. Market Overview

    2.1. Market Coverage / Taxonomy

    2.2. Market Definition / Scope / Limitations

3. Market Background

    3.1. Market Dynamics

        3.1.1. Drivers

        3.1.2. Restraints

        3.1.3. Opportunity

        3.1.4. Trends

    3.2. Scenario Forecast

        3.2.1. Demand in Optimistic Scenario

        3.2.2. Demand in Likely Scenario

        3.2.3. Demand in Conservative Scenario

    3.3. Opportunity Map Analysis

    3.4. Product Life Cycle Analysis

    3.5. Supply Chain Analysis

        3.5.1. Supply Side Participants and their Roles

            3.5.1.1. Producers

            3.5.1.2. Mid-Level Participants (Traders/ Agents/ Brokers)

            3.5.1.3. Wholesalers and Distributors

        3.5.2. Value Added and Value Created at Node in the Supply Chain

        3.5.3. List of Raw Material Suppliers

        3.5.4. List of Existing and Potential Buyer’s

    3.6. Investment Feasibility Matrix

    3.7. Value Chain Analysis

        3.7.1. Profit Margin Analysis

        3.7.2. Wholesalers and Distributors

        3.7.3. Retailers

    3.8. PESTLE and Porter’s Analysis

    3.9. Regulatory Landscape

        3.9.1. By Key Regions

        3.9.2. By Key Countries

    3.10. Regional Parent Market Outlook

    3.11. Production and Consumption Statistics

    3.12. Import and Export Statistics

4. Global Market Analysis 2018 to 2022 and Forecast, 2023 to 2033

    4.1. Historical Market Size Value (US$ million) & Volume (Units) Analysis, 2018 to 2022

    4.2. Current and Future Market Size Value (US$ million) & Volume (Units) Projections, 2023 to 2033

        4.2.1. Y-o-Y Growth Trend Analysis

        4.2.2. Absolute $ Opportunity Analysis

5. Global Market Analysis 2018 to 2022 and Forecast 2023 to 2033, By Train Type

    5.1. Introduction / Key Findings

    5.2. Historical Market Size Value (US$ million) & Volume (Units) Analysis By Train Type, 2018 to 2022

    5.3. Current and Future Market Size Value (US$ million) & Volume (Units) Analysis and Forecast By Train Type, 2023 to 2033

        5.3.1. Passenger Train

        5.3.2. Freight Train

    5.4. Y-o-Y Growth Trend Analysis By Train Type, 2018 to 2022

    5.5. Absolute $ Opportunity Analysis By Train Type, 2023 to 2033

6. Global Market Analysis 2018 to 2022 and Forecast 2023 to 2033, By System Type

    6.1. Introduction / Key Findings

    6.2. Historical Market Size Value (US$ million) & Volume (Units) Analysis By System Type, 2018 to 2022

    6.3. Current and Future Market Size Value (US$ million) & Volume (Units) Analysis and Forecast By System Type, 2023 to 2033

        6.3.1. Engine Functional Control System

        6.3.2. Brake Functional Control System

    6.4. Y-o-Y Growth Trend Analysis By System Type, 2018 to 2022

    6.5. Absolute $ Opportunity Analysis By System Type, 2023 to 2033

7. Global Market Analysis 2018 to 2022 and Forecast 2023 to 2033, By Region

    7.1. Introduction

    7.2. Historical Market Size Value (US$ million) & Volume (Units) Analysis By Region, 2018 to 2022

    7.3. Current Market Size Value (US$ million) & Volume (Units) Analysis and Forecast By Region, 2023 to 2033

        7.3.1. North America

        7.3.2. Latin America

        7.3.3. Europe

        7.3.4. Asia Pacific

        7.3.5. Middle East and Africa (MEA)

    7.4. Market Attractiveness Analysis By Region

8. North America Market Analysis 2018 to 2022 and Forecast 2023 to 2033, By Country

    8.1. Historical Market Size Value (US$ million) & Volume (Units) Trend Analysis By Market Taxonomy, 2018 to 2022

    8.2. Market Size Value (US$ million) & Volume (Units) Forecast By Market Taxonomy, 2023 to 2033

        8.2.1. By Country

            8.2.1.1. U.S.

            8.2.1.2. Canada

        8.2.2. By Train Type

        8.2.3. By System Type

    8.3. Market Attractiveness Analysis

        8.3.1. By Country

        8.3.2. By Train Type

        8.3.3. By System Type

    8.4. Key Takeaways

9. Latin America Market Analysis 2018 to 2022 and Forecast 2023 to 2033, By Country

    9.1. Historical Market Size Value (US$ million) & Volume (Units) Trend Analysis By Market Taxonomy, 2018 to 2022

    9.2. Market Size Value (US$ million) & Volume (Units) Forecast By Market Taxonomy, 2023 to 2033

        9.2.1. By Country

            9.2.1.1. Brazil

            9.2.1.2. Mexico

            9.2.1.3. Rest of Latin America

        9.2.2. By Train Type

        9.2.3. By System Type

    9.3. Market Attractiveness Analysis

        9.3.1. By Country

        9.3.2. By Train Type

        9.3.3. By System Type

    9.4. Key Takeaways

10. Europe Market Analysis 2018 to 2022 and Forecast 2023 to 2033, By Country

    10.1. Historical Market Size Value (US$ million) & Volume (Units) Trend Analysis By Market Taxonomy, 2018 to 2022

    10.2. Market Size Value (US$ million) & Volume (Units) Forecast By Market Taxonomy, 2023 to 2033

        10.2.1. By Country

            10.2.1.1. Germany

            10.2.1.2. U.K.

            10.2.1.3. France

            10.2.1.4. Spain

            10.2.1.5. Italy

            10.2.1.6. Rest of Europe

        10.2.2. By Train Type

        10.2.3. By System Type

    10.3. Market Attractiveness Analysis

        10.3.1. By Country

        10.3.2. By Train Type

        10.3.3. By System Type

    10.4. Key Takeaways

11. Asia Pacific Market Analysis 2018 to 2022 and Forecast 2023 to 2033, By Country

    11.1. Historical Market Size Value (US$ million) & Volume (Units) Trend Analysis By Market Taxonomy, 2018 to 2022

    11.2. Market Size Value (US$ million) & Volume (Units) Forecast By Market Taxonomy, 2023 to 2033

        11.2.1. By Country

            11.2.1.1. China

            11.2.1.2. Japan

            11.2.1.3. South Korea

            11.2.1.4. Singapore

            11.2.1.5. Thailand

            11.2.1.6. Indonesia

            11.2.1.7. Australia

            11.2.1.8. New Zealand

            11.2.1.9. Rest of Asia Pacific

        11.2.2. By Train Type

        11.2.3. By System Type

    11.3. Market Attractiveness Analysis

        11.3.1. By Country

        11.3.2. By Train Type

        11.3.3. By System Type

    11.4. Key Takeaways

12. MEA Market Analysis 2018 to 2022 and Forecast 2023 to 2033, By Country

    12.1. Historical Market Size Value (US$ million) & Volume (Units) Trend Analysis By Market Taxonomy, 2018 to 2022

    12.2. Market Size Value (US$ million) & Volume (Units) Forecast By Market Taxonomy, 2023 to 2033

        12.2.1. By Country

            12.2.1.1. GCC Countries

            12.2.1.2. South Africa

            12.2.1.3. Israel

            12.2.1.4. Rest of MEA

        12.2.2. By Train Type

        12.2.3. By System Type

    12.3. Market Attractiveness Analysis

        12.3.1. By Country

        12.3.2. By Train Type

        12.3.3. By System Type

    12.4. Key Takeaways

13. Key Countries Market Analysis

    13.1. U.S.

        13.1.1. Pricing Analysis

        13.1.2. Market Share Analysis, 2022

            13.1.2.1. By Train Type

            13.1.2.2. By System Type

    13.2. Canada

        13.2.1. Pricing Analysis

        13.2.2. Market Share Analysis, 2022

            13.2.2.1. By Train Type

            13.2.2.2. By System Type

    13.3. Brazil

        13.3.1. Pricing Analysis

        13.3.2. Market Share Analysis, 2022

            13.3.2.1. By Train Type

            13.3.2.2. By System Type

    13.4. Mexico

        13.4.1. Pricing Analysis

        13.4.2. Market Share Analysis, 2022

            13.4.2.1. By Train Type

            13.4.2.2. By System Type

    13.5. Germany

        13.5.1. Pricing Analysis

        13.5.2. Market Share Analysis, 2022

            13.5.2.1. By Train Type

            13.5.2.2. By System Type

    13.6. U.K.

        13.6.1. Pricing Analysis

        13.6.2. Market Share Analysis, 2022

            13.6.2.1. By Train Type

            13.6.2.2. By System Type

    13.7. France

        13.7.1. Pricing Analysis

        13.7.2. Market Share Analysis, 2022

            13.7.2.1. By Train Type

            13.7.2.2. By System Type

    13.8. Spain

        13.8.1. Pricing Analysis

        13.8.2. Market Share Analysis, 2022

            13.8.2.1. By Train Type

            13.8.2.2. By System Type

    13.9. Italy

        13.9.1. Pricing Analysis

        13.9.2. Market Share Analysis, 2022

            13.9.2.1. By Train Type

            13.9.2.2. By System Type

    13.10. China

        13.10.1. Pricing Analysis

        13.10.2. Market Share Analysis, 2022

            13.10.2.1. By Train Type

            13.10.2.2. By System Type

    13.11. Japan

        13.11.1. Pricing Analysis

        13.11.2. Market Share Analysis, 2022

            13.11.2.1. By Train Type

            13.11.2.2. By System Type

    13.12. South Korea

        13.12.1. Pricing Analysis

        13.12.2. Market Share Analysis, 2022

            13.12.2.1. By Train Type

            13.12.2.2. By System Type

    13.13. Singapore

        13.13.1. Pricing Analysis

        13.13.2. Market Share Analysis, 2022

            13.13.2.1. By Train Type

            13.13.2.2. By System Type

    13.14. Thailand

        13.14.1. Pricing Analysis

        13.14.2. Market Share Analysis, 2022

            13.14.2.1. By Train Type

            13.14.2.2. By System Type

    13.15. Indonesia

        13.15.1. Pricing Analysis

        13.15.2. Market Share Analysis, 2022

            13.15.2.1. By Train Type

            13.15.2.2. By System Type

    13.16. Australia

        13.16.1. Pricing Analysis

        13.16.2. Market Share Analysis, 2022

            13.16.2.1. By Train Type

            13.16.2.2. By System Type

    13.17. New Zealand

        13.17.1. Pricing Analysis

        13.17.2. Market Share Analysis, 2022

            13.17.2.1. By Train Type

            13.17.2.2. By System Type

    13.18. GCC Countries

        13.18.1. Pricing Analysis

        13.18.2. Market Share Analysis, 2022

            13.18.2.1. By Train Type

            13.18.2.2. By System Type

    13.19. South Africa

        13.19.1. Pricing Analysis

        13.19.2. Market Share Analysis, 2022

            13.19.2.1. By Train Type

            13.19.2.2. By System Type

    13.20. Israel

        13.20.1. Pricing Analysis

        13.20.2. Market Share Analysis, 2022

            13.20.2.1. By Train Type

            13.20.2.2. By System Type

14. Market Structure Analysis

    14.1. Competition Dashboard

    14.2. Competition Benchmarking

    14.3. Market Share Analysis of Top Players

        14.3.1. By Regional

        14.3.2. By Train Type

        14.3.3. By System Type

15. Competition Analysis

    15.1. Competition Deep Dive

        15.1.1. CRRC Corporation Limited

            15.1.1.1. Overview

            15.1.1.2. Product Portfolio

            15.1.1.3. Profitability by Market Segments

            15.1.1.4. Sales Footprint

            15.1.1.5. Strategy Overview

                15.1.1.5.1. Marketing Strategy

                15.1.1.5.2. Product Strategy

                15.1.1.5.3. Channel Strategy

        15.1.2. Siemens AG

            15.1.2.1. Overview

            15.1.2.2. Product Portfolio

            15.1.2.3. Profitability by Market Segments

            15.1.2.4. Sales Footprint

            15.1.2.5. Strategy Overview

                15.1.2.5.1. Marketing Strategy

                15.1.2.5.2. Product Strategy

                15.1.2.5.3. Channel Strategy

        15.1.3. Alstom SA

            15.1.3.1. Overview

            15.1.3.2. Product Portfolio

            15.1.3.3. Profitability by Market Segments

            15.1.3.4. Sales Footprint

            15.1.3.5. Strategy Overview

                15.1.3.5.1. Marketing Strategy

                15.1.3.5.2. Product Strategy

                15.1.3.5.3. Channel Strategy

        15.1.4. Bombardier Inc.

            15.1.4.1. Overview

            15.1.4.2. Product Portfolio

            15.1.4.3. Profitability by Market Segments

            15.1.4.4. Sales Footprint

            15.1.4.5. Strategy Overview

                15.1.4.5.1. Marketing Strategy

                15.1.4.5.2. Product Strategy

                15.1.4.5.3. Channel Strategy

        15.1.5. Hitachi Ltd

            15.1.5.1. Overview

            15.1.5.2. Product Portfolio

            15.1.5.3. Profitability by Market Segments

            15.1.5.4. Sales Footprint

            15.1.5.5. Strategy Overview

                15.1.5.5.1. Marketing Strategy

                15.1.5.5.2. Product Strategy

                15.1.5.5.3. Channel Strategy

        15.1.6. Mitsubishi Electric

            15.1.6.1. Overview

            15.1.6.2. Product Portfolio

            15.1.6.3. Profitability by Market Segments

            15.1.6.4. Sales Footprint

            15.1.6.5. Strategy Overview

                15.1.6.5.1. Marketing Strategy

                15.1.6.5.2. Product Strategy

                15.1.6.5.3. Channel Strategy

        15.1.7. Strukton Rail

            15.1.7.1. Overview

            15.1.7.2. Product Portfolio

            15.1.7.3. Profitability by Market Segments

            15.1.7.4. Sales Footprint

            15.1.7.5. Strategy Overview

                15.1.7.5.1. Marketing Strategy

                15.1.7.5.2. Product Strategy

                15.1.7.5.3. Channel Strategy

        15.1.8. Wabtec Corporation

            15.1.8.1. Overview

            15.1.8.2. Product Portfolio

            15.1.8.3. Profitability by Market Segments

            15.1.8.4. Sales Footprint

            15.1.8.5. Strategy Overview

                15.1.8.5.1. Marketing Strategy

                15.1.8.5.2. Product Strategy

                15.1.8.5.3. Channel Strategy

        15.1.9. Toshiba

            15.1.9.1. Overview

            15.1.9.2. Product Portfolio

            15.1.9.3. Profitability by Market Segments

            15.1.9.4. Sales Footprint

            15.1.9.5. Strategy Overview

                15.1.9.5.1. Marketing Strategy

                15.1.9.5.2. Product Strategy

                15.1.9.5.3. Channel Strategy

        15.1.10. Thales Group

            15.1.10.1. Overview

            15.1.10.2. Product Portfolio

            15.1.10.3. Profitability by Market Segments

            15.1.10.4. Sales Footprint

            15.1.10.5. Strategy Overview

                15.1.10.5.1. Marketing Strategy

                15.1.10.5.2. Product Strategy

                15.1.10.5.3. Channel Strategy

16. Assumptions & Acronyms Used

17. Research Methodology

Don't pay for what you don't need

Customize your report by selecting specific countries or regions and save 30%!

List of Tables

Table 1: Global Market Value (US$ million) Forecast by Region, 2018 to 2033

Table 2: Global Market Volume (Units) Forecast by Region, 2018 to 2033

Table 3: Global Market Value (US$ million) Forecast by Train Type, 2018 to 2033

Table 4: Global Market Volume (Units) Forecast by Train Type, 2018 to 2033

Table 5: Global Market Value (US$ million) Forecast by System Type, 2018 to 2033

Table 6: Global Market Volume (Units) Forecast by System Type, 2018 to 2033

Table 7: North America Market Value (US$ million) Forecast by Country, 2018 to 2033

Table 8: North America Market Volume (Units) Forecast by Country, 2018 to 2033

Table 9: North America Market Value (US$ million) Forecast by Train Type, 2018 to 2033

Table 10: North America Market Volume (Units) Forecast by Train Type, 2018 to 2033

Table 11: North America Market Value (US$ million) Forecast by System Type, 2018 to 2033

Table 12: North America Market Volume (Units) Forecast by System Type, 2018 to 2033

Table 13: Latin America Market Value (US$ million) Forecast by Country, 2018 to 2033

Table 14: Latin America Market Volume (Units) Forecast by Country, 2018 to 2033

Table 15: Latin America Market Value (US$ million) Forecast by Train Type, 2018 to 2033

Table 16: Latin America Market Volume (Units) Forecast by Train Type, 2018 to 2033

Table 17: Latin America Market Value (US$ million) Forecast by System Type, 2018 to 2033

Table 18: Latin America Market Volume (Units) Forecast by System Type, 2018 to 2033

Table 19: Europe Market Value (US$ million) Forecast by Country, 2018 to 2033

Table 20: Europe Market Volume (Units) Forecast by Country, 2018 to 2033

Table 21: Europe Market Value (US$ million) Forecast by Train Type, 2018 to 2033

Table 22: Europe Market Volume (Units) Forecast by Train Type, 2018 to 2033

Table 23: Europe Market Value (US$ million) Forecast by System Type, 2018 to 2033

Table 24: Europe Market Volume (Units) Forecast by System Type, 2018 to 2033

Table 25: Asia Pacific Market Value (US$ million) Forecast by Country, 2018 to 2033

Table 26: Asia Pacific Market Volume (Units) Forecast by Country, 2018 to 2033

Table 27: Asia Pacific Market Value (US$ million) Forecast by Train Type, 2018 to 2033

Table 28: Asia Pacific Market Volume (Units) Forecast by Train Type, 2018 to 2033

Table 29: Asia Pacific Market Value (US$ million) Forecast by System Type, 2018 to 2033

Table 30: Asia Pacific Market Volume (Units) Forecast by System Type, 2018 to 2033

Table 31: MEA Market Value (US$ million) Forecast by Country, 2018 to 2033

Table 32: MEA Market Volume (Units) Forecast by Country, 2018 to 2033

Table 33: MEA Market Value (US$ million) Forecast by Train Type, 2018 to 2033

Table 34: MEA Market Volume (Units) Forecast by Train Type, 2018 to 2033

Table 35: MEA Market Value (US$ million) Forecast by System Type, 2018 to 2033

Table 36: MEA Market Volume (Units) Forecast by System Type, 2018 to 2033
Nikhil Kaitwade
Nikhil Kaitwade

Principal Consultant

Talk to Analyst

Find your sweet spots for generating winning opportunities in this market.

List of Charts

Figure 1: Global Market Value (US$ million) by Train Type, 2023 to 2033

Figure 2: Global Market Value (US$ million) by System Type, 2023 to 2033

Figure 3: Global Market Value (US$ million) by Region, 2023 to 2033

Figure 4: Global Market Value (US$ million) Analysis by Region, 2018 to 2033

Figure 5: Global Market Volume (Units) Analysis by Region, 2018 to 2033

Figure 6: Global Market Value Share (%) and BPS Analysis by Region, 2023 to 2033

Figure 7: Global Market Y-o-Y Growth (%) Projections by Region, 2023 to 2033

Figure 8: Global Market Value (US$ million) Analysis by Train Type, 2018 to 2033

Figure 9: Global Market Volume (Units) Analysis by Train Type, 2018 to 2033

Figure 10: Global Market Value Share (%) and BPS Analysis by Train Type, 2023 to 2033

Figure 11: Global Market Y-o-Y Growth (%) Projections by Train Type, 2023 to 2033

Figure 12: Global Market Value (US$ million) Analysis by System Type, 2018 to 2033

Figure 13: Global Market Volume (Units) Analysis by System Type, 2018 to 2033

Figure 14: Global Market Value Share (%) and BPS Analysis by System Type, 2023 to 2033

Figure 15: Global Market Y-o-Y Growth (%) Projections by System Type, 2023 to 2033

Figure 16: Global Market Attractiveness by Train Type, 2023 to 2033

Figure 17: Global Market Attractiveness by System Type, 2023 to 2033

Figure 18: Global Market Attractiveness by Region, 2023 to 2033

Figure 19: North America Market Value (US$ million) by Train Type, 2023 to 2033

Figure 20: North America Market Value (US$ million) by System Type, 2023 to 2033

Figure 21: North America Market Value (US$ million) by Country, 2023 to 2033

Figure 22: North America Market Value (US$ million) Analysis by Country, 2018 to 2033

Figure 23: North America Market Volume (Units) Analysis by Country, 2018 to 2033

Figure 24: North America Market Value Share (%) and BPS Analysis by Country, 2023 to 2033

Figure 25: North America Market Y-o-Y Growth (%) Projections by Country, 2023 to 2033

Figure 26: North America Market Value (US$ million) Analysis by Train Type, 2018 to 2033

Figure 27: North America Market Volume (Units) Analysis by Train Type, 2018 to 2033

Figure 28: North America Market Value Share (%) and BPS Analysis by Train Type, 2023 to 2033

Figure 29: North America Market Y-o-Y Growth (%) Projections by Train Type, 2023 to 2033

Figure 30: North America Market Value (US$ million) Analysis by System Type, 2018 to 2033

Figure 31: North America Market Volume (Units) Analysis by System Type, 2018 to 2033

Figure 32: North America Market Value Share (%) and BPS Analysis by System Type, 2023 to 2033

Figure 33: North America Market Y-o-Y Growth (%) Projections by System Type, 2023 to 2033

Figure 34: North America Market Attractiveness by Train Type, 2023 to 2033

Figure 35: North America Market Attractiveness by System Type, 2023 to 2033

Figure 36: North America Market Attractiveness by Country, 2023 to 2033

Figure 37: Latin America Market Value (US$ million) by Train Type, 2023 to 2033

Figure 38: Latin America Market Value (US$ million) by System Type, 2023 to 2033

Figure 39: Latin America Market Value (US$ million) by Country, 2023 to 2033

Figure 40: Latin America Market Value (US$ million) Analysis by Country, 2018 to 2033

Figure 41: Latin America Market Volume (Units) Analysis by Country, 2018 to 2033

Figure 42: Latin America Market Value Share (%) and BPS Analysis by Country, 2023 to 2033

Figure 43: Latin America Market Y-o-Y Growth (%) Projections by Country, 2023 to 2033

Figure 44: Latin America Market Value (US$ million) Analysis by Train Type, 2018 to 2033

Figure 45: Latin America Market Volume (Units) Analysis by Train Type, 2018 to 2033

Figure 46: Latin America Market Value Share (%) and BPS Analysis by Train Type, 2023 to 2033

Figure 47: Latin America Market Y-o-Y Growth (%) Projections by Train Type, 2023 to 2033

Figure 48: Latin America Market Value (US$ million) Analysis by System Type, 2018 to 2033

Figure 49: Latin America Market Volume (Units) Analysis by System Type, 2018 to 2033

Figure 50: Latin America Market Value Share (%) and BPS Analysis by System Type, 2023 to 2033

Figure 51: Latin America Market Y-o-Y Growth (%) Projections by System Type, 2023 to 2033

Figure 52: Latin America Market Attractiveness by Train Type, 2023 to 2033

Figure 53: Latin America Market Attractiveness by System Type, 2023 to 2033

Figure 54: Latin America Market Attractiveness by Country, 2023 to 2033

Figure 55: Europe Market Value (US$ million) by Train Type, 2023 to 2033

Figure 56: Europe Market Value (US$ million) by System Type, 2023 to 2033

Figure 57: Europe Market Value (US$ million) by Country, 2023 to 2033

Figure 58: Europe Market Value (US$ million) Analysis by Country, 2018 to 2033

Figure 59: Europe Market Volume (Units) Analysis by Country, 2018 to 2033

Figure 60: Europe Market Value Share (%) and BPS Analysis by Country, 2023 to 2033

Figure 61: Europe Market Y-o-Y Growth (%) Projections by Country, 2023 to 2033

Figure 62: Europe Market Value (US$ million) Analysis by Train Type, 2018 to 2033

Figure 63: Europe Market Volume (Units) Analysis by Train Type, 2018 to 2033

Figure 64: Europe Market Value Share (%) and BPS Analysis by Train Type, 2023 to 2033

Figure 65: Europe Market Y-o-Y Growth (%) Projections by Train Type, 2023 to 2033

Figure 66: Europe Market Value (US$ million) Analysis by System Type, 2018 to 2033

Figure 67: Europe Market Volume (Units) Analysis by System Type, 2018 to 2033

Figure 68: Europe Market Value Share (%) and BPS Analysis by System Type, 2023 to 2033

Figure 69: Europe Market Y-o-Y Growth (%) Projections by System Type, 2023 to 2033

Figure 70: Europe Market Attractiveness by Train Type, 2023 to 2033

Figure 71: Europe Market Attractiveness by System Type, 2023 to 2033

Figure 72: Europe Market Attractiveness by Country, 2023 to 2033

Figure 73: Asia Pacific Market Value (US$ million) by Train Type, 2023 to 2033

Figure 74: Asia Pacific Market Value (US$ million) by System Type, 2023 to 2033

Figure 75: Asia Pacific Market Value (US$ million) by Country, 2023 to 2033

Figure 76: Asia Pacific Market Value (US$ million) Analysis by Country, 2018 to 2033

Figure 77: Asia Pacific Market Volume (Units) Analysis by Country, 2018 to 2033

Figure 78: Asia Pacific Market Value Share (%) and BPS Analysis by Country, 2023 to 2033

Figure 79: Asia Pacific Market Y-o-Y Growth (%) Projections by Country, 2023 to 2033

Figure 80: Asia Pacific Market Value (US$ million) Analysis by Train Type, 2018 to 2033

Figure 81: Asia Pacific Market Volume (Units) Analysis by Train Type, 2018 to 2033

Figure 82: Asia Pacific Market Value Share (%) and BPS Analysis by Train Type, 2023 to 2033

Figure 83: Asia Pacific Market Y-o-Y Growth (%) Projections by Train Type, 2023 to 2033

Figure 84: Asia Pacific Market Value (US$ million) Analysis by System Type, 2018 to 2033

Figure 85: Asia Pacific Market Volume (Units) Analysis by System Type, 2018 to 2033

Figure 86: Asia Pacific Market Value Share (%) and BPS Analysis by System Type, 2023 to 2033

Figure 87: Asia Pacific Market Y-o-Y Growth (%) Projections by System Type, 2023 to 2033

Figure 88: Asia Pacific Market Attractiveness by Train Type, 2023 to 2033

Figure 89: Asia Pacific Market Attractiveness by System Type, 2023 to 2033

Figure 90: Asia Pacific Market Attractiveness by Country, 2023 to 2033

Figure 91: MEA Market Value (US$ million) by Train Type, 2023 to 2033

Figure 92: MEA Market Value (US$ million) by System Type, 2023 to 2033

Figure 93: MEA Market Value (US$ million) by Country, 2023 to 2033

Figure 94: MEA Market Value (US$ million) Analysis by Country, 2018 to 2033

Figure 95: MEA Market Volume (Units) Analysis by Country, 2018 to 2033

Figure 96: MEA Market Value Share (%) and BPS Analysis by Country, 2023 to 2033

Figure 97: MEA Market Y-o-Y Growth (%) Projections by Country, 2023 to 2033

Figure 98: MEA Market Value (US$ million) Analysis by Train Type, 2018 to 2033

Figure 99: MEA Market Volume (Units) Analysis by Train Type, 2018 to 2033

Figure 100: MEA Market Value Share (%) and BPS Analysis by Train Type, 2023 to 2033

Figure 101: MEA Market Y-o-Y Growth (%) Projections by Train Type, 2023 to 2033

Figure 102: MEA Market Value (US$ million) Analysis by System Type, 2018 to 2033

Figure 103: MEA Market Volume (Units) Analysis by System Type, 2018 to 2033

Figure 104: MEA Market Value Share (%) and BPS Analysis by System Type, 2023 to 2033

Figure 105: MEA Market Y-o-Y Growth (%) Projections by System Type, 2023 to 2033

Figure 106: MEA Market Attractiveness by Train Type, 2023 to 2033

Figure 107: MEA Market Attractiveness by System Type, 2023 to 2033

Figure 108: MEA Market Attractiveness by Country, 2023 to 2033

Recommendations

Automotive

Railway Emergency Valves Market

Published : December 2022

Automotive

Railway Coupler Market

Published : December 2022

Explore Automotive Insights

View Reports

Railway Control Stands Market