

- Market Size (2026)
- USD 1368.4 Mn
- Forecast (2036)
- USD 3329.9 Mn
- CAGR (2026 to 2036)
- 9.3%
How big is Rare Hematologic Disease Therapeutics Market size?
USD 1368.4 million in 2026 and USD 3329.9 million by 2036 at a 9.3% CAGR.
Demand for rare hematologic disease therapeutics is projected to expand at 9.3% CAGR between 2026 and 2036, increasing valuation from USD 1368.4 million in 2026 to USD 3329.9 million by 2036. In August 2025, Vertex Pharmaceuticals reported having more than 75 authorized treatment centers. Such specialized hospitals help manage the entire patient journey, from collecting cells to preparing conditioning regimens and delivering the final infusion treatments. Expanding the number of treatment centers is vital since cell and gene therapies require very precise manufacturing and close supervision by medical specialists.
Different healthcare systems focus on specific regional priorities on adopting such specialized therapies. Medical providers in the United States and United Kingdom prioritize clear insurance agreements and having enough capacity at qualified treatment centers. Programs in Germany and Japan emphasize long-term patient registry data and continuous care from specialists. Recent government updates also help improve patient access to these treatments. In July 2025, the Centers for Medicare & Medicaid Services reported for participating states representing approximately 84% of Medicaid beneficiaries living with sickle cell disease. By using agreements connecting payment directly to clinical results, healthcare systems are expected to ensure payment certainty in delivering complex gene therapies to eligible patients.
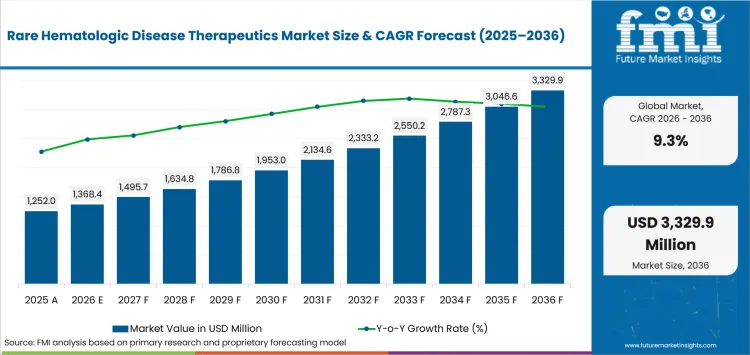
Key Takeaways of Rare Hematologic Disease Therapeutics Market
- Demand for rare hematologic disease therapeutics is driven by molecular diagnosis connecting patient identification with mechanism-based treatment pathways, with program decisions reflecting clinical durability and manageable safety oversight across specialist centers.
- Hospitals are projected to account for the leading share at 53.9% in 2026, influenced by multidisciplinary treatment capacity and complex preparation demands across gene-based and mechanism-directed therapy pathways.
- Gene therapy is anticipated to secure 40.6% share in 2026, led by curative-intent positioning across inherited hematologic disorders where specialist center access shapes treatment initiation and payer comparison favors durable response over recurring supportive care.
- First-line therapy is expected to garner 40.0% share in 2026, driven by newly eligible patients identified through molecular testing and hematologists seeking medicines that reduce recurrent crises or transfusion exposure.
- South Korea, the United Kingdom, and the United States record CAGRs of 10.4%, 9.8%, and 9.0% respectively through 2036, shaped by registry-led referral networks, centralized specialist commissioning, and multiple approved treatment mechanisms.
- Competition centers on clinical durability and treatment burden, with Novartis and Roche competing through complement and antibody pathways, Vertex Pharmaceuticals and CRISPR Therapeutics contributing gene-edited programs, and Sanofi and Pfizer competing through prophylaxis for inherited bleeding disorders.
Analyst Perspective
"The rare hematologic disease therapeutics market is advancing as treatment strategies become increasingly tailored to genetically and clinically defined patient populations. Clinical adoption will depend on durable therapeutic outcomes, efficient treatment delivery, and coordinated specialist care. Companies that strengthen clinical evidence, expand access through specialized treatment centers, and support long-term patient management will be better positioned to drive sustained adoption."
- Anurag Sharma,Principal Consultant for Healthcare at Future Market Insights
Source: Future Market Insights analysis, 2026.
How is Rare Hematologic Disease Therapeutics Market segmented?
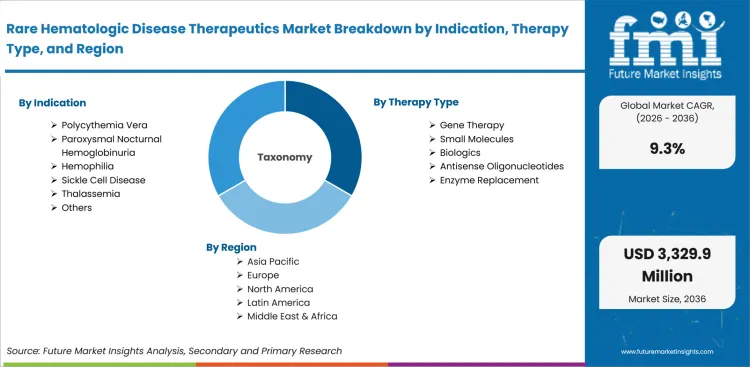
The rare hematologic disease therapeutics market is segmented by indication, therapy type, line of therapy, end user, and region.
The rare hematologic disease therapeutics industry is segmented by indication, therapy type, line of therapy, end user, and region. Indication analysis separates disorders by clinical mechanism, allowing commercial assessment to begin with disease biology instead of medicine format. Therapy type analysis then distinguishes gene-based interventions from chronic pharmacologic options, clarifying differences in preparation and monitoring intensity. Line-of-therapy coverage divides initial medicine choice from later switching or add-on decisions, preserving clinical sequence across specialist review. End-user evaluation separates hospitals from specialty clinics and hemophilia treatment centers, clarifying differences in administration intensity and emergency capability. Regional assessment examines national access across seven geographic groups, connecting market entry with approval timing and specialist-center availability.
Why does polycythemia vera shape indication demand?
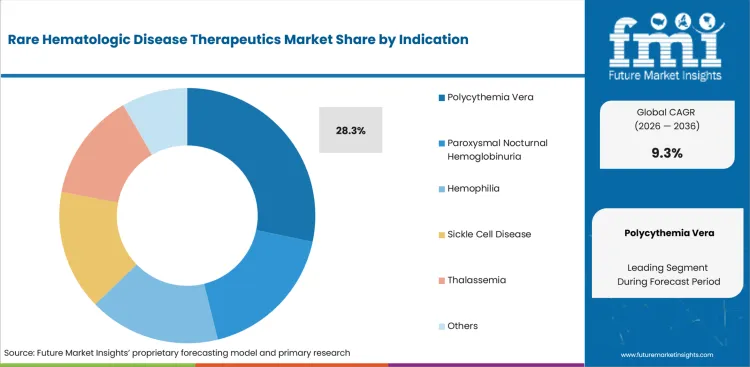
Protagonist Therapeutics and Takeda reported a 76.9% clinical response with rusfertide during June 2025, establishing a measurable basis for evaluating phlebotomy reduction among patients receiving polycythemia vera treatment under current standard care. Reduced phlebotomy eligibility links hematocrit control with fewer clinic procedures, allowing hematologists to assess treatment value against recurring venesection schedules and persistent thrombotic risk. Patient review moves from isolated laboratory readings toward sustained blood-count stability, since durable hematocrit control shapes medicine continuation across routine hematology appointments. Rusfertide enters specialist comparison as a disease-modifying option measured against cytoreductive therapy and clinical tolerance, with phlebotomy frequency providing a separate practical endpoint.
- Polycythemia vera is set to represent 28.3% of indication in 2026, guided by regular hematocrit assessment among diagnosed patients requiring sustained control over abnormal erythrocyte production. Established diagnostic pathway aligns blood-count abnormalities with recurring medicine decisions, enabling suppliers to present clear monitoring criteria during specialist review.
- Paroxysmal nocturnal hemoglobinuria requires complement inhibition for patients facing intravascular hemolysis and thrombosis exposure, placing treatment choice within specialist services experienced in laboratory surveillance. Hemophilia and inherited anemias follow separate clinical routes based on coagulation defects or ineffective erythropoiesis, preventing one treatment model from addressing every rare hematologic disorder.
Why does gene therapy shape therapy type selection?
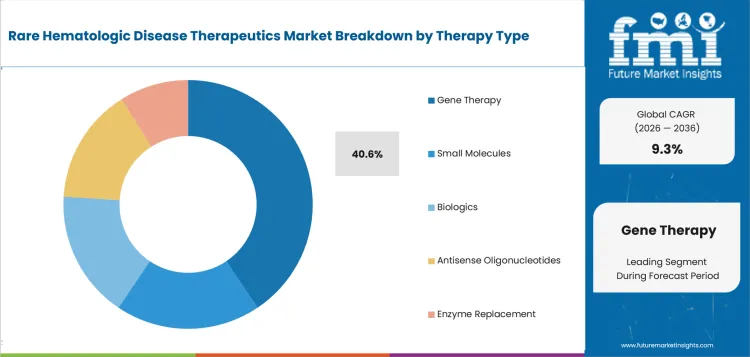
Gene therapy modifies autologous hematopoietic stem cells to address inherited disease mechanisms, aligning medicine selection with collection capacity and conditioning expertise at qualified treatment centers. United States Food and Drug Administration approved Casgevy for transfusion-dependent beta thalassemia patients aged 12 years and older during January 2024, confirming commercial availability for CRISPR-edited cell treatment. Approval places laboratory manufacturing beside transplant medicine, requiring coordinated scheduling from apheresis collection to reinfusion without separating clinical ownership across participating departments.
- In 2026, gene therapy is likely to capture 40.6% share being influenced by curative-intent positioning across severe inherited disorders requiring prolonged specialist observation. Treatment committees compare conditioning toxicity with anticipated clinical durability, placing patient eligibility and center readiness at equal weight during approval.
- Small molecules and biologics offer chronic disease control without patient-specific cell processing, allowing therapy initiation within established outpatient hematology services. Antisense oligonucleotides and enzyme replacement address selected molecular defects using recurring administration, creating distinct monitoring schedules for organ function and hematologic response.
Why does first-line treatment retain line-of-therapy strength?
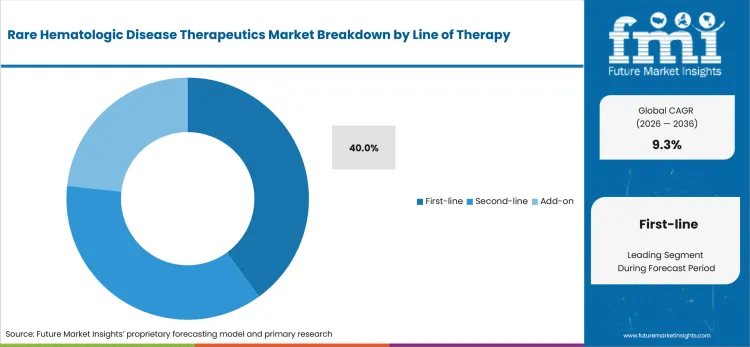
Initial therapy selection determines early disease control among newly diagnosed patients, making guideline placement an immediate consideration during specialist review. Transfusion avoidance provides a practical endpoint in complement-mediated disease, helping teams judge whether initial therapy reduces recurring transfusion exposure. United States Food and Drug Administration reported 204 treatment-naive participants in a pivotal Piasky trial during June 2024, providing comparative evidence for first-treatment decisions in PNH.
- First-line therapy is anticipated to secure 40.0% share in 2026, reflected by immediate use among newly diagnosed patients and individuals entering treatment under updated eligibility criteria. Early medicine selection has lasting clinical consequences, since inadequate control may increase later switching and monitoring complexity across specialist practices.
- Second-line medicines address incomplete response or poor tolerance following initial therapy, offering hematologists another mechanism without discarding established diagnostic information. Add-on regimens introduce complementary pharmacology beside a tolerated medicine, allowing clinicians to improve disease control without restarting an entire treatment pathway.
Why do hospitals lead end-user demand?
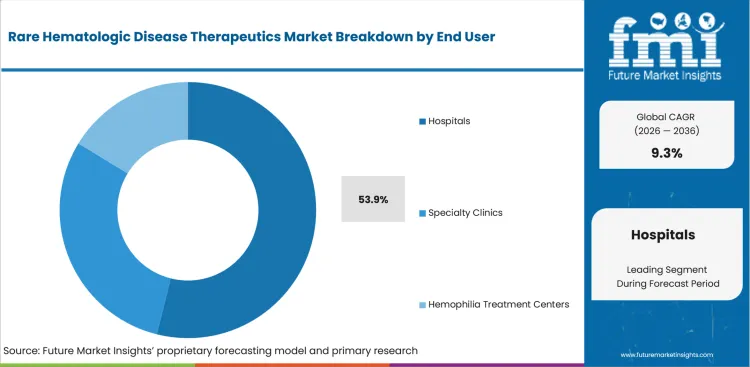
Hospitals combine hematology laboratories with transfusion services and specialist pharmacies, creating a single clinical setting for eligibility review and complex medicine administration. Multidisciplinary teams coordinate collection and conditioning responsibilities across hematology and transplant units, reducing handoff gaps during gene-based care requiring inpatient observation. NHS England named three specialist centers for exa-cel delivery during January 2025, illustrating concentrated service organization for patients needing sickle cell anemia care. Center concentration links referral decisions with acute complication management, keeping collection planning and post-infusion surveillance under experienced clinical leadership.
- By end-user, hospitals are forecast to garner 53.9% share in 2026, backed by access to laboratories and transfusion medicine within multidisciplinary hematology programs. Academic institutions add trial governance and long-term follow-up capacity, making hospital settings suitable for medicines requiring coordinated monitoring across several departments.
- Specialty clinics manage oral and injectable medicines under established referral plans, offering continuity for patients whose treatment does not require inpatient preparation. Hemophilia treatment centers coordinate prophylaxis review with inhibitor testing and emergency plans, creating a disease-specific care model for recurrent bleeding risk.
What are drivers, restraints, and opportunities in Rare Hematologic Disease Therapeutics Market?
Earlier molecular diagnosis supports mechanism-based treatment review across rare blood disorders. Complex administration and variable payment arrangements may delay routine access across smaller treatment networks.
- Driver: Hematology teams seek disease-modifying medicines reducing recurrent complications. Treatment decisions favor measurable clinical response with manageable safety oversight.
- Restraint: Intensive treatment preparation challenges centers lacking transplant resources. Long-term monitoring extends institutional review across complex therapy programs.
- Opportunity: Oral medicines and lower-frequency prophylaxis extend treatment access beyond major transplant institutions. Coordinated specialist networks support continuing care across regional services.
Centers for Disease Control and Prevention reported about 100,000 people living with sickle cell disease in United States during May 2024. Recurrent crises support demand for orphan drugs reducing acute-care exposure. Disease-modifying treatment is expected to also limit progressive organ complications across eligible patients.
Gene-edited cell therapy requires evidence across limited pediatric populations. United States Food and Drug Administration assessed Casgevy evidence from 11 pediatric patients during July 2026. Small clinical cohorts increase scrutiny of conditioning risk and long-term safety surveillance.
Oral disease modification creates access opportunities across transfusion-dependent thalassemia. United States Food and Drug Administration reported a 30% transfusion-reduction response for Aqvesme during January 2026. Specialty clinics may extend beta thalassemia treatment through liver monitoring and hematologic assessment.
How are country CAGRs aligned in Rare Hematologic Disease Therapeutics Market?
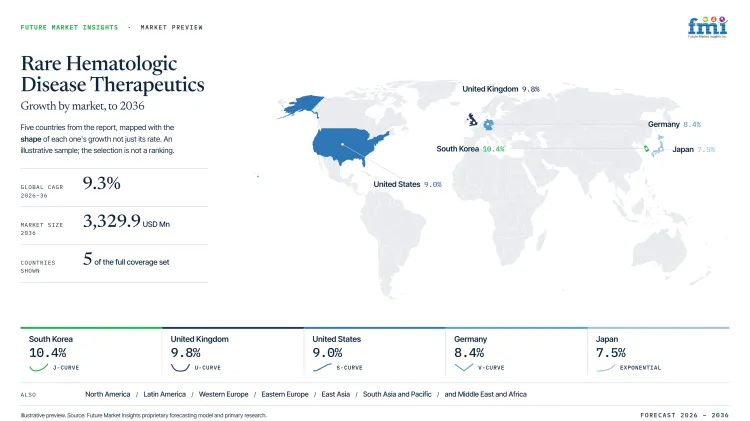
| Country or Market | CAGR |
|---|---|
| South Korea | 10.4% |
| United Kingdom | 9.8% |
| United States | 9.0% |
| Germany | 8.4% |
| Japan | 7.5% |
Source: Future Market Insights analysis, 2026.
How do country-level CAGRs compare in Rare Hematologic Disease Therapeutics Market?
The country comparison shows a gradual step-down in growth across the markets covered. South Korea and the United Kingdom occupy the upper end of the range, followed by the United States in the middle position. Germany records a moderately lower rate, and Japan completes the comparison. The 2.9-point spread shows that all five countries share a positive growth outlook, although their positions reflect different levels of market momentum.
- South Korea and the United Kingdom lead the comparison and form the upper growth cluster among the countries shown.
- The United States follows with a limited gap, indicating continued development across established approval and payment pathways.
- Germany forms the next growth band, reflecting specialist treatment oversight and registry-based patient monitoring.
- Japan records the slowest growth among the listed countries, yet its forecast remains positive within the wider market context.
- The pattern resembles a gradual downward slope instead of a sharp separation between faster-growing and slower-growing countries.
Countries carrying similar CAGRs may present different entry conditions due to treatment-center capacity and specialist availability. The full report provides country-level analysis across North America, Latin America, Western Europe, Eastern Europe, East Asia, South Asia and Pacific, and Middle East and Africa.
Country-wise Analysis
- Rare hematologic disease therapeutics market in South Korea is estimated to expand at 10.4% CAGR between 2026 and 2036 as concentrated tertiary services and coordinated patient registration create a reliable care pathway. Registry records connect diagnosis with follow-up responsibility across major institutions, reducing fragmented care for patients requiring lifelong prophylaxis or periodic laboratory review. Korean Bleeding Disorder Registry investigators reported 2,922 registered patients during November 2024, creating a defined population for medicine evaluation and longitudinal observation. A concentrated clinical base enables medicine developers to plan clinician education and post-treatment observation around established referral centers serving complex lifelong care needs.
- Medicines and Healthcare products Regulatory Agency recorded United Kingdom’s first treatment approval for congenital thrombotic thrombocytopenic purpura during May 2025, expanding specialist choice for patients of all ages. Centralized commissioning links regulatory decisions with defined referral routes across nationally organized hematology services, keeping access responsibilities clear from diagnosis to medicine initiation. National assessment procedures place clinical evidence beside budget review, creating consistent evaluation criteria for specialized rare-disease medicines entering publicly funded care pathways. Rare hematologic disease therapeutics in United Kingdom are projected to rise at 9.8% CAGR during the assessment period, aided by national medicine assessment linking approval decisions with specialist referral.
- Several approved mechanisms create a varied treatment environment across United States hematology centers, allowing clinicians to match disease biology with different administration models. Sector in the United States is anticipated to record 9.0% CAGR from 2026 to 2036, reflecting product availability across gene therapy and complement-mediated care. Commercial and public payment channels apply separate access rules, making treatment-center readiness a decisive operational condition during patient referral and medicine initiation. United States Food and Drug Administration approved Omisirge for severe aplastic anemia patients aged 6 years and older during December 2025, adding a cellular option for individuals lacking a compatible donor.
- Paul-Ehrlich-Institut reported a provisional 4,159 haemophilia A patients for 2024 in its December 2025 registry report, documenting a sizable monitored population across specialist centers. Registry reporting creates a consistent record of medicine use and patient follow-up, enabling comparison across factor products and newer therapeutic approaches. Sales in Germany are likely to increase at 8.4% CAGR during the study period, backed by evidence-led review and established specialist oversight. Neutral data collection links clinical observation with long-term safety evaluation, setting a clear evidence expectation for advanced therapies.
- Organized bleeding-disorder data collection links clinical history with treatment progress across Japanese hematology services, improving continuity for patients receiving lifelong care. Registry participation permits clinicians to compare regional practice across participating institutions without relying on isolated records from individual hospitals or specialist clinics. Chugai Pharmaceutical reported around 2,700 registrations during April 2026, documenting substantial early participation in a registry created for rare bleeding disorders. Rare hematologic disease therapeutics industry in Japan is predicted to progress at 7.5% CAGR between 2026 and 2036, due to longitudinal registry use and measured specialist review.
Who are notable companies in Rare Hematologic Disease Therapeutics Market?
Novartis, Roche, Vertex Pharmaceuticals, CRISPR Therapeutics, Sanofi, Pfizer, Agios Pharmaceuticals, PharmaEssentia, Takeda, and Protagonist Therapeutics are the prominent companies influencing this market.
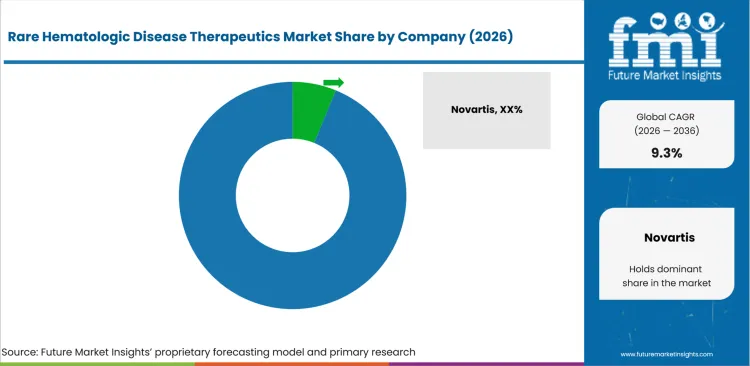
Competition centers on clinical durability and manageable treatment burden. Hospital teams compare companies due to response evidence and safety requirements. Agios Pharmaceuticals supports oral disease modification across thalassemia. PharmaEssentia provides interferon-based therapy for polycythemia vera. Takeda and Protagonist Therapeutics advance hepcidin-pathway treatment.
- Novartis and Roche receive specialist attention through approved complement and antibody therapies. Clinical teams assess administration frequency alongside disease-control evidence across complete treatment pathways.
- Vertex Pharmaceuticals and CRISPR Therapeutics compete through gene-edited cell therapy. Treatment centers compare collection requirements with follow-up needs across eligible patients.
- Sanofi and Pfizer support prophylaxis review across hemophilia A and B. Specialist services compare laboratory monitoring alongside dosing frequency across patient groups.
- Agios Pharmaceuticals and PharmaEssentia compete through disease-modifying treatments. Takeda and Protagonist Therapeutics expand the competitive landscape with late-stage peptide programs for polycythemia vera.
Competitive Benchmarking: Rare Hematologic Disease Therapeutics Market
| Company | Portfolio Depth | Clinical Match | Service Support | Service Reach |
|---|---|---|---|---|
| Novartis AG | High | High | High | United States and selected global markets |
| F. Hoffmann-La Roche Ltd | High | High | High | Global |
| Vertex Pharmaceuticals Incorporated | High | High | High | United States and selected global markets |
| CRISPR Therapeutics AG | Medium | High | Medium | United States and selected global markets |
| Sanofi | High | High | High | Global |
| Pfizer Inc. | High | High | High | Global |
| Agios Pharmaceuticals, Inc. | Medium | High | Medium | United States and selected global markets |
| PharmaEssentia Corporation | Medium | High | Medium | United States, Europe, and selected Asian markets |
| Takeda Pharmaceutical Company Limited | High | Medium | High | Global |
| Protagonist Therapeutics, Inc. | Medium | Medium | Medium | United States development sites |
Source: Future Market Insights competitive analysis, 2026.
Key Developments in Rare Hematologic Disease Therapeutics Market
- In March 2025, Sanofi announced United States approval for Qfitlia across hemophilia A or B with or without inhibitors. Company information described dosing with as few as six injections per year and reduced administration frequency.
- In February 2026, Chugai Pharmaceutical and Zenyaku Kogyo announced Japanese approval of Rituxan for autoimmune hemolytic anemia. Added labeling extends B-cell-directed therapy into warm autoimmune hemolytic anemia treatment across specialist services.
- In June 2026, Pfizer announced expanded United States approval for HYMPAVZI across additional hemophilia A or B populations. Expanded labeling covers patients with inhibitors and younger pediatric groups.
Key Players in Rare Hematologic Disease Therapeutics Market
Complement and antibody therapy companies
- Novartis AG
- F. Hoffmann-La Roche Ltd
- Sanofi
- Pfizer Inc.
Gene and cell therapy companies
- Vertex Pharmaceuticals Incorporated
- CRISPR Therapeutics AG
Disease-modifying treatment companies
- Agios Pharmaceuticals, Inc.
- PharmaEssentia Corporation
- Takeda Pharmaceutical Company Limited
- Protagonist Therapeutics, Inc.
Rare Hematologic Disease Therapeutics Market Report Scope
| Coverage field | Report scope |
|---|---|
| Market breakdown | Rare Hematologic Disease Therapeutics Market breakdown by indication, therapy type, line of therapy, end user, and region |
| Market Definition | Rare hematologic disease therapeutics include medicines used directly to treat inherited or acquired blood disorders through disease modification, prophylaxis, pathway inhibition, or gene-based intervention. |
| Regions Covered | North America, Latin America, Western Europe, Eastern Europe, East Asia, South Asia and Pacific, and Middle East and Africa |
| Countries Covered | United States, United Kingdom, Germany, Japan, South Korea, and additional countries across covered regions |
| Key Companies Profiled | Novartis, Roche, Vertex Pharmaceuticals, CRISPR Therapeutics, Sanofi, Pfizer, Agios Pharmaceuticals, PharmaEssentia, Takeda, and Protagonist Therapeutics |
| Forecast Period | 2026 to 2036 |
| Approach | Hybrid bottom-up and top-down methodology using segment share and country CAGR. Model inputs include diagnosed populations and therapy eligibility. Company participation and approval activity provide additional validation. |
Source: Future Market Insights analysis, 2026.
Rare Hematologic Disease Therapeutics Market - Research Methodology
| Method | Approach |
|---|---|
| Primary Research |
FMI analysts gathered input from manufacturers, service providers, technology developers, distributors, end users, sourcing teams, and subject-matter experts. Interviews examined purchasing decisions, product or service evaluation, adoption barriers, approval requirements, pricing considerations, and expectations for technical or commercial support. Respondents were also asked what evidence is required before a trial, pilot, or initial order develops into regular purchasing. |
| Desk Research | Desk research covered government statistics, regulatory publications, trade data, industry associations, technical literature, standards, company filings, product information, and official corporate announcements. Sources were reviewed for relevance, publication date, geographic coverage, and consistency with the defined market scope. Claims relating to performance, applications, approvals, capacity, investment, and commercial activity were retained only when supported by credible public evidence. |
| Market Sizing and Forecasting | The market model combined the baseline value with historical performance, segment structure, pricing and volume indicators, adoption levels, company participation, and country-level demand conditions. Forecast assumptions considered economic activity, investment trends, regulatory developments, technology adoption, purchasing cycles, supply availability, and barriers to wider market use. Segment and regional estimates were reconciled before the final market total was calculated. |
| Data Validation | Estimates were checked against multiple independent indicators, including public data, company activity, trade patterns, industry developments, and findings from primary interviews. Validation also tested whether products, services, applications, and company revenues fell within the defined market boundaries. Adjacent categories, unsupported claims, overlapping revenues, and activities without direct market relevance were excluded to reduce double counting and maintain consistency across segments and countries. |
Source: Future Market Insights analysis, 2026.
Rare Hematologic Disease Therapeutics Market by Segments
Rare Hematologic Disease Therapeutics Market segmented by Indication:
- Polycythemia Vera
- Paroxysmal Nocturnal Hemoglobinuria
- Hemophilia
- Sickle Cell Disease
- Thalassemia
- Others
Rare Hematologic Disease Therapeutics Market segmented by Therapy Type:
- Gene Therapy
- Small Molecules
- Biologics
- Antisense Oligonucleotides
- Enzyme Replacement
Rare Hematologic Disease Therapeutics Market segmented by Line of Therapy:
- First-line
- Second-line
- Add-on
Rare Hematologic Disease Therapeutics Market segmented by End User:
- Hospitals
- Specialty Clinics
- Hemophilia Treatment Centers
Rare Hematologic Disease Therapeutics Market segmented by Region:
- North America
- United States
- Canada
- Latin America
- Brazil
- Mexico
- Argentina
- Chile
- Western Europe
- Germany
- France
- United Kingdom
- Italy
- Spain
- Benelux
- Nordics
- Eastern Europe
- Poland
- Czech Republic
- Romania
- Hungary
- East Asia
- China
- Japan
- South Korea
- South Asia and Pacific
- India
- ASEAN
- Australia and New Zealand
- Middle East and Africa
- GCC Countries
- South Africa
- Türkiye
- Israel
Research Sources and Bibliography
- Centers for Disease Control and Prevention. (2024, May 15). Data and statistics on sickle cell disease.
- Centers for Medicare & Medicaid Services. (2025, July 15). CMS expands access to lifesaving gene therapies through innovative state agreements.
- Chugai Pharmaceutical Co., Ltd. (2026, April 11). Carrying Patient Voices Into the Future: Japan’s Bleeding Disorders Registry.
- Chugai Pharmaceutical Co., Ltd., & Zenyaku Kogyo Co., Ltd. (2026, February 19). Anti-CD20 Monoclonal Antibody Rituxan Approved for Treatment of Autoimmune Hemolytic Anemia.
- Han, J. W., Baek, H. J., Park, Y. S., Park, S., Yoo, K. Y., Choi, E. J., Kim, J. Y., Hahn, S. M., Ahn, W. K., Lee, H., Kwon, S. Y., Lyu, C. J., & Kim, S. K. (2024, November 5). Completion of the first phase of registration: Baseline characteristics and epidemiology of hemophilia in Korea from the Korean Bleeding Disorder Registry. Blood, 144(Supplement 1), 5489.
- Medicines and Healthcare products Regulatory Agency. (2025, May 12). MHRA approves first UK treatment for congenital thrombotic thrombocytopenic purpura (cTTP).
- NHS England. (2025, January 31). Revolutionary gene-editing therapy for sickle cell ‘offers hope of a cure’ for NHS patients.
- Paul-Ehrlich-Institut. (2025, December 4). German Haemophilia Registry 2023/2024 report.
- Pfizer Inc. (2026, June 8). U.S. FDA Approves Pfizer’s HYMPAVZI for the Treatment of Two Additional Hemophilia A or B Patient Populations with Significant Medical Need.
- Protagonist Therapeutics, Inc., & Takeda Pharmaceutical Company Limited. (2025, June 1). Protagonist and Takeda Announce ASCO Plenary Presentation Highlighting Full 32-Week Results from Phase 3 VERIFY Study of Rusfertide, Showing Reductions in Phlebotomy, Improved Hematocrit Control in Polycythemia Vera.
- Sanofi. (2025, March 28). Press Release: Qfitlia approved as the first therapy in the US to treat hemophilia A or B with or without inhibitors.
- U.S. Food and Drug Administration. (2024, January 16). FDA Roundup: January 16, 2024.
- U.S. Food and Drug Administration. (2024, June 20). Drug Trials Snapshots: PIASKY.
- U.S. Food and Drug Administration. (2025, December 8). FDA Approves First Cellular Therapy to Treat Patients with Severe Aplastic Anemia.
- U.S. Food and Drug Administration. (2026, January 5). FDA approves first oral treatment for anemia in thalassemia, an inherited blood disorder.
- U.S. Food and Drug Administration. (2026, July 1). FDA Approves First Gene Therapy for Young Children with Sickle Cell Disease.
- Vertex Pharmaceuticals Incorporated. (2025, August 4). Vertex Reports Second Quarter 2025 Financial Results.
This bibliography is provided for reader reference and is not exhaustive. The full report contains the complete reference list and detailed citations.
This Report Answers
- What segments influence demand across indication and therapy type with line of therapy and end user?
- How do hematology teams evaluate rare hematologic disease therapeutics prior to routine clinical use?
- How do country CAGRs differ across profiled markets with distinct specialist capacity and reimbursement access?
- What companies compete through therapy depth and dependable treatment-center support?
- How are forecasts validated through hybrid bottom-up and top-down analysis?
- What evidence do hospital committees examine prior to approving complex gene and cell therapies?
- How do clinical durability and safety monitoring influence medicine selection?
- What limits treatment access across hospitals and specialist centers?
- How do registry records influence treatment approval across participating institutions?
- What company capabilities improve long-term clinical confidence and continuing therapy use?
Frequently Asked Questions
How big is the Rare Hematologic Disease Therapeutics Market in 2026?
The rare hematologic disease therapeutics market is valued at USD 1368.4 million in 2026 and is forecast to reach USD 3329.9 million by 2036, reflecting expanding specialist center capacity and growing adoption of gene-based and mechanism-directed treatment pathways across inherited and acquired blood disorders.
What is the CAGR of the Rare Hematologic Disease Therapeutics Market from 2026 to 2036?
The rare hematologic disease therapeutics market is projected to grow at a CAGR of 9.3% between 2026 and 2036, supported by earlier molecular diagnosis connecting patient identification with mechanism-based treatment pathways across specialist hematology centers.
Which therapy type leads the Rare Hematologic Disease Therapeutics Market?
Gene therapy accounts for 40.6% of the rare hematologic disease therapeutics market by therapy type in 2026, driven by curative-intent positioning across severe inherited disorders where specialist center access shapes treatment initiation and payer comparison favors durable response over recurring supportive care.
Which country segment is growing fastest in the Rare Hematologic Disease Therapeutics Market?
South Korea is the fastest-growing country segment in the rare hematologic disease therapeutics market, expanding at a 10.4% CAGR through 2036, ahead of the market average of 9.3%, supported by concentrated tertiary services and coordinated patient registration creating a reliable care pathway across major specialist institutions.
Who are the leading companies in the Rare Hematologic Disease Therapeutics Market?
Leading companies in the rare hematologic disease therapeutics market include Novartis, Roche, Vertex Pharmaceuticals, CRISPR Therapeutics, Sanofi, Pfizer, Agios Pharmaceuticals, PharmaEssentia, Takeda, and Protagonist Therapeutics, competing across complement therapy, gene-edited cell programs, and disease-modifying treatment pathways.
Preview the report firsthand - request a free sample
Get SampleGet the brochure for pricing and purchase details.
Get PDFTable of Content
- Key Takeaways
- Market Size and CAGR
- Top Growth Driver
- Fastest Growing Segment
- Leading Region
- Key Companies
- Emerging Opportunities
- Executive Summary
- Global Market Outlook
- Demand-side Trends
- Supply-side Trends
- Technology Roadmap Analysis
- Analysis and Recommendations
- Analyst Perspective (What is happening? Why now? What should investors know?)
- Key Questions Answered
- How large is the market?
- What is the CAGR?
- What are key trends?
- Which region dominates?
- Who are the leaders?
- Market Overview
- Market Coverage / Taxonomy
- Market Definition / Scope / Limitations
- Research Methodology
- Chapter Orientation
- Analytical Lens and Working Hypotheses
- Market Structure, Signals, and Trend Drivers
- Benchmarking and Cross-market Comparability
- Market Sizing, Forecasting, and Opportunity Mapping
- Research Design and Evidence Framework
- Desk Research Programme (Secondary Evidence)
- Expert Input and Fieldwork (Primary Evidence)
- Tooling, Models, and Reference Databases
- Data Engineering and Model Build
- Quality Assurance and Audit Trail
- Market Background
- Market Dynamics (Drivers, Restraints, Opportunity, Trends)
- Scenario Forecast (Optimistic, Likely, Conservative)
- Impact Analysis
- AI Impact
- Sustainability Impact
- Regulatory Impact
- Technology Impact
- Consumer / Buyer Analysis
- Purchase Drivers
- Adoption Barriers
- Buyer Journey
- Opportunity Map Analysis
- Product Life Cycle Analysis
- Supply Chain Analysis
- Investment Feasibility Matrix
- Value Chain Analysis
- PESTLE and Porter's Analysis
- Regulatory Landscape
- Regional Parent Market Outlook
- Production and Consumption Statistics
- Import and Export Statistics
- Global Market Analysis and Forecast, 2021 to 2036
- Historical Market Size Value (USD Million) Analysis, 2021 to 2025
- Current and Future Market Size Value (USD Million) Projections, 2026 to 2036
- Y-o-Y Growth Trend Analysis
- Absolute $ Opportunity Analysis
- Global Market Pricing Analysis, 2021 to 2036
- Global Market Analysis and Forecast, By Indication, 2021 to 2036
- Introduction / Key Findings
- Historical Market Size Value (USD Million) Analysis By Indication, 2021 to 2025
- Current and Future Market Size Value (USD Million) Analysis and Forecast By Indication, 2026 to 2036
- Polycythemia Vera
- Paroxysmal Nocturnal Hemoglobinuria
- Hemophilia
- Sickle Cell Disease
- Thalassemia
- Others
- Polycythemia Vera
- Y-o-Y Growth Trend Analysis By Indication, 2021 to 2025
- Absolute $ Opportunity Analysis By Indication, 2026 to 2036
- Global Market Analysis and Forecast, By Therapy Type, 2021 to 2036
- Introduction / Key Findings
- Historical Market Size Value (USD Million) Analysis By Therapy Type, 2021 to 2025
- Current and Future Market Size Value (USD Million) Analysis and Forecast By Therapy Type, 2026 to 2036
- Gene Therapy
- Small Molecules
- Biologics
- Antisense Oligonucleotides
- Enzyme Replacement
- Gene Therapy
- Y-o-Y Growth Trend Analysis By Therapy Type, 2021 to 2025
- Absolute $ Opportunity Analysis By Therapy Type, 2026 to 2036
- Global Market Analysis and Forecast, By Line of Therapy, 2021 to 2036
- Introduction / Key Findings
- Historical Market Size Value (USD Million) Analysis By Line of Therapy, 2021 to 2025
- Current and Future Market Size Value (USD Million) Analysis and Forecast By Line of Therapy, 2026 to 2036
- First-line
- Second-line
- Add-on
- First-line
- Y-o-Y Growth Trend Analysis By Line of Therapy, 2021 to 2025
- Absolute $ Opportunity Analysis By Line of Therapy, 2026 to 2036
- Global Market Analysis and Forecast, By End User, 2021 to 2036
- Introduction / Key Findings
- Historical Market Size Value (USD Million) Analysis By End User, 2021 to 2025
- Current and Future Market Size Value (USD Million) Analysis and Forecast By End User, 2026 to 2036
- Hospitals
- Specialty Clinics
- Hemophilia Treatment Centers
- Hospitals
- Y-o-Y Growth Trend Analysis By End User, 2021 to 2025
- Absolute $ Opportunity Analysis By End User, 2026 to 2036
- Global Market Analysis and Forecast, By Region, 2021 to 2036
- Introduction
- Historical Market Size Value (USD Million) Analysis By Region, 2021 to 2025
- Current Market Size Value (USD Million) Analysis and Forecast By Region, 2026 to 2036
- North America
- Latin America
- Western Europe
- Eastern Europe
- East Asia
- South Asia and Pacific
- Middle East & Africa
- Market Attractiveness Analysis By Region
- North America Market Analysis and Forecast, By Country, 2021 to 2036
- Historical Market Size Value (USD Million) Trend Analysis By Market Taxonomy, 2021 to 2025
- Market Size Value (USD Million) Forecast By Market Taxonomy, 2026 to 2036
- By Country
- USA
- Canada
- By Indication
- By Therapy Type
- By Line of Therapy
- By End User
- By Country
- Market Attractiveness Analysis
- By Country
- By Indication
- By Therapy Type
- By Line of Therapy
- By End User
- Key Takeaways
- Latin America Market Analysis and Forecast, By Country
- Historical Market Size Value (USD Million) Trend Analysis By Market Taxonomy, 2021 to 2025
- Market Size Value (USD Million) Forecast By Market Taxonomy, 2026 to 2036
- By Country
- Brazil
- Mexico
- Chile
- Rest of Latin America
- By Indication
- By Therapy Type
- By Line of Therapy
- By End User
- By Country
- Market Attractiveness Analysis
- By Country
- By Indication
- By Therapy Type
- By Line of Therapy
- By End User
- Key Takeaways
- Western Europe Market Analysis and Forecast, By Country
- Historical Market Size Value (USD Million) Trend Analysis By Market Taxonomy, 2021 to 2025
- Market Size Value (USD Million) Forecast By Market Taxonomy, 2026 to 2036
- By Country
- Germany
- UK
- Italy
- Spain
- France
- Nordic
- BENELUX
- Rest of Western Europe
- By Indication
- By Therapy Type
- By Line of Therapy
- By End User
- By Country
- Market Attractiveness Analysis
- By Country
- By Indication
- By Therapy Type
- By Line of Therapy
- By End User
- Key Takeaways
- Eastern Europe Market Analysis and Forecast, By Country
- Historical Market Size Value (USD Million) Trend Analysis By Market Taxonomy, 2021 to 2025
- Market Size Value (USD Million) Forecast By Market Taxonomy, 2026 to 2036
- By Country
- Russia
- Poland
- Hungary
- Balkan & Baltic
- Rest of Eastern Europe
- By Indication
- By Therapy Type
- By Line of Therapy
- By End User
- By Country
- Market Attractiveness Analysis
- By Country
- By Indication
- By Therapy Type
- By Line of Therapy
- By End User
- Key Takeaways
- East Asia Market Analysis and Forecast, By Country
- Historical Market Size Value (USD Million) Trend Analysis By Market Taxonomy, 2021 to 2025
- Market Size Value (USD Million) Forecast By Market Taxonomy, 2026 to 2036
- By Country
- China
- Japan
- South Korea
- By Indication
- By Therapy Type
- By Line of Therapy
- By End User
- By Country
- Market Attractiveness Analysis
- By Country
- By Indication
- By Therapy Type
- By Line of Therapy
- By End User
- Key Takeaways
- South Asia and Pacific Market Analysis and Forecast, By Country
- Historical Market Size Value (USD Million) Trend Analysis By Market Taxonomy, 2021 to 2025
- Market Size Value (USD Million) Forecast By Market Taxonomy, 2026 to 2036
- By Country
- India
- ASEAN
- Australia & New Zealand
- Rest of South Asia and Pacific
- By Indication
- By Therapy Type
- By Line of Therapy
- By End User
- By Country
- Market Attractiveness Analysis
- By Country
- By Indication
- By Therapy Type
- By Line of Therapy
- By End User
- Key Takeaways
- Middle East & Africa Market Analysis and Forecast, By Country
- Historical Market Size Value (USD Million) Trend Analysis By Market Taxonomy, 2021 to 2025
- Market Size Value (USD Million) Forecast By Market Taxonomy, 2026 to 2036
- By Country
- Kingdom of Saudi Arabia
- Other GCC Countries
- Türkiye
- South Africa
- Other African Union
- Rest of Middle East & Africa
- By Indication
- By Therapy Type
- By Line of Therapy
- By End User
- By Country
- Market Attractiveness Analysis
- By Country
- By Indication
- By Therapy Type
- By Line of Therapy
- By End User
- Key Takeaways
- Key Countries Market Analysis
- USA
- Pricing Analysis
- Market Share Analysis, 2025
- By Indication
- By Therapy Type
- By Line of Therapy
- By End User
- Canada
- Pricing Analysis
- Market Share Analysis, 2025
- By Indication
- By Therapy Type
- By Line of Therapy
- By End User
- Mexico
- Pricing Analysis
- Market Share Analysis, 2025
- By Indication
- By Therapy Type
- By Line of Therapy
- By End User
- Brazil
- Pricing Analysis
- Market Share Analysis, 2025
- By Indication
- By Therapy Type
- By Line of Therapy
- By End User
- Chile
- Pricing Analysis
- Market Share Analysis, 2025
- By Indication
- By Therapy Type
- By Line of Therapy
- By End User
- Germany
- Pricing Analysis
- Market Share Analysis, 2025
- By Indication
- By Therapy Type
- By Line of Therapy
- By End User
- UK
- Pricing Analysis
- Market Share Analysis, 2025
- By Indication
- By Therapy Type
- By Line of Therapy
- By End User
- Italy
- Pricing Analysis
- Market Share Analysis, 2025
- By Indication
- By Therapy Type
- By Line of Therapy
- By End User
- Spain
- Pricing Analysis
- Market Share Analysis, 2025
- By Indication
- By Therapy Type
- By Line of Therapy
- By End User
- France
- Pricing Analysis
- Market Share Analysis, 2025
- By Indication
- By Therapy Type
- By Line of Therapy
- By End User
- India
- Pricing Analysis
- Market Share Analysis, 2025
- By Indication
- By Therapy Type
- By Line of Therapy
- By End User
- ASEAN
- Pricing Analysis
- Market Share Analysis, 2025
- By Indication
- By Therapy Type
- By Line of Therapy
- By End User
- Australia & New Zealand
- Pricing Analysis
- Market Share Analysis, 2025
- By Indication
- By Therapy Type
- By Line of Therapy
- By End User
- China
- Pricing Analysis
- Market Share Analysis, 2025
- By Indication
- By Therapy Type
- By Line of Therapy
- By End User
- Japan
- Pricing Analysis
- Market Share Analysis, 2025
- By Indication
- By Therapy Type
- By Line of Therapy
- By End User
- South Korea
- Pricing Analysis
- Market Share Analysis, 2025
- By Indication
- By Therapy Type
- By Line of Therapy
- By End User
- Russia
- Pricing Analysis
- Market Share Analysis, 2025
- By Indication
- By Therapy Type
- By Line of Therapy
- By End User
- Poland
- Pricing Analysis
- Market Share Analysis, 2025
- By Indication
- By Therapy Type
- By Line of Therapy
- By End User
- Hungary
- Pricing Analysis
- Market Share Analysis, 2025
- By Indication
- By Therapy Type
- By Line of Therapy
- By End User
- Kingdom of Saudi Arabia
- Pricing Analysis
- Market Share Analysis, 2025
- By Indication
- By Therapy Type
- By Line of Therapy
- By End User
- Türkiye
- Pricing Analysis
- Market Share Analysis, 2025
- By Indication
- By Therapy Type
- By Line of Therapy
- By End User
- South Africa
- Pricing Analysis
- Market Share Analysis, 2025
- By Indication
- By Therapy Type
- By Line of Therapy
- By End User
- USA
- Market Structure Analysis
- Competition Dashboard
- Competition Benchmarking
- Market Share Analysis of Top Players
- By Regional
- By Indication
- By Therapy Type
- By Line of Therapy
- By End User
- Emerging Startups
- Innovation Benchmarking
- Competition Analysis
- Competition Deep Dive
- Novartis
- Overview
- Product Portfolio
- Profitability by Market Segments
- Sales Footprint
- Strategy Overview
- Marketing Strategy
- Product Strategy
- Channel Strategy
- Roche
- BioMarin
- Vertex/CRISPR
- Sanofi
- Pfizer
- Apellis Pharmaceuticals
- Ionis
- Novartis
- Case Studies
- Success Stories
- Recent Developments
- Competition Deep Dive
- Assumptions & Acronyms Used


