Refillable Pouches Market Size, Share, and Forecast Outlook 2025 to 2035

The global refillable pouches market is valued at USD 3.3 billion in 2025 and is likely to reach USD 5.2 billion by 2035, growing at a CAGR of 4.6%.
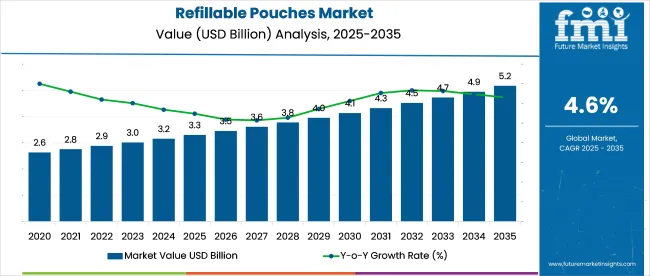
Quick Stats of Refillable Pouches Market

  • Market Value (2025): USD 3.3 billion
  • Forecast Value (2035): USD 5.2 billion
  • Forecast CAGR: 4.6%
  • Product Leader in 2025: Zipper closure pouches (55% share)
  • Top Distribution Channel: Retail refill format
  • Key Growth Region: China (fastest CAGR at 6.7%)
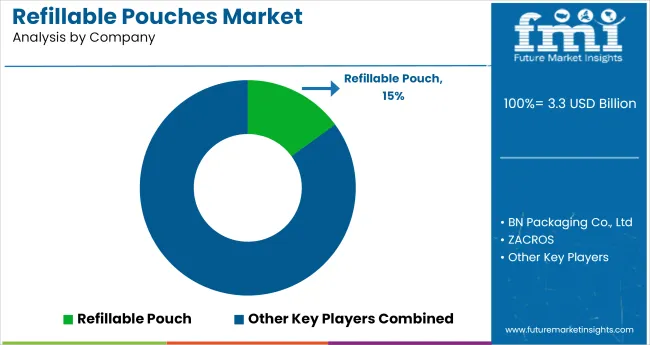
  • Leading Player: BN Packaging Co., Ltd (15% market share)

Refillable Pouches Market

Attribute Value
Market Size (2025) USD 3.3 billion
Market Size (2035) USD 5.2 billion
CAGR (2025 to 2035) 4.6%

Refillable pouches are gaining visibility across personal care, home care, and food packaging due to their low material usage and compatibility with refill models. Formats range from stand-up packs with spouts to collapsible bags designed for repeat use.

Film structures are shifting toward mono-material and PE-based laminates to support recyclability. Retailers and converters are expanding SKUs, adding fitment systems, and using digital print to enable short runs for subscription packs, seasonal offers, and co-branded editions.

As of 2025, refillable pouches account for an estimated 4.2% share of the global flexible packaging market, valued at over USD 280 billion. Within the plastic packaging market (USD 450+ billion), their share stands at around 1.5%, limited by their narrower scope. In consumer packaging, which spans over USD 2 trillion, refillable pouches contribute under 0.5% but are expanding through food, personal care, and pet product formats.

Within the reusable and refillable packaging segment, projected at USD 50-60 billion, refillable pouches represent about 8-10%, due to increasing demand for refill stations and bulk packaging. In personal and home care packaging, they hold a 3.6% share, led by liquid soap, shampoo, and cleaning gel formats commonly using zipper or spout pouches.

Sierra Liggett, Division Manager at PAC Worldwide, refers to refill pouches as a strategic inflection point in packaging, where performance and environmental responsibility can align. She emphasizes that the company has developed film technologies that guarantee zero leakage, addressing a core functional requirement for liquid and semi-liquid products.

At the same time, these pouches reduce shipping weight by 66%, directly supporting efforts to lower transport-related emissions and material usage. Liggett positions this as proof that functional compromise is not a prerequisite for reducing packaging waste, reinforcing PAC Worldwide’s commitment to practical solutions in packaging design and supply chain optimization.

Analyzing Refillable Pouches Market by Top Investment Segments

Brand refill strategies and circular design policies are influencing pouch format choices, particularly in personal care and household cleaning sectors. Zipper-based closures and standalone refillable structures show measurable conversion rates in established retail markets. Compatibility with automated lines and closure integrity are key parameters for packaging suppliers.
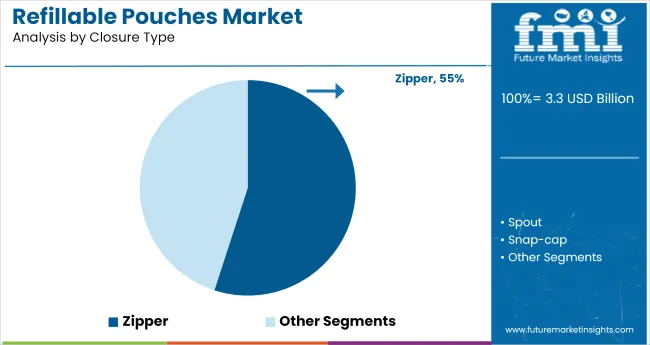
Zipper Closures Lead with 55% Share in 2025

Refillable Pouches Market Analysis By Closure Type

Zipper closures dominate with a 55% share, serving personal care, food, and home cleaning applications where repeated access is essential. Zippers tested for >10 open-close cycles retain 95% sealing integrity, which drives customer retention in refill SKUs. Manufacturers such as Glenroy, Constantia Flexibles, and ProAmpac offer custom zipper formats, including tamper-evident variants.

Pouches in this segment commonly use PE or PET substrates with reclosable linear zippers fused under 180-200°C seal temperatures. Line speeds remain unaffected, achieving 50-65 pouches/min on multi-lane vertical form-fill-seal (VFFS) lines. Formats are suited for retail pack sizes ranging from 150 mL to 2 L.
  • Lower failure rates than spouts: <2% in burst testing under 1.2 bar
  • Enables in-store refill concepts with open-shelf visibility
  • Integrates recyclable mono-material options for zipper tracks in PE-based pouches

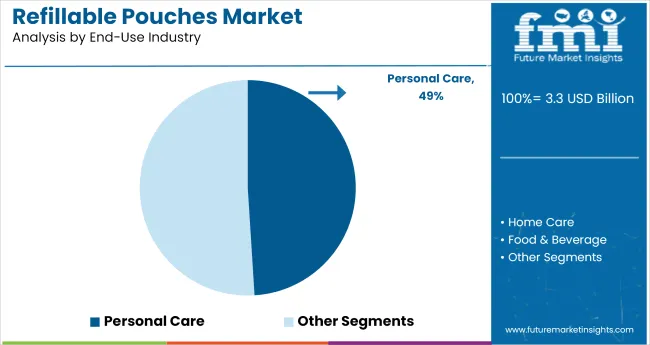
Personal Care Accounts for 49% of End-Use in 2025

Refillable Pouches Market Analysis By End Use Industry

Personal care applications account for 49% of refill pouch demand, driven by shower gels, shampoos, facial cleansers, and lotions. Usage in refill stations and subscription refill models has accelerated pouch volume in 250-400 mL range.

Brands such as L’Oréal, Unilever, and Procter & Gamble deploy refillable pouches across up to 12 product variants per brand line. Key considerations include chemical compatibility (pH 4-9), surface print adhesion under humidity, and material flexibility for viscous fluids. Refill packs must resist up to 3N tear strength to endure repeated squeezes or shelf load.

  • Custom die-cut spouts integrated in secondary packaging for refill targeting
  • Shelf-life stability tested at 35°C/70% RH for 6 months
  • Standard deviation in fill weight kept under ±3 grams on automated lines

Reusable Standalone Pouches Show Fastest Conversion Rate

Reusable standalone pouches are gaining adoption among mid-scale personal and household brands due to ease of brand differentiation and lower per-use cost. Unlike single-use variants, these pouches are designed for 5-10 refill cycles, typically made from 125-150-micron multi-layer laminates. Companies like S-Pack, RefillMyBottle, and Lageen Tubes offer ergonomic designs with spout or wide-mouth zipper closures.

Reusability protocols validate pouch tensile strength retention up to 80% after five uses, while valves and caps are engineered for twist resistance above 1.5 Nm. This format also supports barcode-based refill tracking systems through retail point-of-sale.
  • Pouch wall flexibility tested for repeated folding over 50,000 cycles
  • Interior coatings resist surfactant penetration and oil migration
  • Pack collapse ratios exceed 75% for efficient empty storage

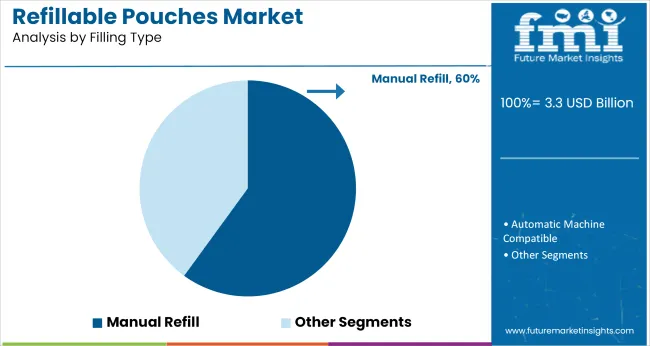
Manual Filling Compatible Pouches Still Dominate SME Use

Refillable Pouches Market Analysis By Filling Type

Manual refill pouches continue to dominate small and medium enterprise (SME) manufacturing setups, accounting for over 60% of the filling-type segment. These pouches are produced in batches of 5,000-15,000 units, often using basic impulse sealing equipment.

Key players like ePac, Aptar, and PakFactory supply manual-friendly formats with self-standing gussets and tamper-proof zipper or snap caps. Sealing widths typically range from 6-12 mm, with opening torque adjusted to 0.8-1.1 Nm for user convenience. Manual fill time averages 15-25 seconds/pouch, depending on viscosity and neck diameter.
  • Per-pouch filling variation monitored under ±5 mL
  • High purchase among artisan and boutique cosmetic producers
  • Designed with writable surfaces for hand-labeling and expiry coding

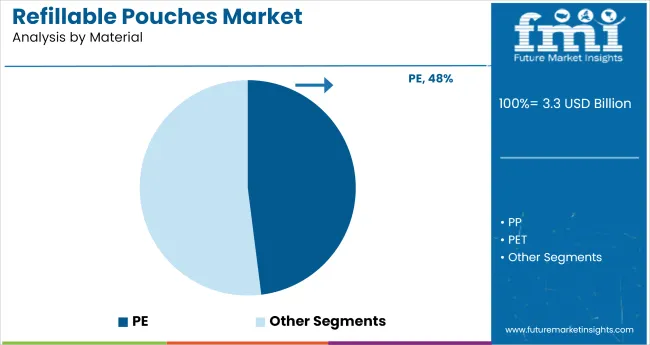
PE-Based Films Lead Material Preference at 48% Share

Refillable Pouches Market Analysis By Material

PE remains the dominant pouch material at an estimated 48% share, due to heat seal compatibility, impact strength, and increasing availability of mono-material variants. High-performance PE films are tailored with puncture resistance levels above 1.5 N/mm and show minimal delamination under high-humidity storage.

Firms such as Amcor, Sealed Air, and Coveris supply recyclable PE structures compatible with zippers and pour spouts. These films also allow downgauging up to 20% without compromising form stability. Extrusion temperature settings for PE films are optimized at 210-240°C during pouch forming.

  • Ideal for 2D and 3D pouch shaping using thermoform-fill-seal (TFFS)
  • Oil-resistance rating above Grade 3 on ASTM D543 standards
  • Recyclable in LDPE (Code 4) streams under certified sortation conditions

Top Refillable Pouches Market Dynamics

Refillable pouch supply chains adjusted through shorter inventory cycles, modular filling systems, and leaner order volumes. Use-case expansion across food, personal care, and pet products gained traction through functional trials. Rising resin and freight costs compressed margins, prompting shifts toward mono-material formats, subscription pricing, and streamlined sourcing to manage profitability.

Inventory Rationalization & Refill Cycle Optimization

Personal care and household brands trimmed pouch inventory durations to ease warehouse congestion and recover tied-up capital. Average holding time in Western European facilities fell from 74 to 52 days in H1 2025 following a broader uptake of demand-linked replenishment software among mid-tier fillers.

In Japan, refill variants are now cleared from shelves 1.8× faster than rigid-plastic formats across supermarkets. Retailers in the UK widened shelf space for refill stations by 22%, driven by SKU-level turn rate data.

Modular pouch-filling units installed by third-party manufacturers in South Korea lowered minimum order sizes by 19%, supporting quicker replenishment cycles. Stock-out incidents across top-volume refill lines dropped 13% as supply chains adjusted to leaner inventory structures.

Format Validation Across Personal Care and Food Segments

A 2024 user trial led by Technion Israel Institute found that multilayer PE pouches retained 94% functional integrity after five refill rounds when used for toiletries. In France, yogurt producers piloting hybrid pouches combining HDPE and aluminum reported a 31% increase in redemption among loyalty-card users.

Australian brands selling frozen soups registered 17% growth in refill-pack units in Q1 2025 over the prior-year period, with demand supported by freezer-compatible closure features. USA pet food suppliers ran market tests using barrier pouches fitted with resealable spouts for wet formats.

Surveyed households reported 63% preference over cans due to ease of resealing and portioning. Market entry across food, hygiene, and pet care shows format adaptability under varied storage and usage conditions.

Margin Strain from Resin Volatility and Packaging Complexity

Suppliers experienced pressure on gross margins through early 2025 amid elevated input costs and material-specific sourcing constraints. LDPE benchmarks climbed 14% year-on-year by April, while tie-layer adhesives became 9% costlier across key Asian regions. These shifts compressed converter-level margins from 19.5% to 13.2% as pricing lags limited downstream recovery.

Freight rates for Asia-Europe shipments pushed logistics overheads upward, particularly for volume-intensive light packaging. Some converters adopted mono-material structures with thinner films, trimming material costs by 11% while accepting shorter ambient shelf life. Others introduced fixed-price refill bundles to stabilize per-unit revenues. Margin recovery efforts remain dependent on format standardization, flexible sourcing contracts, and packaging line reconfiguration.
Top Countries Manufacturing, Synthesizing, Distributing, and Generating Demand for Refillable Pouches

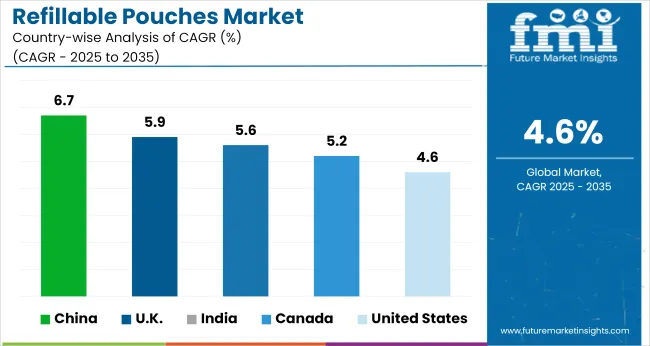
Refillable Pouches Market Cagr Analysis By Country

Countries CAGR
China 6.7%
UK 5.9%
India 5.6%
Canada 5.2%
United States 4.6%

Global demand for refillable pouches is projected to grow at a 4.6% CAGR from 2025 to 2035. Among the five profiled countries out of 40 covered, China (BRICS) leads with a 6.7% CAGR, followed by the United Kingdom (OECD) at 5.9%, India (BRICS) at 5.6%, Canada (OECD) at 5.2%, and the United States (OECD) at 4.6%.

These rates translate to growth premiums of +46% for China, +28% for the UK, +22% for India, and +13% for Canada, while the USA aligns exactly with the global average. Expansion in China and India is tied to rising refillable formats in personal care and home-cleaning categories.

In the UK and Canada, demand reflects scaling interest in zero-waste retail and brand-led circular packaging programs. The USA market remains steady, with adoption supported by targeted retail partnerships rather than broad policy shifts.

The report covers detailed analysis of 40+ countries, with the top five countries shared as a reference

Growth Analysis of Refillable Pouches Market in the United States

In the USA, refillable pouch adoption has seen a gradual but steady expansion, with the market expected to register a compound annual growth rate (CAGR) of 4.6% between 2025 and 2035. Demand is forecasted to reach 288,000 metric tons by 2035, supported by refill formats gaining traction across household cleaning and baby care segments.

Co-packers are beginning to invest in automation lines that accommodate refillable flexible packaging, responding to brand commitments aimed at material reduction. Shifts in packaging laws and changes in extended producer responsibility (EPR) regulations are also influencing procurement and contract packaging dynamics in the country.

  • Liquid detergent segment accounted for nearly 38% of total refill pouch consumption in 2024.
  • Over 60% of new refill pouch lines added in 2023 were installed in the Midwest region.
  • Multi-use laminated formats dominate, but mono-layer PE pouches have grown 12% YoY in trials.

Premium Refillable Pouches Market Growth Outlook in Canada

The refillable pouch market in Canada is projected to expand at a CAGR of 5.2% through 2035, with demand likely to surpass 92,000 metric tons by the end of the forecast period. Growth is being supported by private-label brands introducing refill SKUs in hand soaps, shampoos, and kitchen essentials.

Consumer packaged goods (CPG) manufacturers in Québec and Ontario are leading the shift with locally sourced pouch laminates and in-house pouch-filling lines. Retailers are also partnering with specialty packaging suppliers to trial refill stations in urban centers.

  • Over 40 new SKUs using refill pouches were launched by Canadian retailers in 2023.
  • Nearly 23% of refill pouch imports are sourced from the USA, followed by Germany and South Korea.
  • Barrier pouches with spouts accounted for 61% of total refill pouch volumes in 2024.

Future Outlook for Refillable Pouches Market in the United Kingdom

The UK refillable pouch market is forecasted to grow at a CAGR of 5.9% from 2025 to 2035, with demand expected to reach 118,000 metric tons by the end of the period. Growth in refillable packaging is driven by a mix of corporate mandates, policy incentives, and shifting consumer preferences.

The bulk of refillable pouch usage is seen in body washes, pet shampoos, and refill concentrates. Retail-linked pilots, particularly those launched by high-street pharmacy chains, have reported conversion rates above initial benchmarks.

  • Nearly 48% of refill pouches sold in 2024 were in the health and personal care segment.
  • Pouches made with EVOH and PE/EVA layers are being tested by three major UK retailers.
  • 2023 saw a 17% increase in refill pouch imports, with Poland and the Netherlands leading sources.

Demand Forecast for Refillable Pouches Market in China

China’s refillable pouch market is set to grow at a CAGR of 6.7% between 2025 and 2035, with projected demand reaching 624,000 metric tons by 2035. The market is supported by a blend of e-commerce-first product strategies and high-volume usage in refill categories like dishwashing liquids and concentrated fabric softeners.

Chinese packaging converters are scaling up production lines for high-speed form-fill-seal (FFS) machines tailored to refill pouch formats. Local brands are also introducing refill pouches in B2B cleaning products distributed to hotels and institutional buyers.

  • Over 52% of refillable pouch demand is concentrated in five eastern provinces.
  • Nearly 73% of refill pouch materials used are produced domestically, dominated by PE-nylon laminates.
  • More than 300 million refill pouches were sold via e-commerce platforms in 2024 alone.

Analysis of Refillable Pouches Market in India

The refillable pouch industry in India is forecasted to grow at a CAGR of 5.6% from 2025 to 2035, reaching 421,000 metric tons in annual demand by the end of the forecast window. FMCG majors are rolling out refill pouches in mid-size pack formats (400 ml to 1.5 liters), targeting rural and tier-2 markets with affordability as a key lever.

Converter capacity expansion in states like Gujarat and Maharashtra is pushing down unit costs for co-packers. With growing adoption in products like edible oils, handwash, and floor cleaners, refill pouches are becoming standard across multi-use liquid formats.
  • Nearly 55% of refill pouches are manufactured in the western and northern industrial clusters.
  • PET-PE structures dominate, but there’s growing interest in PP-laminate options for oil-based liquids.
  • In 2024, over 62,000 MT of refill pouches were exported, primarily to Southeast Asian countries.

Leading Refillable Pouches Suppliers Manufacturers, Suppliers, Distributors

Refillable Pouches Market Analysis By Company

The refillable pouch market is dominated by established manufacturers like BN Packaging and ZACROS, which compete through specialized designs and faster production cycles. KDWPACK and Impak Corporation target sectors need extended shelf-life solutions with high-barrier materials and precision engineering.

Distributors such as TricorBraun and SunDance USA maintain strong positions by offering value-added services like prototyping and supply chain management. Newer players like EastMoon and Flexible Pack gain traction with modular systems and regional cost advantages, appealing to budget-sensitive buyers.

High capital requirements for filling technology and strict packaging regulations create barriers, but agile firms overcome these by focusing on niche applications and optimized pouch formats. Larger companies like Coveris and FlexPouches invest in R&D and vertical integration to stay ahead, while smaller competitors succeed through targeted innovation.

Recent Industry News

  • In June 2024, BN Packaging Co., Ltd unveiled a lightweight, resealable refill pouch with an integrated spout, targeting the home care and liquid detergent sectors for reduced plastic waste.
  • In February 2025, Coveris partnered with a major European cosmetics brand to launch high-barrier refillable pouches, designed for premium skincare products with airtight resealing technology.

Report Scope

Report Attributes Details
Market Size (2025) USD 3.3 billion
Projected Market Size (2035) USD 5.2 billion
CAGR (2025 to 2035) 4.6%
Base Year for Estimation 2024
Historical Period 2020 to 2024
Projection Period 2025 to 2035
Quantitative Units USD billion for value
Closure Types (Segment 1) Zipper, Spout, Snap-cap, Magnetic
Structure Variants (Segment 2) Single-use Refill Pouch, Rigid-Compatible Pouch, Reusable-Standalone Pouch
Materials Used (Segment 3) PE, PP, PET, Bio-based Plastic, Paper Laminates
Filling Types (Segment 4) Manual Refill, Automatic Machine Compatible
End-Use Industries (Segment 5) Personal Care, Home Care, Food & Beverage, Industrial Fluids, Cosmetics
Regions Covered North America, Europe, Asia-Pacific, Latin America, Middle East & Africa
Countries Covered United States, Canada, Germany, France, China, Japan, South Korea, India, Brazil, Australia
Key Companies Profiled BN Packaging Co., Ltd, ZACROS, KDWPACK, Impak Corporation, Flexible Pouches, TricorBraun, SunDance USA, Flexible Pack, Coveris, EastMoon
Additional Attributes Dollar sales measured across closure type and filling compatibility, share by refill formats in personal care and household categories, increasing demand from liquid food and beauty formulations, adoption in e-commerce and bulk-packaged refills, regional manufacturing clusters in East Asia and Western Europe supporting private label adoption, pouch customization trends driven by refill station models and retail brand circularity programs.

Leading Players

  • Refillable Pouch
  • BN Packaging Co., Ltd
  • ZACROS
  • KDWPACK
  • Impak Corporation
  • Flexible Pouches
  • TricorBraun
  • SunDance USA
  • Flexible Pack
  • Coveris
  • EastMoon

Refillable Pouches Market Analyzed by Key Investment Segments 

By Closure Type:

Zipper, Spout, Snap-cap, Magnetic

By Structure:

Single-use Refill Pouch, Rigid-Compatible Pouch, Reusable-Standalone Pouch

By Material:

PE, PP, PET, Bio-based Plastic, Paper Laminates

By Filling Type:

Manual Refill, Automatic Machine Compatible

By End-Use Industry:

Personal Care, Home Care, Food & Beverage, Industrial Fluids, Cosmetics

By Region:

North America, Latin America, Western Europe, Eastern Europe, East Asia, South Asia & Pacific, Central Asia, Russia and Belarus, Balkan & Baltic Countries, Middle East and Africa

Table of Content

  1. Executive Summary
    • Global Market Outlook
    • Demand-side Trends
    • Supply-side Trends
    • Technology Roadmap Analysis
    • Analysis and Recommendations
  2. Market Overview
    • Market Coverage / Taxonomy
    • Market Definition / Scope / Limitations
  3. Market Background
    • Market Dynamics
      • Drivers
      • Restraints
      • Opportunity
      • Trends
    • Scenario Forecast
      • Demand in Optimistic Scenario
      • Demand in Likely Scenario
      • Demand in Conservative Scenario
    • Opportunity Map Analysis
    • Product Life Cycle Analysis
    • Supply Chain Analysis
      • Supply Side Participants and their Roles
        • Producers
        • Mid-Level Participants (Traders/ Agents/ Brokers)
        • Wholesalers and Distributors
      • Value Added and Value Created at Node in the Supply Chain
      • List of Raw Material Suppliers
      • List of Existing and Potential Buyer’s
    • Investment Feasibility Matrix
    • Value Chain Analysis
      • Profit Margin Analysis
      • Wholesalers and Distributors
      • Retailers
    • PESTLE and Porter’s Analysis
    • Regulatory Landscape
      • By Key Regions
      • By Key Countries
    • Regional Parent Market Outlook
    • Production and Consumption Statistics
    • Import and Export Statistics
  4. Global Market Analysis 2020 to 2024 and Forecast, 2025 to 2035
    • Historical Market Size Value (USD Billion) & Volume (MT) Analysis, 2020 to 2024
    • Current and Future Market Size Value (USD Billion) & Volume (MT) Projections, 2025 to 2035
      • Y-o-Y Growth Trend Analysis
      • Absolute $ Opportunity Analysis
  5. Global Market Pricing Analysis 2020 to 2024 and Forecast 2025 to 2035
  6. Global Market Analysis 2020 to 2024 and Forecast 2025 to 2035, By Closure Type
    • Introduction / Key Findings
    • Historical Market Size Value (USD Billion) & Volume (MT) Analysis By Closure Type, 2020 to 2024
    • Current and Future Market Size Value (USD Billion) & Volume (MT) Analysis and Forecast By Closure Type, 2025 to 2035
      • Zipper
      • Spout
      • Snap-cap
      • Magnetic
    • Y-o-Y Growth Trend Analysis By Closure Type, 2020 to 2024
    • Absolute $ Opportunity Analysis By Closure Type, 2025 to 2035
  7. Global Market Analysis 2020 to 2024 and Forecast 2025 to 2035, By Structure
    • Introduction / Key Findings
    • Historical Market Size Value (USD Billion) & Volume (MT) Analysis By Structure, 2020 to 2024
    • Current and Future Market Size Value (USD Billion) & Volume (MT) Analysis and Forecast By Structure, 2025 to 2035
      • Single-use Refill Pouch
      • Rigid-Compatible Pouch
      • Reusable-Standalone Pouch
    • Y-o-Y Growth Trend Analysis By Structure, 2020 to 2024
    • Absolute $ Opportunity Analysis By Structure, 2025 to 2035
  8. Global Market Analysis 2020 to 2024 and Forecast 2025 to 2035, By Material
    • Introduction / Key Findings
    • Historical Market Size Value (USD Billion) & Volume (MT) Analysis By Material, 2020 to 2024
    • Current and Future Market Size Value (USD Billion) & Volume (MT) Analysis and Forecast By Material, 2025 to 2035
      • PE
      • PP
      • PET
      • Bio-based Plastic
      • Paper Laminates
    • Y-o-Y Growth Trend Analysis By Material, 2020 to 2024
    • Absolute $ Opportunity Analysis By Material, 2025 to 2035
  9. Global Market Analysis 2020 to 2024 and Forecast 2025 to 2035, By Filling Type
    • Introduction / Key Findings
    • Historical Market Size Value (USD Billion) & Volume (MT) Analysis By Filling Type, 2020 to 2024
    • Current and Future Market Size Value (USD Billion) & Volume (MT) Analysis and Forecast By Filling Type, 2025 to 2035
      • Manual Refill
      • Automatic Machine Compatible
    • Y-o-Y Growth Trend Analysis By Filling Type, 2020 to 2024
    • Absolute $ Opportunity Analysis By Filling Type, 2025 to 2035
  10. Global Market Analysis 2020 to 2024 and Forecast 2025 to 2035, By End-Use Industry
    • Introduction / Key Findings
    • Historical Market Size Value (USD Billion) & Volume (MT) Analysis By End-Use Industry, 2020 to 2024
    • Current and Future Market Size Value (USD Billion) & Volume (MT) Analysis and Forecast By End-Use Industry, 2025 to 2035
      • Personal Care
      • Home Care
      • Food & Beverage
      • Industrial Fluids
      • Cosmetics
    • Y-o-Y Growth Trend Analysis By End-Use Industry, 2020 to 2024
    • Absolute $ Opportunity Analysis By End-Use Industry, 2025 to 2035
  11. Global Market Analysis 2020 to 2024 and Forecast 2025 to 2035, By Region
    • Introduction
    • Historical Market Size Value (USD Billion) & Volume (MT) Analysis By Region, 2020 to 2024
    • Current Market Size Value (USD Billion) & Volume (MT) Analysis and Forecast By Region, 2025 to 2035
      • North America
      • Latin America
      • Western Europe
      • Eastern Europe
      • East Asia
      • South Asia & Pacific
      • Middle East and Africa
    • Market Attractiveness Analysis By Region
  12. North America Market Analysis 2020 to 2024 and Forecast 2025 to 2035, By Country
    • Historical Market Size Value (USD Billion) & Volume (MT) Trend Analysis By Market Taxonomy, 2020 to 2024
    • Market Size Value (USD Billion) & Volume (MT) Forecast By Market Taxonomy, 2025 to 2035
      • By Country
        • USA
        • Canada
        • Mexico
      • By Closure Type
      • By Structure
      • By Material
      • By Filling Type
      • By End-Use Industry
    • Market Attractiveness Analysis
      • By Country
      • By Closure Type
      • By Structure
      • By Material
      • By Filling Type
      • By End-Use Industry
    • Key Takeaways
  13. Latin America Market Analysis 2020 to 2024 and Forecast 2025 to 2035, By Country
    • Historical Market Size Value (USD Billion) & Volume (MT) Trend Analysis By Market Taxonomy, 2020 to 2024
    • Market Size Value (USD Billion) & Volume (MT) Forecast By Market Taxonomy, 2025 to 2035
      • By Country
        • Brazil
        • Argentina
        • Rest of LATAM
      • By Closure Type
      • By Structure
      • By Material
      • By Filling Type
      • By End-Use Industry
    • Market Attractiveness Analysis
      • By Country
      • By Closure Type
      • By Structure
      • By Material
      • By Filling Type
      • By End-Use Industry
    • Key Takeaways
  14. Western Europe Market Analysis 2020 to 2024 and Forecast 2025 to 2035, By Country
    • Historical Market Size Value (USD Billion) & Volume (MT) Trend Analysis By Market Taxonomy, 2020 to 2024
    • Market Size Value (USD Billion) & Volume (MT) Forecast By Market Taxonomy, 2025 to 2035
      • By Country
        • Germany
        • Italy
        • France
        • UK
        • Spain
        • BENELUX
        • Nordic
        • Rest of W.Europe
      • By Closure Type
      • By Structure
      • By Material
      • By Filling Type
      • By End-Use Industry
    • Market Attractiveness Analysis
      • By Country
      • By Closure Type
      • By Structure
      • By Material
      • By Filling Type
      • By End-Use Industry
    • Key Takeaways
  15. Eastern Europe Market Analysis 2020 to 2024 and Forecast 2025 to 2035, By Country
    • Historical Market Size Value (USD Billion) & Volume (MT) Trend Analysis By Market Taxonomy, 2020 to 2024
    • Market Size Value (USD Billion) & Volume (MT) Forecast By Market Taxonomy, 2025 to 2035
      • By Country
        • Russia
        • Hungary
        • Poland
        • Balkan & Baltics
        • Rest of E. Europe
      • By Closure Type
      • By Structure
      • By Material
      • By Filling Type
      • By End-Use Industry
    • Market Attractiveness Analysis
      • By Country
      • By Closure Type
      • By Structure
      • By Material
      • By Filling Type
      • By End-Use Industry
    • Key Takeaways
  16. East Asia Market Analysis 2020 to 2024 and Forecast 2025 to 2035, By Country
    • Historical Market Size Value (USD Billion) & Volume (MT) Trend Analysis By Market Taxonomy, 2020 to 2024
    • Market Size Value (USD Billion) & Volume (MT) Forecast By Market Taxonomy, 2025 to 2035
      • By Country
        • China
        • Japan
        • South Korea
      • By Closure Type
      • By Structure
      • By Material
      • By Filling Type
      • By End-Use Industry
    • Market Attractiveness Analysis
      • By Country
      • By Closure Type
      • By Structure
      • By Material
      • By Filling Type
      • By End-Use Industry
    • Key Takeaways
  17. South Asia & Pacific Market Analysis 2020 to 2024 and Forecast 2025 to 2035, By Country
    • Historical Market Size Value (USD Billion) & Volume (MT) Trend Analysis By Market Taxonomy, 2020 to 2024
    • Market Size Value (USD Billion) & Volume (MT) Forecast By Market Taxonomy, 2025 to 2035
      • By Country
        • India
        • Australia & New Zealand
        • ASEAN
        • Rest of SAP
      • By Closure Type
      • By Structure
      • By Material
      • By Filling Type
      • By End-Use Industry
    • Market Attractiveness Analysis
      • By Country
      • By Closure Type
      • By Structure
      • By Material
      • By Filling Type
      • By End-Use Industry
    • Key Takeaways
  18. Middle East and Africa Market Analysis 2020 to 2024 and Forecast 2025 to 2035, By Country
    • Historical Market Size Value (USD Billion) & Volume (MT) Trend Analysis By Market Taxonomy, 2020 to 2024
    • Market Size Value (USD Billion) & Volume (MT) Forecast By Market Taxonomy, 2025 to 2035
      • By Country
        • GCC Countries
        • Northern Africa
        • South Africa
        • Turkiye
        • Rest of MEA
      • By Closure Type
      • By Structure
      • By Material
      • By Filling Type
      • By End-Use Industry
    • Market Attractiveness Analysis
      • By Country
      • By Closure Type
      • By Structure
      • By Material
      • By Filling Type
      • By End-Use Industry
    • Key Takeaways
  19. Key Countries Market Analysis
    • USA
      • Pricing Analysis
      • Market Share Analysis, 2024
        • By Closure Type
        • By Structure
        • By Material
        • By Filling Type
        • By End-Use Industry
    • Canada
      • Pricing Analysis
      • Market Share Analysis, 2024
        • By Closure Type
        • By Structure
        • By Material
        • By Filling Type
        • By End-Use Industry
    • Brazil
      • Pricing Analysis
      • Market Share Analysis, 2024
        • By Closure Type
        • By Structure
        • By Material
        • By Filling Type
        • By End-Use Industry
    • Mexico
      • Pricing Analysis
      • Market Share Analysis, 2024
        • By Closure Type
        • By Structure
        • By Material
        • By Filling Type
        • By End-Use Industry
    • Argentina
      • Pricing Analysis
      • Market Share Analysis, 2024
        • By Closure Type
        • By Structure
        • By Material
        • By Filling Type
        • By End-Use Industry
  20. Market Structure Analysis
    • Competition Dashboard
    • Competition Benchmarking
    • Market Share Analysis of Top Players
      • By Regional
      • By Closure Type
      • By Structure
      • By Material
      • By Filling Type
      • By End-Use Industry
  21. Competition Analysis
    • Competition Deep Dive
      • Refillable Pouch
        • Overview
        • Product Portfolio
        • Profitability by Market Segments (Product/Age /Sales Channel/Region)
        • Sales Footprint
        • Strategy Overview
          • Marketing Strategy
          • Product Strategy
          • Channel Strategy
      • BN Packaging Co.,Ltd
        • Overview
        • Product Portfolio
        • Profitability by Market Segments (Product/Age /Sales Channel/Region)
        • Sales Footprint
        • Strategy Overview
          • Marketing Strategy
          • Product Strategy
          • Channel Strategy
      • ZACROS
        • Overview
        • Product Portfolio
        • Profitability by Market Segments (Product/Age /Sales Channel/Region)
        • Sales Footprint
        • Strategy Overview
          • Marketing Strategy
          • Product Strategy
          • Channel Strategy
      • KDWPACK
        • Overview
        • Product Portfolio
        • Profitability by Market Segments (Product/Age /Sales Channel/Region)
        • Sales Footprint
        • Strategy Overview
          • Marketing Strategy
          • Product Strategy
          • Channel Strategy
      • Impak Corporation
        • Overview
        • Product Portfolio
        • Profitability by Market Segments (Product/Age /Sales Channel/Region)
        • Sales Footprint
        • Strategy Overview
          • Marketing Strategy
          • Product Strategy
          • Channel Strategy
      • Flexible Pouches
        • Overview
        • Product Portfolio
        • Profitability by Market Segments (Product/Age /Sales Channel/Region)
        • Sales Footprint
        • Strategy Overview
          • Marketing Strategy
          • Product Strategy
          • Channel Strategy
      • TricorBraun
        • Overview
        • Product Portfolio
        • Profitability by Market Segments (Product/Age /Sales Channel/Region)
        • Sales Footprint
        • Strategy Overview
          • Marketing Strategy
          • Product Strategy
          • Channel Strategy
      • SunDance USA
        • Overview
        • Product Portfolio
        • Profitability by Market Segments (Product/Age /Sales Channel/Region)
        • Sales Footprint
        • Strategy Overview
          • Marketing Strategy
          • Product Strategy
          • Channel Strategy
      • Flexible Pack
        • Overview
        • Product Portfolio
        • Profitability by Market Segments (Product/Age /Sales Channel/Region)
        • Sales Footprint
        • Strategy Overview
          • Marketing Strategy
          • Product Strategy
          • Channel Strategy
      • Coveris
        • Overview
        • Product Portfolio
        • Profitability by Market Segments (Product/Age /Sales Channel/Region)
        • Sales Footprint
        • Strategy Overview
          • Marketing Strategy
          • Product Strategy
          • Channel Strategy
      • EastMoon
        • Overview
        • Product Portfolio
        • Profitability by Market Segments (Product/Age /Sales Channel/Region)
        • Sales Footprint
        • Strategy Overview
          • Marketing Strategy
          • Product Strategy
          • Channel Strategy
  22. Assumptions & Acronyms Used
  23. Research Methodology

List of Tables

  • Table 1: Global Market Value (USD Billion) Forecast by Region, 2020 to 2035
  • Table 2: Global Market Volume (MT) Forecast by Region, 2020 to 2035
  • Table 3: Global Market Value (USD Billion) Forecast by Closure Type, 2020 to 2035
  • Table 4: Global Market Volume (MT) Forecast by Closure Type, 2020 to 2035
  • Table 5: Global Market Value (USD Billion) Forecast by Structure, 2020 to 2035
  • Table 6: Global Market Volume (MT) Forecast by Structure, 2020 to 2035
  • Table 7: Global Market Value (USD Billion) Forecast by Material, 2020 to 2035
  • Table 8: Global Market Volume (MT) Forecast by Material, 2020 to 2035
  • Table 9: Global Market Value (USD Billion) Forecast by Filling Type, 2020 to 2035
  • Table 10: Global Market Volume (MT) Forecast by Filling Type, 2020 to 2035
  • Table 11: Global Market Value (USD Billion) Forecast by End-Use Industry, 2020 to 2035
  • Table 12: Global Market Volume (MT) Forecast by End-Use Industry, 2020 to 2035
  • Table 13: North America Market Value (USD Billion) Forecast by Country, 2020 to 2035
  • Table 14: North America Market Volume (MT) Forecast by Country, 2020 to 2035
  • Table 15: North America Market Value (USD Billion) Forecast by Closure Type, 2020 to 2035
  • Table 16: North America Market Volume (MT) Forecast by Closure Type, 2020 to 2035
  • Table 17: North America Market Value (USD Billion) Forecast by Structure, 2020 to 2035
  • Table 18: North America Market Volume (MT) Forecast by Structure, 2020 to 2035
  • Table 19: North America Market Value (USD Billion) Forecast by Material, 2020 to 2035
  • Table 20: North America Market Volume (MT) Forecast by Material, 2020 to 2035
  • Table 21: North America Market Value (USD Billion) Forecast by Filling Type, 2020 to 2035
  • Table 22: North America Market Volume (MT) Forecast by Filling Type, 2020 to 2035
  • Table 23: North America Market Value (USD Billion) Forecast by End-Use Industry, 2020 to 2035
  • Table 24: North America Market Volume (MT) Forecast by End-Use Industry, 2020 to 2035
  • Table 25: Latin America Market Value (USD Billion) Forecast by Country, 2020 to 2035
  • Table 26: Latin America Market Volume (MT) Forecast by Country, 2020 to 2035
  • Table 27: Latin America Market Value (USD Billion) Forecast by Closure Type, 2020 to 2035
  • Table 28: Latin America Market Volume (MT) Forecast by Closure Type, 2020 to 2035
  • Table 29: Latin America Market Value (USD Billion) Forecast by Structure, 2020 to 2035
  • Table 30: Latin America Market Volume (MT) Forecast by Structure, 2020 to 2035
  • Table 31: Latin America Market Value (USD Billion) Forecast by Material, 2020 to 2035
  • Table 32: Latin America Market Volume (MT) Forecast by Material, 2020 to 2035
  • Table 33: Latin America Market Value (USD Billion) Forecast by Filling Type, 2020 to 2035
  • Table 34: Latin America Market Volume (MT) Forecast by Filling Type, 2020 to 2035
  • Table 35: Latin America Market Value (USD Billion) Forecast by End-Use Industry, 2020 to 2035
  • Table 36: Latin America Market Volume (MT) Forecast by End-Use Industry, 2020 to 2035
  • Table 37: Western Europe Market Value (USD Billion) Forecast by Country, 2020 to 2035
  • Table 38: Western Europe Market Volume (MT) Forecast by Country, 2020 to 2035
  • Table 39: Western Europe Market Value (USD Billion) Forecast by Closure Type, 2020 to 2035
  • Table 40: Western Europe Market Volume (MT) Forecast by Closure Type, 2020 to 2035
  • Table 41: Western Europe Market Value (USD Billion) Forecast by Structure, 2020 to 2035
  • Table 42: Western Europe Market Volume (MT) Forecast by Structure, 2020 to 2035
  • Table 43: Western Europe Market Value (USD Billion) Forecast by Material, 2020 to 2035
  • Table 44: Western Europe Market Volume (MT) Forecast by Material, 2020 to 2035
  • Table 45: Western Europe Market Value (USD Billion) Forecast by Filling Type, 2020 to 2035
  • Table 46: Western Europe Market Volume (MT) Forecast by Filling Type, 2020 to 2035
  • Table 47: Western Europe Market Value (USD Billion) Forecast by End-Use Industry, 2020 to 2035
  • Table 48: Western Europe Market Volume (MT) Forecast by End-Use Industry, 2020 to 2035
  • Table 49: Eastern Europe Market Value (USD Billion) Forecast by Country, 2020 to 2035
  • Table 50: Eastern Europe Market Volume (MT) Forecast by Country, 2020 to 2035
  • Table 51: Eastern Europe Market Value (USD Billion) Forecast by Closure Type, 2020 to 2035
  • Table 52: Eastern Europe Market Volume (MT) Forecast by Closure Type, 2020 to 2035
  • Table 53: Eastern Europe Market Value (USD Billion) Forecast by Structure, 2020 to 2035
  • Table 54: Eastern Europe Market Volume (MT) Forecast by Structure, 2020 to 2035
  • Table 55: Eastern Europe Market Value (USD Billion) Forecast by Material, 2020 to 2035
  • Table 56: Eastern Europe Market Volume (MT) Forecast by Material, 2020 to 2035
  • Table 57: Eastern Europe Market Value (USD Billion) Forecast by Filling Type, 2020 to 2035
  • Table 58: Eastern Europe Market Volume (MT) Forecast by Filling Type, 2020 to 2035
  • Table 59: Eastern Europe Market Value (USD Billion) Forecast by End-Use Industry, 2020 to 2035
  • Table 60: Eastern Europe Market Volume (MT) Forecast by End-Use Industry, 2020 to 2035
  • Table 61: East Asia Market Value (USD Billion) Forecast by Country, 2020 to 2035
  • Table 62: East Asia Market Volume (MT) Forecast by Country, 2020 to 2035
  • Table 63: East Asia Market Value (USD Billion) Forecast by Closure Type, 2020 to 2035
  • Table 64: East Asia Market Volume (MT) Forecast by Closure Type, 2020 to 2035
  • Table 65: East Asia Market Value (USD Billion) Forecast by Structure, 2020 to 2035
  • Table 66: East Asia Market Volume (MT) Forecast by Structure, 2020 to 2035
  • Table 67: East Asia Market Value (USD Billion) Forecast by Material, 2020 to 2035
  • Table 68: East Asia Market Volume (MT) Forecast by Material, 2020 to 2035
  • Table 69: East Asia Market Value (USD Billion) Forecast by Filling Type, 2020 to 2035
  • Table 70: East Asia Market Volume (MT) Forecast by Filling Type, 2020 to 2035
  • Table 71: East Asia Market Value (USD Billion) Forecast by End-Use Industry, 2020 to 2035
  • Table 72: East Asia Market Volume (MT) Forecast by End-Use Industry, 2020 to 2035
  • Table 73: South Asia & Pacific Market Value (USD Billion) Forecast by Country, 2020 to 2035
  • Table 74: South Asia & Pacific Market Volume (MT) Forecast by Country, 2020 to 2035
  • Table 75: South Asia & Pacific Market Value (USD Billion) Forecast by Closure Type, 2020 to 2035
  • Table 76: South Asia & Pacific Market Volume (MT) Forecast by Closure Type, 2020 to 2035
  • Table 77: South Asia & Pacific Market Value (USD Billion) Forecast by Structure, 2020 to 2035
  • Table 78: South Asia & Pacific Market Volume (MT) Forecast by Structure, 2020 to 2035
  • Table 79: South Asia & Pacific Market Value (USD Billion) Forecast by Material, 2020 to 2035
  • Table 80: South Asia & Pacific Market Volume (MT) Forecast by Material, 2020 to 2035
  • Table 81: South Asia & Pacific Market Value (USD Billion) Forecast by Filling Type, 2020 to 2035
  • Table 82: South Asia & Pacific Market Volume (MT) Forecast by Filling Type, 2020 to 2035
  • Table 83: South Asia & Pacific Market Value (USD Billion) Forecast by End-Use Industry, 2020 to 2035
  • Table 84: South Asia & Pacific Market Volume (MT) Forecast by End-Use Industry, 2020 to 2035
  • Table 85: Middle East and Africa Market Value (USD Billion) Forecast by Country, 2020 to 2035
  • Table 86: Middle East and Africa Market Volume (MT) Forecast by Country, 2020 to 2035
  • Table 87: Middle East and Africa Market Value (USD Billion) Forecast by Closure Type, 2020 to 2035
  • Table 88: Middle East and Africa Market Volume (MT) Forecast by Closure Type, 2020 to 2035
  • Table 89: Middle East and Africa Market Value (USD Billion) Forecast by Structure, 2020 to 2035
  • Table 90: Middle East and Africa Market Volume (MT) Forecast by Structure, 2020 to 2035
  • Table 91: Middle East and Africa Market Value (USD Billion) Forecast by Material, 2020 to 2035
  • Table 92: Middle East and Africa Market Volume (MT) Forecast by Material, 2020 to 2035
  • Table 93: Middle East and Africa Market Value (USD Billion) Forecast by Filling Type, 2020 to 2035
  • Table 94: Middle East and Africa Market Volume (MT) Forecast by Filling Type, 2020 to 2035
  • Table 95: Middle East and Africa Market Value (USD Billion) Forecast by End-Use Industry, 2020 to 2035
  • Table 96: Middle East and Africa Market Volume (MT) Forecast by End-Use Industry, 2020 to 2035

List of Figures

  • Figure 1: Global Market Volume (MT) Forecast 2020 to 2035
  • Figure 2: Global Market Pricing Analysis
  • Figure 3: Global Market Value (USD Billion) Forecast 2020 to 2035
  • Figure 4: Global Market Value Share and BPS Analysis by Closure Type, 2025 and 2035
  • Figure 5: Global Market Y-o-Y Growth Comparison by Closure Type, 2025 to 2035
  • Figure 6: Global Market Attractiveness Analysis by Closure Type
  • Figure 7: Global Market Value Share and BPS Analysis by Structure, 2025 and 2035
  • Figure 8: Global Market Y-o-Y Growth Comparison by Structure, 2025 to 2035
  • Figure 9: Global Market Attractiveness Analysis by Structure
  • Figure 10: Global Market Value Share and BPS Analysis by Material, 2025 and 2035
  • Figure 11: Global Market Y-o-Y Growth Comparison by Material, 2025 to 2035
  • Figure 12: Global Market Attractiveness Analysis by Material
  • Figure 13: Global Market Value Share and BPS Analysis by Filling Type, 2025 and 2035
  • Figure 14: Global Market Y-o-Y Growth Comparison by Filling Type, 2025 to 2035
  • Figure 15: Global Market Attractiveness Analysis by Filling Type
  • Figure 16: Global Market Value Share and BPS Analysis by End-Use Industry, 2025 and 2035
  • Figure 17: Global Market Y-o-Y Growth Comparison by End-Use Industry, 2025 to 2035
  • Figure 18: Global Market Attractiveness Analysis by End-Use Industry
  • Figure 19: Global Market Value (USD Billion) Share and BPS Analysis by Region, 2025 and 2035
  • Figure 20: Global Market Y-o-Y Growth Comparison by Region, 2025 to 2035
  • Figure 21: Global Market Attractiveness Analysis by Region
  • Figure 22: North America Market Incremental $ Opportunity, 2025 to 2035
  • Figure 23: Latin America Market Incremental $ Opportunity, 2025 to 2035
  • Figure 24: Western Europe Market Incremental $ Opportunity, 2025 to 2035
  • Figure 25: Eastern Europe Market Incremental $ Opportunity, 2025 to 2035
  • Figure 26: East Asia Market Incremental $ Opportunity, 2025 to 2035
  • Figure 27: South Asia & Pacific Market Incremental $ Opportunity, 2025 to 2035
  • Figure 28: Middle East and Africa Market Incremental $ Opportunity, 2025 to 2035
  • Figure 29: North America Market Value Share and BPS Analysis by Country, 2025 and 2035
  • Figure 30: North America Market Value Share and BPS Analysis by Closure Type, 2025 and 2035
  • Figure 31: North America Market Y-o-Y Growth Comparison by Closure Type, 2025 to 2035
  • Figure 32: North America Market Attractiveness Analysis by Closure Type
  • Figure 33: North America Market Value Share and BPS Analysis by Structure, 2025 and 2035
  • Figure 34: North America Market Y-o-Y Growth Comparison by Structure, 2025 to 2035
  • Figure 35: North America Market Attractiveness Analysis by Structure
  • Figure 36: North America Market Value Share and BPS Analysis by Material, 2025 and 2035
  • Figure 37: North America Market Y-o-Y Growth Comparison by Material, 2025 to 2035
  • Figure 38: North America Market Attractiveness Analysis by Material
  • Figure 39: North America Market Value Share and BPS Analysis by Filling Type, 2025 and 2035
  • Figure 40: North America Market Y-o-Y Growth Comparison by Filling Type, 2025 to 2035
  • Figure 41: North America Market Attractiveness Analysis by Filling Type
  • Figure 42: North America Market Value Share and BPS Analysis by End-Use Industry, 2025 and 2035
  • Figure 43: North America Market Y-o-Y Growth Comparison by End-Use Industry, 2025 to 2035
  • Figure 44: North America Market Attractiveness Analysis by End-Use Industry
  • Figure 45: Latin America Market Value Share and BPS Analysis by Country, 2025 and 2035
  • Figure 46: Latin America Market Value Share and BPS Analysis by Closure Type, 2025 and 2035
  • Figure 47: Latin America Market Y-o-Y Growth Comparison by Closure Type, 2025 to 2035
  • Figure 48: Latin America Market Attractiveness Analysis by Closure Type
  • Figure 49: Latin America Market Value Share and BPS Analysis by Structure, 2025 and 2035
  • Figure 50: Latin America Market Y-o-Y Growth Comparison by Structure, 2025 to 2035
  • Figure 51: Latin America Market Attractiveness Analysis by Structure
  • Figure 52: Latin America Market Value Share and BPS Analysis by Material, 2025 and 2035
  • Figure 53: Latin America Market Y-o-Y Growth Comparison by Material, 2025 to 2035
  • Figure 54: Latin America Market Attractiveness Analysis by Material
  • Figure 55: Latin America Market Value Share and BPS Analysis by Filling Type, 2025 and 2035
  • Figure 56: Latin America Market Y-o-Y Growth Comparison by Filling Type, 2025 to 2035
  • Figure 57: Latin America Market Attractiveness Analysis by Filling Type
  • Figure 58: Latin America Market Value Share and BPS Analysis by End-Use Industry, 2025 and 2035
  • Figure 59: Latin America Market Y-o-Y Growth Comparison by End-Use Industry, 2025 to 2035
  • Figure 60: Latin America Market Attractiveness Analysis by End-Use Industry
  • Figure 61: Western Europe Market Value Share and BPS Analysis by Country, 2025 and 2035
  • Figure 62: Western Europe Market Value Share and BPS Analysis by Closure Type, 2025 and 2035
  • Figure 63: Western Europe Market Y-o-Y Growth Comparison by Closure Type, 2025 to 2035
  • Figure 64: Western Europe Market Attractiveness Analysis by Closure Type
  • Figure 65: Western Europe Market Value Share and BPS Analysis by Structure, 2025 and 2035
  • Figure 66: Western Europe Market Y-o-Y Growth Comparison by Structure, 2025 to 2035
  • Figure 67: Western Europe Market Attractiveness Analysis by Structure
  • Figure 68: Western Europe Market Value Share and BPS Analysis by Material, 2025 and 2035
  • Figure 69: Western Europe Market Y-o-Y Growth Comparison by Material, 2025 to 2035
  • Figure 70: Western Europe Market Attractiveness Analysis by Material
  • Figure 71: Western Europe Market Value Share and BPS Analysis by Filling Type, 2025 and 2035
  • Figure 72: Western Europe Market Y-o-Y Growth Comparison by Filling Type, 2025 to 2035
  • Figure 73: Western Europe Market Attractiveness Analysis by Filling Type
  • Figure 74: Western Europe Market Value Share and BPS Analysis by End-Use Industry, 2025 and 2035
  • Figure 75: Western Europe Market Y-o-Y Growth Comparison by End-Use Industry, 2025 to 2035
  • Figure 76: Western Europe Market Attractiveness Analysis by End-Use Industry
  • Figure 77: Eastern Europe Market Value Share and BPS Analysis by Country, 2025 and 2035
  • Figure 78: Eastern Europe Market Value Share and BPS Analysis by Closure Type, 2025 and 2035
  • Figure 79: Eastern Europe Market Y-o-Y Growth Comparison by Closure Type, 2025 to 2035
  • Figure 80: Eastern Europe Market Attractiveness Analysis by Closure Type
  • Figure 81: Eastern Europe Market Value Share and BPS Analysis by Structure, 2025 and 2035
  • Figure 82: Eastern Europe Market Y-o-Y Growth Comparison by Structure, 2025 to 2035
  • Figure 83: Eastern Europe Market Attractiveness Analysis by Structure
  • Figure 84: Eastern Europe Market Value Share and BPS Analysis by Material, 2025 and 2035
  • Figure 85: Eastern Europe Market Y-o-Y Growth Comparison by Material, 2025 to 2035
  • Figure 86: Eastern Europe Market Attractiveness Analysis by Material
  • Figure 87: Eastern Europe Market Value Share and BPS Analysis by Filling Type, 2025 and 2035
  • Figure 88: Eastern Europe Market Y-o-Y Growth Comparison by Filling Type, 2025 to 2035
  • Figure 89: Eastern Europe Market Attractiveness Analysis by Filling Type
  • Figure 90: Eastern Europe Market Value Share and BPS Analysis by End-Use Industry, 2025 and 2035
  • Figure 91: Eastern Europe Market Y-o-Y Growth Comparison by End-Use Industry, 2025 to 2035
  • Figure 92: Eastern Europe Market Attractiveness Analysis by End-Use Industry
  • Figure 93: East Asia Market Value Share and BPS Analysis by Country, 2025 and 2035
  • Figure 94: East Asia Market Value Share and BPS Analysis by Closure Type, 2025 and 2035
  • Figure 95: East Asia Market Y-o-Y Growth Comparison by Closure Type, 2025 to 2035
  • Figure 96: East Asia Market Attractiveness Analysis by Closure Type
  • Figure 97: East Asia Market Value Share and BPS Analysis by Structure, 2025 and 2035
  • Figure 98: East Asia Market Y-o-Y Growth Comparison by Structure, 2025 to 2035
  • Figure 99: East Asia Market Attractiveness Analysis by Structure
  • Figure 100: East Asia Market Value Share and BPS Analysis by Material, 2025 and 2035
  • Figure 101: East Asia Market Y-o-Y Growth Comparison by Material, 2025 to 2035
  • Figure 102: East Asia Market Attractiveness Analysis by Material
  • Figure 103: East Asia Market Value Share and BPS Analysis by Filling Type, 2025 and 2035
  • Figure 104: East Asia Market Y-o-Y Growth Comparison by Filling Type, 2025 to 2035
  • Figure 105: East Asia Market Attractiveness Analysis by Filling Type
  • Figure 106: East Asia Market Value Share and BPS Analysis by End-Use Industry, 2025 and 2035
  • Figure 107: East Asia Market Y-o-Y Growth Comparison by End-Use Industry, 2025 to 2035
  • Figure 108: East Asia Market Attractiveness Analysis by End-Use Industry
  • Figure 109: South Asia & Pacific Market Value Share and BPS Analysis by Country, 2025 and 2035
  • Figure 110: South Asia & Pacific Market Value Share and BPS Analysis by Closure Type, 2025 and 2035
  • Figure 111: South Asia & Pacific Market Y-o-Y Growth Comparison by Closure Type, 2025 to 2035
  • Figure 112: South Asia & Pacific Market Attractiveness Analysis by Closure Type
  • Figure 113: South Asia & Pacific Market Value Share and BPS Analysis by Structure, 2025 and 2035
  • Figure 114: South Asia & Pacific Market Y-o-Y Growth Comparison by Structure, 2025 to 2035
  • Figure 115: South Asia & Pacific Market Attractiveness Analysis by Structure
  • Figure 116: South Asia & Pacific Market Value Share and BPS Analysis by Material, 2025 and 2035
  • Figure 117: South Asia & Pacific Market Y-o-Y Growth Comparison by Material, 2025 to 2035
  • Figure 118: South Asia & Pacific Market Attractiveness Analysis by Material
  • Figure 119: South Asia & Pacific Market Value Share and BPS Analysis by Filling Type, 2025 and 2035
  • Figure 120: South Asia & Pacific Market Y-o-Y Growth Comparison by Filling Type, 2025 to 2035
  • Figure 121: South Asia & Pacific Market Attractiveness Analysis by Filling Type
  • Figure 122: South Asia & Pacific Market Value Share and BPS Analysis by End-Use Industry, 2025 and 2035
  • Figure 123: South Asia & Pacific Market Y-o-Y Growth Comparison by End-Use Industry, 2025 to 2035
  • Figure 124: South Asia & Pacific Market Attractiveness Analysis by End-Use Industry
  • Figure 125: Middle East and Africa Market Value Share and BPS Analysis by Country, 2025 and 2035
  • Figure 126: Middle East and Africa Market Value Share and BPS Analysis by Closure Type, 2025 and 2035
  • Figure 127: Middle East and Africa Market Y-o-Y Growth Comparison by Closure Type, 2025 to 2035
  • Figure 128: Middle East and Africa Market Attractiveness Analysis by Closure Type
  • Figure 129: Middle East and Africa Market Value Share and BPS Analysis by Structure, 2025 and 2035
  • Figure 130: Middle East and Africa Market Y-o-Y Growth Comparison by Structure, 2025 to 2035
  • Figure 131: Middle East and Africa Market Attractiveness Analysis by Structure
  • Figure 132: Middle East and Africa Market Value Share and BPS Analysis by Material, 2025 and 2035
  • Figure 133: Middle East and Africa Market Y-o-Y Growth Comparison by Material, 2025 to 2035
  • Figure 134: Middle East and Africa Market Attractiveness Analysis by Material
  • Figure 135: Middle East and Africa Market Value Share and BPS Analysis by Filling Type, 2025 and 2035
  • Figure 136: Middle East and Africa Market Y-o-Y Growth Comparison by Filling Type, 2025 to 2035
  • Figure 137: Middle East and Africa Market Attractiveness Analysis by Filling Type
  • Figure 138: Middle East and Africa Market Value Share and BPS Analysis by End-Use Industry, 2025 and 2035
  • Figure 139: Middle East and Africa Market Y-o-Y Growth Comparison by End-Use Industry, 2025 to 2035
  • Figure 140: Middle East and Africa Market Attractiveness Analysis by End-Use Industry
  • Figure 141: Global Market - Tier Structure Analysis
  • Figure 142: Global Market - Company Share Analysis

Frequently Asked Questions

What is the projected market size of refillable pouches by 2035?

The market is projected to reach USD 5.2 billion by 2035, up from USD 3.3 billion in 2025.

Which pouch format holds the largest market share?

Zipper closures hold the largest share at 55% in 2025.

Which application segment accounts for the highest demand?

Personal care products account for 49% of total demand in 2025.

Which country is expected to witness the fastest growth in this market?

China is expected to grow at the fastest pace with a CAGR of 6.7%.

What material dominates refillable pouch production?

PE-based films lead with a 48% share in pouch material usage.

Explore Similar Insights

Future Market Insights

Refillable Pouches Market