Bio PE Pouches Market Size and Share Forecast Outlook For 2025 to 2035

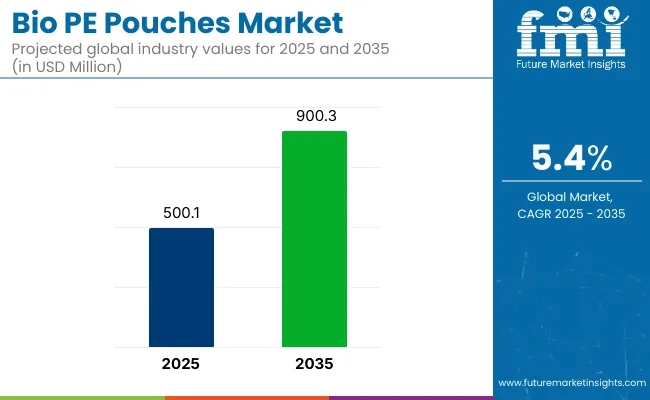
The bio PE pouches market is projected to grow from USD 500.1 million in 2025 to USD 900.3 million by 2035, registering a CAGR of 5.4% during the forecast period. Sales in 2024 crossed USD 400 million, underscoring the sector's resilience and growing demand across food & beverage, personal care, and pharmaceutical industries. This growth is attributed to the increasing need for biodegradable, durable, and sustainable packaging solutions that ensure product integrity while reducing environmental impact.
Bio PE Pouches Market

Metric Value
Market Size in 2025 USD 500.1 million
Projected Market Size in 2035 USD 900.3 million
CAGR (2025 to 2035) 5.4%

Companies are investing in expanding their production capacities and enhancing product offerings to meet the growing demand for bio-PE pouches. In May 2025, Amcor, a global leader in developing and producing responsible packaging solutions, and forestry industry company Metsä Group, announced a collaboration to develop three-dimensional molded fiber packaging solutions with lidding and liner for a variety of food applications. The collaboration underscores Amcor and Metsä Group’s commitment to sustainability and innovation by creating recycle-ready packaging solutions.

Ilya Syshchikov, Amcor’s Vice President, Global Fiber, said, “I am excited about this collaboration with our good partner Metsä. Both parties bring a wealth of materials, packaging and market knowledge to deliver more sustainable solutions to our customers with exceptional quality, functionality and efficiency”.

The shift towards sustainable and eco-friendly packaging solutions is influencing the bio-PE pouches market. Manufacturers are focusing on developing pouches that are biodegradable, recyclable, and made from renewable resources. Innovations include the integration of barrier properties to enhance shelf life and the use of water-based inks for printing to reduce environmental impact. These advancements align with global sustainability goals and regulatory requirements, making bio-PE pouches an attractive option for environmentally conscious businesses.

The bio-PE pouches market is poised for significant growth, driven by increasing demand in food & beverage, personal care, and pharmaceutical industries. Companies investing in sustainable materials, innovative designs, and eco-friendly production processes are expected to gain a competitive edge. As global supply chains expand and environmental regulations become more stringent, the adoption of bio-PE pouches is anticipated to rise, offering cost-effective and sustainable packaging solutions.

Analyzing Bio PE Pouches Market by Top Investment Segments

Food & Beverage Industry Fuels Bio-PE Pouch Adoption amid Rising Demand for Sustainable Flexible Packaging

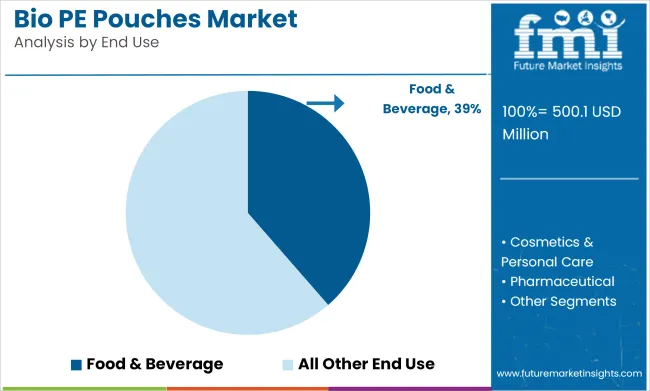
The food & beverage industry is projected to account for over 38.6% of the global Bio-PE pouch market by 2025, making it the largest end-use segment for this sustainable packaging solution. As consumer and regulatory pressures intensify around eco-friendly packaging, food brands are increasingly transitioning to bio-based polyethylene (Bio-PE) pouches to reduce reliance on fossil fuels and lower their carbon footprint.

Bio-PE pouches, derived from renewable feedstocks like sugarcane ethanol, offer similar performance characteristics to conventional polyethylene-such as flexibility, sealability, and barrier protection-while delivering up to 70% lower greenhouse gas emissions over their lifecycle. These advantages make them particularly suitable for packaging snacks, dry goods, frozen foods, sauces, dairy, and ready-to-eat products.
Bio Pe Pouches Market Analysis By End Use

With governments in regions such as Europe and North America mandating stricter single-use plastic restrictions and extended producer responsibility (EPR) programs, food & beverage companies are shifting toward recyclable and bio-based flexible formats like Bio-PE. Major players in the F&B sector are also leveraging Bio-PE’s compatibility with existing packaging lines to make cost-effective, low-impact material transitions.

Additionally, innovations in multilayer Bio-PE films with enhanced oxygen and moisture barriers are enabling longer shelf life and improved product preservation, further accelerating adoption in convenience and retail food packaging. As the global market for green packaging surpasses USD 200 billion, the food & beverage segment is expected to remain a primary growth engine for Bio-PE pouch demand.

Spout Pouches Gain Momentum for Liquid Packaging and Controlled Dispensing

Spout pouches are anticipated to lead the product type segment in the bio-PE pouches market, accounting for approximately 35.6% market share by 2025, due to their rising popularity in liquid, semi-liquid, and refillable product categories. These pouches combine the flexibility of traditional pouches with the convenience of a resalable spout, making them an ideal solution for beverages, baby food, personal care, and household cleaning products.

Spout pouches made from bio-based and blended polymers are gaining adoption as brands shift toward refillable and lower-waste formats that reduce reliance on rigid plastic bottles. Their lightweight nature and reduced material use translate into lower transportation emissions and cost savings, while offering end users enhanced portability and portion control.

In the circular economy landscape, spout pouches also support refill models, enabling consumers to buy concentrates or bulk formats in reusable containers. Technological advances in pouch-spout sealing and tamper-evidence have further enhanced the integrity and safety of these packages for sensitive contents

As e-commerce, urban living, and sustainability reshape consumer packaging preferences, spout pouches provide a high-performance, low-impact alternative to conventional rigid plastic formats-positioning them as a critical format in the bio-PE pouch portfolio going forward.

Challenges and Opportunities

Challenges

High Production Costs and Limited Raw Material Availability

High production cost and low raw material availability of bio-based materials are some threats that the Bio PE Pouches Market is facing. Of the renewable plastics commonly used today, bio-polyethylene (Bio PE) is produced from renewable feed stocks like sugarcane, making it an expensive yet volatile commodity dependent on regional supply chains. Moreover, shifting from traditional plastic pouches to bio-based pouches will require a massive investment in production infrastructure and technology.

Regulatory Compliance and Performance Limitations

Biodegradable and Compostable Compliance around the World. Bio-PE pouches have certain environmental regulations and are long tests in certifications. Successful alternatives such as bio-based pouches also had limitations as compared to traditional plastic; these have not proven as renewable, durable, or long-lasting and therefore do not see mainstream adoption

Opportunities

Growing Demand for Sustainable Packaging Solutions

As consumers become ever more aware of their waste and new regulations push for greener packaging, the environment presents a huge opportunity for Bio PE Pouches Market growth. Brands want to reduce their carbon footprint and reach their sustainability goals, thus increasing the demand for biodegradable and recyclable pouches. This will benefit companies in new bio-based materials and sustainable

Advancements in Biopolymer Technology and Circular Economy Initiatives

Boosting consumer awareness and regulatory focus on environmentally sustainable packaging is creating massive opportunity for expansion of Bio PE Pouches Market. Brands are also mindful of the need to meet their sustainability goals, fueling the increased demand for biodegradable and recyclable pouches in the era of climate change. This change will benefit businesses that focus on new bio-based materials and sustainable extraction processes.
Region-wise Outlook - Bio PE Pouches Market

Country Wise Analysis Of Bio Pe Pouches Market

United States

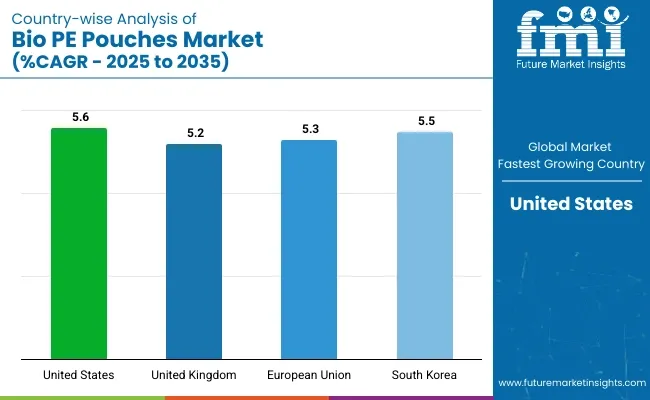
The USA Bio PE Pouches market is expanding due to rising environmental concerns, government regulations promoting sustainable packaging, and increasing consumer preference for biodegradable and recyclable packaging solutions across various industries.

Region CAGR (2025 to 2035)
United States 5.6%

United Kingdom

The UK market is witnessing growth driven by stringent plastic waste reduction policies, advancements in bio-based packaging materials, and increased adoption of sustainable alternatives in the food and beverage sector.

Region CAGR (2025 to 2035)
United Kingdom 5.2%

European Union

The European Union is leading in the adoption of Bio PE Pouches due to strict sustainability mandates, increasing corporate responsibility initiatives, and growing demand for eco-friendly packaging solutions in retail and consumer goods.

Region CAGR (2025 to 2035)
European Union 5.3%

South Korea

South Korea’s Bio PE Pouches market is expanding as the country intensifies efforts to reduce plastic waste, implement sustainable packaging laws, and promote bio-based materials in the cosmetics and personal care industries.

Region CAGR (2025 to 2035)
South Korea 5.5%

Overall Market Trend

The Bio PE Pouches market is witnessing steady growth worldwide, driven by increasing regulatory support, consumer demand for green packaging, and advancements in biopolymer technology.

Competitive Outlook

The global Bio PE pouches market is experiencing strong growth due to increasing demand for sustainable and eco-friendly packaging solutions. The shift towards biodegradable and compostable materials, coupled with stringent environmental regulations, is driving market expansion. Industries such as food & beverage, cosmetics, pharmaceuticals, and personal care are adopting Bio PE pouches as a viable alternative to traditional plastic packaging.
Key Market Insights

Bio Pe Pouches Market Analysis By Company

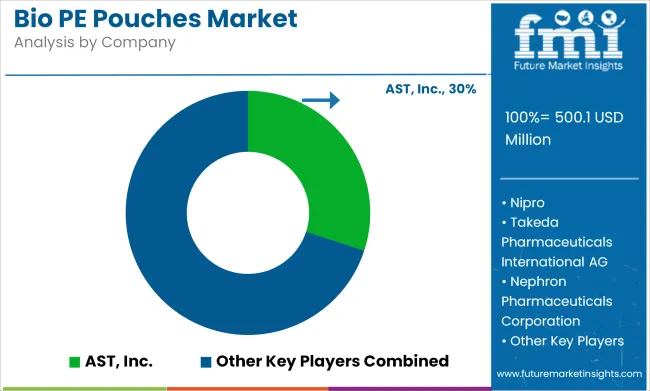
Amcor Plc (20-25%)

Bio PE pouches are a leading product line for Amcor, and offers innovative, high-barrier, recyclable solutions to industries.

Mondi Group (15-20%)

Mondi Develops Sustainable, Biodegradable Pouch Packaging to Meet Growing Eco-Friendly Consumer Demand

Sealed Air Corporation (12-16%)

The Bio PE pouches from Sealed Air are strong and moisture-resistant pouches designed to increase the shelf life of packaged products.

Coveris Holdings S.A. (8-12%)

We focus on customized and high-performance Bio PE pouches that meet the need to be environmentally friendly while providing a high level of safety for the product.

Berry Global Inc. (5-9%)

Berry Global also develops lightweight, compostable Bio PE packaging focusing material innovation and recyclability.

Other Key Players (30-40% Combined)

The Bio PE pouches market is diversified due to the presence of several manufacturers and packaging companies, among them:

  • Smurfit Kappa (Sustainable Bio PE flexible packaging with FSC certification)
  • Huhtamaki (Compostable and renewable raw material-based pouches)
  • Novamont S.p.A. (Biodegradable bio-polymer packaging solutions)
  • Tetra Pak (Renewable and plant-based pouch materials for liquid and dry foods)
  • Uflex Ltd. (Bio PE packaging with advanced printing and flexible barrier coatings)

Key Segments Profiled In The Global Bio PE Pouches Market

By Product Type:

  • Block Bottom
  • Side Gusset
  • Bottom Gusset
  • Spout Pouch

By Capacity:

  • Less than 50 OZ
  • 50-150 OZ
  • More than 150 OZ

By End Use:

  • Food & Beverage
  • Cosmetics & Personal Care
  • Pharmaceutical
  • Agriculture
  • Homecare
  • Other Consumer Goods

Region:

  • North America
  • Latin America
  • Western Europe
  • Eastern Europe
  • South Asia and Pacific
  • East Asia
  • Middle East and Africa (MEA)

Table of Content

  1. Executive Summary
  2. Industry Introduction, including Taxonomy and Market Definition
  3. Market Trends and Success Factors, including Macro-economic Factors, Macro-economic Factors, Recent Industry Developments
  4. Market Demand Analysis 2020 to 2024 and Forecast 2025 to 2035, including Historical Analysis, Future Projections
  5. Market Analysis 2020 to 2024 and Forecast 2025 to 2035
    • Product Type
    • Capacity
    • End Use
  6. Market Analysis 2020 to 2024 and Forecast 2025 to 2035, By Product Type
    • Block Bottom
    • Side Gusset
    • Bottom Gusset
    • Spout Pouch
    • Vacuums
  7. Market Analysis 2020 to 2024 and Forecast 2025 to 2035, By Capacity
    • Less than 50 OZ
    • 50-150 OZ
    • More than 150 OZ
  8. Market Analysis 2020 to 2024 and Forecast 2025 to 2035, By End Use
    • Food & Beverage
    • Cosmetics & Personal Care
    • Pharmaceutical
    • Agriculture
    • Homecare
    • Other Consumer Goods
  9. Market Analysis 2020 to 2024 and Forecast 2025 to 2035, By Region
    • North America
    • Latin America
    • Western Europe
    • Eastern Europe
    • East Asia
    • South Asia Pacific
    • Middle East and Africa
  10. North America Sales Analysis 2020 to 2024 and Forecast 2025 to 2035, by Key Segments and Countries
  11. Latin America Sales Analysis 2020 to 2024 and Forecast 2025 to 2035, by Key Segments and Countries
  12. Western Europe Sales Analysis 2020 to 2024 and Forecast 2025 to 2035, by Key Segments and Countries
  13. Eastern Europe Sales Analysis 2020 to 2024 and Forecast 2025 to 2035, by Key Segments and Countries
  14. East Asia Sales Analysis 2020 to 2024 and Forecast 2025 to 2035, by Key Segments and Countries
  15. South Asia Pacific Sales Analysis 2020 to 2024 and Forecast 2025 to 2035, by Key Segments and Countries
  16. Middle East and Africa Sales Analysis 2020 to 2024 and Forecast 2025 to 2035, by Key Segments and Countries
  17. Sales Forecast 2025 to 2035 by Product Type, Capacity, and End Use for 30 Countries
  18. Competition Outlook, including Market Structure Analysis, Company Share Analysis by Key Players, and Competition Dashboard
  19. Company Profile
    • AST, Inc.
    • B. Braun Melsungen
    • Nipro
    • Takeda Pharmaceuticals International AG
    • Nephron Pharmaceuticals Corporation
    • Horizon Pharmaceutical Inc.
    • Recipharm AB
    • Laboratorios SALVAT, S.A
    • The Ritedose Corporation
    • Unicep Packaging, LLC

List of Tables

  • Table 1: Global Market Value (US$ Million) Forecast by Region, 2020 to 2035
  • Table 2: Global Market Volume (Units) Forecast by Region, 2020 to 2035
  • Table 3: Global Market Value (US$ Million) Forecast by Filling Process, 2020 to 2035
  • Table 4: Global Market Volume (Units) Forecast by Filling Process, 2020 to 2035
  • Table 5: Global Market Value (US$ Million) Forecast by End-use, 2020 to 2035
  • Table 6: Global Market Volume (Units) Forecast by End-use, 2020 to 2035
  • Table 7: North America Market Value (US$ Million) Forecast by Country, 2020 to 2035
  • Table 8: North America Market Volume (Units) Forecast by Country, 2020 to 2035
  • Table 9: North America Market Value (US$ Million) Forecast by Filling Process, 2020 to 2035
  • Table 10: North America Market Volume (Units) Forecast by Filling Process, 2020 to 2035
  • Table 11: North America Market Value (US$ Million) Forecast by End-use, 2020 to 2035
  • Table 12: North America Market Volume (Units) Forecast by End-use, 2020 to 2035
  • Table 13: Latin America Market Value (US$ Million) Forecast by Country, 2020 to 2035
  • Table 14: Latin America Market Volume (Units) Forecast by Country, 2020 to 2035
  • Table 15: Latin America Market Value (US$ Million) Forecast by Filling Process, 2020 to 2035
  • Table 16: Latin America Market Volume (Units) Forecast by Filling Process, 2020 to 2035
  • Table 17: Latin America Market Value (US$ Million) Forecast by End-use, 2020 to 2035
  • Table 18: Latin America Market Volume (Units) Forecast by End-use, 2020 to 2035
  • Table 19: Western Europe Market Value (US$ Million) Forecast by Country, 2020 to 2035
  • Table 20: Western Europe Market Volume (Units) Forecast by Country, 2020 to 2035
  • Table 21: Western Europe Market Value (US$ Million) Forecast by Filling Process, 2020 to 2035
  • Table 22: Western Europe Market Volume (Units) Forecast by Filling Process, 2020 to 2035
  • Table 23: Western Europe Market Value (US$ Million) Forecast by End-use, 2020 to 2035
  • Table 24: Western Europe Market Volume (Units) Forecast by End-use, 2020 to 2035
  • Table 25: Eastern Europe Market Value (US$ Million) Forecast by Country, 2020 to 2035
  • Table 26: Eastern Europe Market Volume (Units) Forecast by Country, 2020 to 2035
  • Table 27: Eastern Europe Market Value (US$ Million) Forecast by Filling Process, 2020 to 2035
  • Table 28: Eastern Europe Market Volume (Units) Forecast by Filling Process, 2020 to 2035
  • Table 29: Eastern Europe Market Value (US$ Million) Forecast by End-use, 2020 to 2035
  • Table 30: Eastern Europe Market Volume (Units) Forecast by End-use, 2020 to 2035
  • Table 31: South Asia and Pacific Market Value (US$ Million) Forecast by Country, 2020 to 2035
  • Table 32: South Asia and Pacific Market Volume (Units) Forecast by Country, 2020 to 2035
  • Table 33: South Asia and Pacific Market Value (US$ Million) Forecast by Filling Process, 2020 to 2035
  • Table 34: South Asia and Pacific Market Volume (Units) Forecast by Filling Process, 2020 to 2035
  • Table 35: South Asia and Pacific Market Value (US$ Million) Forecast by End-use, 2020 to 2035
  • Table 36: South Asia and Pacific Market Volume (Units) Forecast by End-use, 2020 to 2035
  • Table 37: East Asia Market Value (US$ Million) Forecast by Country, 2020 to 2035
  • Table 38: East Asia Market Volume (Units) Forecast by Country, 2020 to 2035
  • Table 39: East Asia Market Value (US$ Million) Forecast by Filling Process, 2020 to 2035
  • Table 40: East Asia Market Volume (Units) Forecast by Filling Process, 2020 to 2035
  • Table 41: East Asia Market Value (US$ Million) Forecast by End-use, 2020 to 2035
  • Table 42: East Asia Market Volume (Units) Forecast by End-use, 2020 to 2035
  • Table 43: Middle East and Africa Market Value (US$ Million) Forecast by Country, 2020 to 2035
  • Table 44: Middle East and Africa Market Volume (Units) Forecast by Country, 2020 to 2035
  • Table 45: Middle East and Africa Market Value (US$ Million) Forecast by Filling Process, 2020 to 2035
  • Table 46: Middle East and Africa Market Volume (Units) Forecast by Filling Process, 2020 to 2035
  • Table 47: Middle East and Africa Market Value (US$ Million) Forecast by End-use, 2020 to 2035
  • Table 48: Middle East and Africa Market Volume (Units) Forecast by End-use, 2020 to 2035

List of Figures

  • Figure 1: Global Market Value (US$ Million) by Filling Process, 2025 to 2035
  • Figure 2: Global Market Value (US$ Million) by End-use, 2025 to 2035
  • Figure 3: Global Market Value (US$ Million) by Region, 2025 to 2035
  • Figure 4: Global Market Value (US$ Million) Analysis by Region, 2020 to 2035
  • Figure 5: Global Market Volume (Units) Analysis by Region, 2020 to 2035
  • Figure 6: Global Market Value Share (%) and BPS Analysis by Region, 2025 to 2035
  • Figure 7: Global Market Y-o-Y Growth (%) Projections by Region, 2025 to 2035
  • Figure 8: Global Market Value (US$ Million) Analysis by Filling Process, 2020 to 2035
  • Figure 9: Global Market Volume (Units) Analysis by Filling Process, 2020 to 2035
  • Figure 10: Global Market Value Share (%) and BPS Analysis by Filling Process, 2025 to 2035
  • Figure 11: Global Market Y-o-Y Growth (%) Projections by Filling Process, 2025 to 2035
  • Figure 12: Global Market Value (US$ Million) Analysis by End-use, 2020 to 2035
  • Figure 13: Global Market Volume (Units) Analysis by End-use, 2020 to 2035
  • Figure 14: Global Market Value Share (%) and BPS Analysis by End-use, 2025 to 2035
  • Figure 15: Global Market Y-o-Y Growth (%) Projections by End-use, 2025 to 2035
  • Figure 16: Global Market Attractiveness by Filling Process, 2025 to 2035
  • Figure 17: Global Market Attractiveness by End-use, 2025 to 2035
  • Figure 18: Global Market Attractiveness by Region, 2025 to 2035
  • Figure 19: North America Market Value (US$ Million) by Filling Process, 2025 to 2035
  • Figure 20: North America Market Value (US$ Million) by End-use, 2025 to 2035
  • Figure 21: North America Market Value (US$ Million) by Country, 2025 to 2035
  • Figure 22: North America Market Value (US$ Million) Analysis by Country, 2020 to 2035
  • Figure 23: North America Market Volume (Units) Analysis by Country, 2020 to 2035
  • Figure 24: North America Market Value Share (%) and BPS Analysis by Country, 2025 to 2035
  • Figure 25: North America Market Y-o-Y Growth (%) Projections by Country, 2025 to 2035
  • Figure 26: North America Market Value (US$ Million) Analysis by Filling Process, 2020 to 2035
  • Figure 27: North America Market Volume (Units) Analysis by Filling Process, 2020 to 2035
  • Figure 28: North America Market Value Share (%) and BPS Analysis by Filling Process, 2025 to 2035
  • Figure 29: North America Market Y-o-Y Growth (%) Projections by Filling Process, 2025 to 2035
  • Figure 30: North America Market Value (US$ Million) Analysis by End-use, 2020 to 2035
  • Figure 31: North America Market Volume (Units) Analysis by End-use, 2020 to 2035
  • Figure 32: North America Market Value Share (%) and BPS Analysis by End-use, 2025 to 2035
  • Figure 33: North America Market Y-o-Y Growth (%) Projections by End-use, 2025 to 2035
  • Figure 34: North America Market Attractiveness by Filling Process, 2025 to 2035
  • Figure 35: North America Market Attractiveness by End-use, 2025 to 2035
  • Figure 36: North America Market Attractiveness by Country, 2025 to 2035
  • Figure 37: Latin America Market Value (US$ Million) by Filling Process, 2025 to 2035
  • Figure 38: Latin America Market Value (US$ Million) by End-use, 2025 to 2035
  • Figure 39: Latin America Market Value (US$ Million) by Country, 2025 to 2035
  • Figure 40: Latin America Market Value (US$ Million) Analysis by Country, 2020 to 2035
  • Figure 41: Latin America Market Volume (Units) Analysis by Country, 2020 to 2035
  • Figure 42: Latin America Market Value Share (%) and BPS Analysis by Country, 2025 to 2035
  • Figure 43: Latin America Market Y-o-Y Growth (%) Projections by Country, 2025 to 2035
  • Figure 44: Latin America Market Value (US$ Million) Analysis by Filling Process, 2020 to 2035
  • Figure 45: Latin America Market Volume (Units) Analysis by Filling Process, 2020 to 2035
  • Figure 46: Latin America Market Value Share (%) and BPS Analysis by Filling Process, 2025 to 2035
  • Figure 47: Latin America Market Y-o-Y Growth (%) Projections by Filling Process, 2025 to 2035
  • Figure 48: Latin America Market Value (US$ Million) Analysis by End-use, 2020 to 2035
  • Figure 49: Latin America Market Volume (Units) Analysis by End-use, 2020 to 2035
  • Figure 50: Latin America Market Value Share (%) and BPS Analysis by End-use, 2025 to 2035
  • Figure 51: Latin America Market Y-o-Y Growth (%) Projections by End-use, 2025 to 2035
  • Figure 52: Latin America Market Attractiveness by Filling Process, 2025 to 2035
  • Figure 53: Latin America Market Attractiveness by End-use, 2025 to 2035
  • Figure 54: Latin America Market Attractiveness by Country, 2025 to 2035
  • Figure 55: Western Europe Market Value (US$ Million) by Filling Process, 2025 to 2035
  • Figure 56: Western Europe Market Value (US$ Million) by End-use, 2025 to 2035
  • Figure 57: Western Europe Market Value (US$ Million) by Country, 2025 to 2035
  • Figure 58: Western Europe Market Value (US$ Million) Analysis by Country, 2020 to 2035
  • Figure 59: Western Europe Market Volume (Units) Analysis by Country, 2020 to 2035
  • Figure 60: Western Europe Market Value Share (%) and BPS Analysis by Country, 2025 to 2035
  • Figure 61: Western Europe Market Y-o-Y Growth (%) Projections by Country, 2025 to 2035
  • Figure 62: Western Europe Market Value (US$ Million) Analysis by Filling Process, 2020 to 2035
  • Figure 63: Western Europe Market Volume (Units) Analysis by Filling Process, 2020 to 2035
  • Figure 64: Western Europe Market Value Share (%) and BPS Analysis by Filling Process, 2025 to 2035
  • Figure 65: Western Europe Market Y-o-Y Growth (%) Projections by Filling Process, 2025 to 2035
  • Figure 66: Western Europe Market Value (US$ Million) Analysis by End-use, 2020 to 2035
  • Figure 67: Western Europe Market Volume (Units) Analysis by End-use, 2020 to 2035
  • Figure 68: Western Europe Market Value Share (%) and BPS Analysis by End-use, 2025 to 2035
  • Figure 69: Western Europe Market Y-o-Y Growth (%) Projections by End-use, 2025 to 2035
  • Figure 70: Western Europe Market Attractiveness by Filling Process, 2025 to 2035
  • Figure 71: Western Europe Market Attractiveness by End-use, 2025 to 2035
  • Figure 72: Western Europe Market Attractiveness by Country, 2025 to 2035
  • Figure 73: Eastern Europe Market Value (US$ Million) by Filling Process, 2025 to 2035
  • Figure 74: Eastern Europe Market Value (US$ Million) by End-use, 2025 to 2035
  • Figure 75: Eastern Europe Market Value (US$ Million) by Country, 2025 to 2035
  • Figure 76: Eastern Europe Market Value (US$ Million) Analysis by Country, 2020 to 2035
  • Figure 77: Eastern Europe Market Volume (Units) Analysis by Country, 2020 to 2035
  • Figure 78: Eastern Europe Market Value Share (%) and BPS Analysis by Country, 2025 to 2035
  • Figure 79: Eastern Europe Market Y-o-Y Growth (%) Projections by Country, 2025 to 2035
  • Figure 80: Eastern Europe Market Value (US$ Million) Analysis by Filling Process, 2020 to 2035
  • Figure 81: Eastern Europe Market Volume (Units) Analysis by Filling Process, 2020 to 2035
  • Figure 82: Eastern Europe Market Value Share (%) and BPS Analysis by Filling Process, 2025 to 2035
  • Figure 83: Eastern Europe Market Y-o-Y Growth (%) Projections by Filling Process, 2025 to 2035
  • Figure 84: Eastern Europe Market Value (US$ Million) Analysis by End-use, 2020 to 2035
  • Figure 85: Eastern Europe Market Volume (Units) Analysis by End-use, 2020 to 2035
  • Figure 86: Eastern Europe Market Value Share (%) and BPS Analysis by End-use, 2025 to 2035
  • Figure 87: Eastern Europe Market Y-o-Y Growth (%) Projections by End-use, 2025 to 2035
  • Figure 88: Eastern Europe Market Attractiveness by Filling Process, 2025 to 2035
  • Figure 89: Eastern Europe Market Attractiveness by End-use, 2025 to 2035
  • Figure 90: Eastern Europe Market Attractiveness by Country, 2025 to 2035
  • Figure 91: South Asia and Pacific Market Value (US$ Million) by Filling Process, 2025 to 2035
  • Figure 92: South Asia and Pacific Market Value (US$ Million) by End-use, 2025 to 2035
  • Figure 93: South Asia and Pacific Market Value (US$ Million) by Country, 2025 to 2035
  • Figure 94: South Asia and Pacific Market Value (US$ Million) Analysis by Country, 2020 to 2035
  • Figure 95: South Asia and Pacific Market Volume (Units) Analysis by Country, 2020 to 2035
  • Figure 96: South Asia and Pacific Market Value Share (%) and BPS Analysis by Country, 2025 to 2035
  • Figure 97: South Asia and Pacific Market Y-o-Y Growth (%) Projections by Country, 2025 to 2035
  • Figure 98: South Asia and Pacific Market Value (US$ Million) Analysis by Filling Process, 2020 to 2035
  • Figure 99: South Asia and Pacific Market Volume (Units) Analysis by Filling Process, 2020 to 2035
  • Figure 100: South Asia and Pacific Market Value Share (%) and BPS Analysis by Filling Process, 2025 to 2035
  • Figure 101: South Asia and Pacific Market Y-o-Y Growth (%) Projections by Filling Process, 2025 to 2035
  • Figure 102: South Asia and Pacific Market Value (US$ Million) Analysis by End-use, 2020 to 2035
  • Figure 103: South Asia and Pacific Market Volume (Units) Analysis by End-use, 2020 to 2035
  • Figure 104: South Asia and Pacific Market Value Share (%) and BPS Analysis by End-use, 2025 to 2035
  • Figure 105: South Asia and Pacific Market Y-o-Y Growth (%) Projections by End-use, 2025 to 2035
  • Figure 106: South Asia and Pacific Market Attractiveness by Filling Process, 2025 to 2035
  • Figure 107: South Asia and Pacific Market Attractiveness by End-use, 2025 to 2035
  • Figure 108: South Asia and Pacific Market Attractiveness by Country, 2025 to 2035
  • Figure 109: East Asia Market Value (US$ Million) by Filling Process, 2025 to 2035
  • Figure 110: East Asia Market Value (US$ Million) by End-use, 2025 to 2035
  • Figure 111: East Asia Market Value (US$ Million) by Country, 2025 to 2035
  • Figure 112: East Asia Market Value (US$ Million) Analysis by Country, 2020 to 2035
  • Figure 113: East Asia Market Volume (Units) Analysis by Country, 2020 to 2035
  • Figure 114: East Asia Market Value Share (%) and BPS Analysis by Country, 2025 to 2035
  • Figure 115: East Asia Market Y-o-Y Growth (%) Projections by Country, 2025 to 2035
  • Figure 116: East Asia Market Value (US$ Million) Analysis by Filling Process, 2020 to 2035
  • Figure 117: East Asia Market Volume (Units) Analysis by Filling Process, 2020 to 2035
  • Figure 118: East Asia Market Value Share (%) and BPS Analysis by Filling Process, 2025 to 2035
  • Figure 119: East Asia Market Y-o-Y Growth (%) Projections by Filling Process, 2025 to 2035
  • Figure 120: East Asia Market Value (US$ Million) Analysis by End-use, 2020 to 2035
  • Figure 121: East Asia Market Volume (Units) Analysis by End-use, 2020 to 2035
  • Figure 122: East Asia Market Value Share (%) and BPS Analysis by End-use, 2025 to 2035
  • Figure 123: East Asia Market Y-o-Y Growth (%) Projections by End-use, 2025 to 2035
  • Figure 124: East Asia Market Attractiveness by Filling Process, 2025 to 2035
  • Figure 125: East Asia Market Attractiveness by End-use, 2025 to 2035
  • Figure 126: East Asia Market Attractiveness by Country, 2025 to 2035
  • Figure 127: Middle East and Africa Market Value (US$ Million) by Filling Process, 2025 to 2035
  • Figure 128: Middle East and Africa Market Value (US$ Million) by End-use, 2025 to 2035
  • Figure 129: Middle East and Africa Market Value (US$ Million) by Country, 2025 to 2035
  • Figure 130: Middle East and Africa Market Value (US$ Million) Analysis by Country, 2020 to 2035
  • Figure 131: Middle East and Africa Market Volume (Units) Analysis by Country, 2020 to 2035
  • Figure 132: Middle East and Africa Market Value Share (%) and BPS Analysis by Country, 2025 to 2035
  • Figure 133: Middle East and Africa Market Y-o-Y Growth (%) Projections by Country, 2025 to 2035
  • Figure 134: Middle East and Africa Market Value (US$ Million) Analysis by Filling Process, 2020 to 2035
  • Figure 135: Middle East and Africa Market Volume (Units) Analysis by Filling Process, 2020 to 2035
  • Figure 136: Middle East and Africa Market Value Share (%) and BPS Analysis by Filling Process, 2025 to 2035
  • Figure 137: Middle East and Africa Market Y-o-Y Growth (%) Projections by Filling Process, 2025 to 2035
  • Figure 138: Middle East and Africa Market Value (US$ Million) Analysis by End-use, 2020 to 2035
  • Figure 139: Middle East and Africa Market Volume (Units) Analysis by End-use, 2020 to 2035
  • Figure 140: Middle East and Africa Market Value Share (%) and BPS Analysis by End-use, 2025 to 2035
  • Figure 141: Middle East and Africa Market Y-o-Y Growth (%) Projections by End-use, 2025 to 2035
  • Figure 142: Middle East and Africa Market Attractiveness by Filling Process, 2025 to 2035
  • Figure 143: Middle East and Africa Market Attractiveness by End-use, 2025 to 2035
  • Figure 144: Middle East and Africa Market Attractiveness by Country, 2025 to 2035

Frequently Asked Questions

What was the overall size of the Bio PE Pouches market in 2025?

The overall market size for Bio PE Pouches market was USD 500.1 million in 2025.

How big the bio is based Bio PE Pouches market expected in 2035?

The Bio PE Pouches market is expected to reach USD 900.3 million in 2035.

What will drive the demand for Bio PE Pouches market during the forecast period?

The demand for Bio PE Pouches will grow due to rising adoption of block bottom, side gusset, bottom gusset, and spout pouches for sustainable packaging. Capacity preferences range from less than 50 OZ for convenience to over 150 OZ for bulk storage. Increased usage in food & beverage, cosmetics, pharmaceuticals, agriculture, homecare, and other consumer goods sectors will drive market.

List the top 5 countries contributing in Bio PE Pouches market?

The top 5 countries which drives the development of Bio PE Pouches market are USA, European Union, Japan, South Korea and UK.

Which segment in type is expected to lead Bio PE Pouches market?

Food & Beverage Industry demand supplier to command significant share over the assessment period.

Explore Similar Insights

Future Market Insights

Bio PE Pouches Market