Refuse Bags Market Size and Share Forecast Outlook 2025 to 2035

The Refuse Bags Market is estimated to be valued at USD 3.1 billion in 2025 and is projected to reach USD 5.8 billion by 2035, registering a compound annual growth rate (CAGR) of 6.5% over the forecast period.
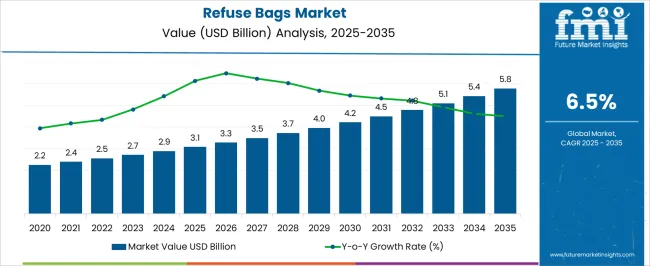
Quick Stats for Refuse Bags Market

  • Refuse Bags Market Industry Value (2025): USD 3.1 billion
  • Refuse Bags Market Forecast Value (2035): USD 5.8 billion
  • Refuse Bags Market Forecast CAGR: 6.5%
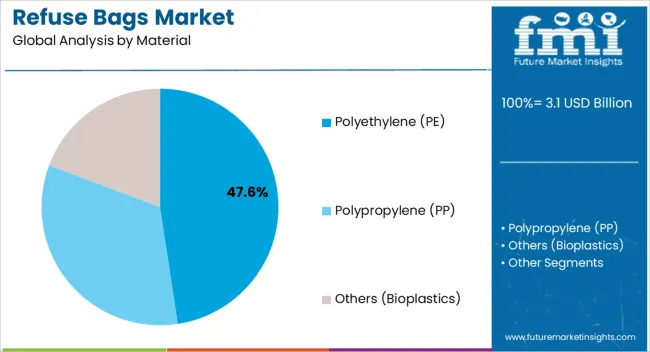
  • Leading Segment in Refuse Bags Market in 2025: Polyethylene (PE) (47.6%)
  • Key Growth Region in Refuse Bags Market: North America, Asia-Pacific, Europe
  • Top Key Players in Refuse Bags Market: Berry Global Inc., The Clorox Company, The Glad Product Company, Four Star Plastics, Mirpack TM, Primax D.O.O, International Plastics, Inc., NOVPLAST, S.R.O, DAGOPLAST AS, Terdex GmbH., Kemii Garbage Bag Co. Ltd, Novolex, International Plastics Inc., Luban Packing LLC, Cosmoplast Industrial Company LLC.

Refuse Bags Market Market Value Analysis

Metric Value
Refuse Bags Market Estimated Value in (2025 E) USD 3.1 billion
Refuse Bags Market Forecast Value in (2035 F) USD 5.8 billion
Forecast CAGR (2025 to 2035) 6.5%

Rationale for Segmental Growth in the Refuse Bags Market

The refuse bags market is experiencing steady expansion, influenced by rising waste generation across residential, commercial, and industrial sectors. Growing urban populations, coupled with stricter waste management regulations, have increased the demand for durable and reliable refuse bags. Industry announcements and sustainability-focused initiatives have highlighted a shift toward recyclable and biodegradable bag options, driven by regulatory pressures and consumer awareness of environmental issues.

At the same time, large-scale adoption in commercial spaces, healthcare, and hospitality has strengthened demand for high-capacity and puncture-resistant products. Technological improvements in polymer processing have enabled the production of stronger, lightweight bags that minimize material usage while maintaining durability.

Future growth is expected to be shaped by innovation in eco-friendly raw materials, the expansion of organized waste collection systems in developing economies, and policy-driven shifts toward responsible disposal solutions. Market leadership continues to be defined by polyethylene-based bags, mid-range capacity products, and high adoption across commercial applications.
Segmental Analysis

Insights into the Material Segment: Polyethylene (PE)

Refuse Bags Market Analysis By Material

The polyethylene (PE) segment is projected to account for 47.60% of the refuse bags market revenue in 2025, retaining its dominance due to its cost efficiency, durability, and widespread availability. PE’s mechanical strength and resistance to tearing have made it the preferred material for both household and commercial waste handling.

Industry updates have emphasized that PE bags offer versatility across multiple waste categories while remaining lightweight and affordable. Additionally, advancements in recycled and bio-based polyethylene grades have allowed manufacturers to align with sustainability goals without compromising bag performance.

Strong supply chains and established processing technologies further support this segment’s leadership. With consumer and commercial users continuing to favor dependable and low-cost solutions, the PE segment is expected to sustain its market share, even as biodegradable alternatives gain traction in select regions.
Insights into the Capacity Segment: 11 to 25 Gallons

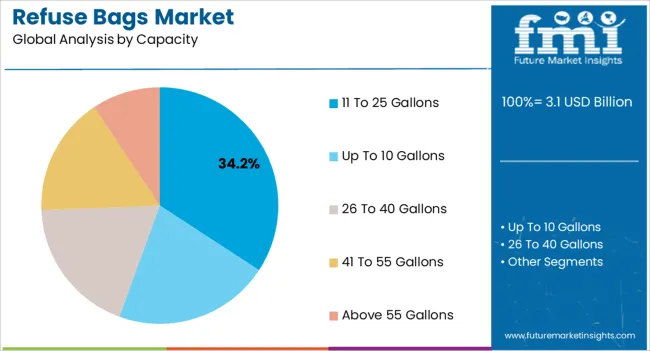
Refuse Bags Market Analysis By Capacity

The 11 to 25 gallons capacity segment is projected to contribute 34.20% of the refuse bags market revenue in 2025, leading the market due to its adaptability for both residential and commercial use. This segment has been supported by its practicality in managing medium-sized waste volumes, making it suitable for households, offices, and retail spaces.

Waste management publications have reported that this size range provides an optimal balance between ease of handling and sufficient capacity for daily waste disposal needs. Its compatibility with standard bins and receptacles has further enhanced adoption.

Moreover, commercial establishments such as restaurants and small businesses have increasingly relied on 11 to 25 gallon bags for efficient waste collection without frequent bag changes. As urbanization and waste volumes rise, demand for mid-range capacity bags is expected to remain strong, ensuring their continued market leadership.
Insights into the End Use Segment: Commercial

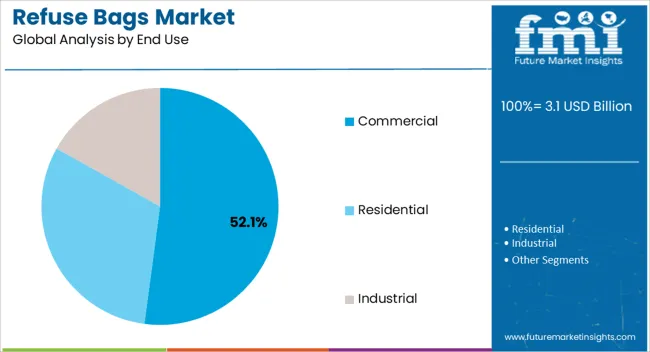
Refuse Bags Market Analysis By End Use

The commercial segment is projected to capture 52.10% of the refuse bags market revenue in 2025, maintaining its leading position as the primary end-use category. Growth in this segment has been driven by the large-scale use of refuse bags in retail, hospitality, healthcare, and office environments, where high volumes of waste are generated daily.

Regulatory requirements mandating proper waste segregation and disposal have accelerated commercial adoption. Industry updates have highlighted the increasing preference for heavy-duty, leak-resistant bags to ensure hygiene standards in these environments.

Furthermore, partnerships between waste management companies and commercial enterprises have reinforced steady procurement of refuse bags in bulk quantities. Expansion of the service industry and rising numbers of commercial establishments in urban centers have further boosted demand. With sustainability targets pushing businesses toward eco-friendly waste solutions, the commercial segment is expected to remain the cornerstone of the refuse bags market.

How Will Sales of Refuse Bags between 2020 and 2025 Outpace Demand from 2025 to 2035?

The global refuse bags market expanded at a 5.4% CAGR during the historical period between 2.2020 and 2.202.22.2. It generated a revenue of USD 3.1 billion in 2.202.22.2 from USD 2.2.0 billion in 2.2020.

Refuse bag sales are predicted to increase as a result of more intense environmental regulations on trash bag disposal. It might also benefit from rising consumer and legislative awareness about environmental issues. It is expected to help in strengthening the demand for refuse bags or eco-friendly/green plastic waste bags by 2.2035.

Growing restaurants and cafés throughout the world is predicted to drive up demand for refuse bags over the forecast period. Refuse bag sales are expected to further accelerate owing to its appeal of being stretchy and strong. These bags are capable of enabling odor control, thereby attracting more users from the retail sector.

Governments across the world have been implementing waste management policies, including measures to reduce single-use plastics. These policies might impact the types of materials used in refuse bags and encourage the use of sustainable alternatives.

The refuse bags industry was experiencing consolidation, with larger players acquiring small manufacturers to expand their product offerings and market reach. The retail sector plays a significant role in pushing the demand for refuse bags. Increasing awareness of waste management and hygiene has led to a high demand for various types of refuse bags for household use.

Manufacturers are set to introduce innovative features in refuse bags such as odor control, tie-up systems, and easy-to-carry handles. These features might help them in catering to varying preferences for user-friendly and hygienic products.

Hospitality and healthcare sectors were leading consumers of refuse bags in the historical period. This was due to their specific waste management needs. These sectors were witnessing steady growth, augmenting demand for specialized bags.

How Demand for Sustainable and Eco-friendly Products is Influencing Strategy Formulation?

  • Consumer demand and trends nowadays have a significant influence on the growth strategies implemented by manufacturers of refuse bags.
  • Sustainability imperative is a continuing trend that heavily influences consumer decision-making.
  • As per surveys conducted by the World Economic Forum, demand for sustainable products is growing across both developing and developed nations.
  • Over 65% of the respondents are preferring a sustainable option while making purchases.
  • Trend of eco-friendly products is anticipated to pave the way for success among refuse bag vendors worldwide.

Why Are Stringent Environmental Regulations Creating New Opportunities for Biodegradable Refuse Bags?

  • Increasing pollution levels due to the excess use of plastic is a pressing global concern for a healthy environment.
  • In an effort to curb plastic use, governments across the world are promoting biodegradable refuse bags and other eco-friendly alternatives.
  • Environmental requirements for eco-friendly items have influenced manufacturers to develop sustainable and environmentally friendly goods and packaging.
  • Several manufacturers are focusing on the development of eco-friendly refuse bags, which might cater to trends, as well as regulations framed for environmental issues.
  • End users are expected to move toward sustainable packaging to attract more customers.

Country-wise Insights

Country United States
Market Share (2025) 21.9%
Market Share (2035) 17.5%
BPS Analysis -440
Country China
Market Share (2025) 6.8%
Market Share (2035) 7.7%
BPS Analysis 100
Country Germany
Market Share (2025) 5.8%
Market Share (2035) 4.4%
BPS Analysis -130
Country Japan
Market Share (2025) 5.3%
Market Share (2035) 6.4%
BPS Analysis 120
Country India
Market Share (2025) 5.0%
Market Share (2035) 6.8%
BPS Analysis 180

Why is the United States Showcasing High Refuse Bag Demand?

Take Back Bags to Gain Impetus in the United States with Rising Demand for Affordable Solutions

The United States refuse bags market is estimated to surge at a CAGR of 4.2% during the forecast period. The country is likely to dominate the global market due to the high standard of living and way of life of its citizens.

The United States’ high living standards are reflected by its GDP per capita, which in 2025 stands at over 76,000, as per data from the OECD. It enjoyed a y-o-y growth of about 10%.

The United States has a robust manufacturing and retail sectors. It might lead to the generation of a considerable amount of waste. Business, institutions, and sectors require a steady supply of refuse bags for waste management, which is set to contribute to growth.

The United States has a well-developed research and development infrastructure. It is expected to lead to continuous advancement in the materials and technologies used in refuse bags.

It is likely to result in the creation of more durable, eco-friendly, and cost-effective bags. It is further anticipated to lead to high refuse bag demand in the United States.

Would Japan Create New Opportunities for Refuse Bags Manufacturers?

Low Labor Cost in Japan to Create Opportunities for Refuse Plastic Bags by 2035

Japan refuse bags market is projected to create an incremental opportunity of USD 3.1 billion from 2025 to 2035. Owing to rapid urbanization in the country, garbage bags have become not only increasingly popular but also considered to be more of an essential commodity than a luxury.

As per data from the United Nations, urbanization rate of Japan stands at over 90% as of 2025. Japan’s large-scale production facilities and cost-effective labor cost might allow for the mass production of refuse bags. Japan’s low production cost, owing to reduced labor and raw material cost compared to various other countries might also provide a competitive edge.

Category-wise Insights

Which Material is Primarily Used to Manufacture Refuse Bags Globally?

Polyethylene (PE) to be Rapidly Utilized for Making Garden Refuse Bags Worldwide

Based on material, the polyethylene (PE) segment is anticipated to hold around 79% of the global refuse bags market share by the end of 2035. Features such as high tensile strength and resistance to puncturing would make PE bags popular. These properties are likely to drive the market for PE refuse bags over the forecast period.

Polyethylene can be easily molded and extruded into various shapes and sizes. It might allow manufacturers to produce refuse bags in different thicknesses and capacities.

High versatility is set to make it suitable for a wide range of waste disposal needs. Consumers often prefer bags that can handle heavy loads and prevent spills & leaks.

Polyethylene bags are lightweight, which is advantageous for handling and transportation. They are easy to carry and dispose of when full.

Polyethylene is widely available and can be produced in large quantities. It might hence help in meeting the high demand for refuse bags worldwide.

Which Capacity of Refuse Bags is Highly Preferred across the Globe?

Small Refuse Bags with Capacity of 11 to 25 Gallons to Witness Exponential Demand

Based on capacity, the 11 to 25 gallons segment is anticipated to dominate the market. It is poised to hold around 44% of the global market share by the end of 2035.

Refuse bags with a capacity ranging between 11 to 25 gallons are highly versatile without being excessively big or small. This is the reason why it is increasingly being utilized by both households and commercial establishments alike.

Refuse bags with a capacity of 11 to 25 gallons often strike a balance between capacity and cost-effectiveness. Large bags might be too expensive for small households, while small bags might not be sufficient for large families. The 11 to 25 gallons segment is set to hence offer a cost-effective option for a broad consumer base.

Which is the Dominant End-use Segment in the Market?

Growing Hygiene-related Awareness in Commercial Sector to Augment Demand for Garbage Bags

The commercial segment is expected to boost refuse bag sales in the global market. The segment is likely to show 6.2% CAGR over the forecast period. Growing hygiene-related awareness amongst millennial consumers are expected to fuel the segment forward.

Businesses, hospitals, restaurants, and other commercial areas tend to produce a significant amount of waste daily. All of these are anticipated to necessitate the use of large quantities of refuse bags.

Commercial buyers purchase refuse bags in bulk, allowing them to benefit from economies of scale. Bulk buying might enable them to get better pricing and discounts. It is likely to make it a cost-effective process to procure large quantities for their waste management needs.
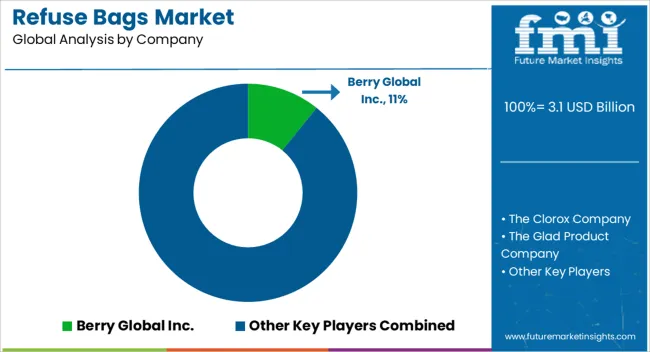
Competitive Landscape

Refuse Bags Market Analysis By Company

Refuse bag manufacturers often invest in research and development to create innovative products that cater to specific customer needs. These innovations might include features such as increased durability, biodegradability, odor control, and various sizes to accommodate different waste volumes.

Key manufacturers have embraced sustainability as a core strategy. They might focus on using recycled materials in the production of refuse bags or develop biodegradable or compostable alternatives to traditional plastic bags.

  • In May 2025, Berry Global announced the launch of ‘The Ruffies’ brand of refuse bags in the United Kingdom. These bags have been manufactured using tough agricultural plastic waste.
  • In November 2024, Cedo Ltd announced the launch of Good Karma Antibac, a 100% recycled and 100% recyclable antibacterial refuse bag.

Scope of the Report

Attribute Details
Estimated Market Size (2025) USD 3.1 billion
Projected Market Valuation (2035) USD 5.8 billion
Value-based CAGR (2025 to 2035) 6.5%
Historical Data 2020 to 2025
Forecast Period 2025 to 2035
Quantitative Units Value (USD billion)
Segments Covered Material, Capacity, End Use, Region
Key Countries Covered United States, Canada, Brazil, Mexico, Germany, Italy, France, United Kingdom, Spain, Russia, GCC Countries, China, India, Australia
Key Companies Profiled Berry Global Inc.; The Clorox Company; The Glad Product Company; Four Star Plastics; Mirpack TM; Primax d.o.o; International Plastics Inc.; NOVPLAST s.r.o; DAGOPLAST AS; Terdex GmbH.; Kemii Garbage Bag Co. Ltd; Novolex; International Plastics Inc.; Luban Packing LLC; Cosmoplast Industrial Company LLC
Report Coverage Revenue Forecast, Volume Forecast, Company Ranking, Competitive Landscape, Growth Factors, Trends, and Pricing Analysis

Refuse Bags Market Outlook by Category

By Material:

  • Polyethylene (PE)
    • Low-density Polyethylene (LDPE)
    • Linear low-density Polyethylene (LLDPE)
    • High-density Polyethylene (HDPE)
  • Polypropylene (PP)
  • Others (Bioplastics)

By Capacity:

  • Up to 10 gallons
  • 11 to 25 gallons
  • 26 to 40 gallons
  • 41 to 55 gallons
  • Above 55 gallons

By End Use:

  • Commercial
  • Residential
  • Industrial

By Region:

  • North America
  • Latin America
  • East Asia
  • South Asia & Pacific
  • Western Europe
  • Eastern Europe
  • Central Asia
  • Russia & Belarus
  • Balkan & Baltic Countries
  • Middle East & Africa

Table of Content

  1. Executive Summary
    • Global Market Outlook
    • Demand-side Trends
    • Supply-side Trends
    • Technology Roadmap Analysis
    • Analysis and Recommendations
  2. Market Overview
    • Market Coverage / Taxonomy
    • Market Definition / Scope / Limitations
  3. Market Background
    • Market Dynamics
      • Drivers
      • Restraints
      • Opportunity
      • Trends
    • Scenario Forecast
      • Demand in Optimistic Scenario
      • Demand in Likely Scenario
      • Demand in Conservative Scenario
    • Opportunity Map Analysis
    • Product Life Cycle Analysis
    • Supply Chain Analysis
    • Investment Feasibility Matrix
    • Value Chain Analysis
    • PESTLE and Porter’s Analysis
    • Regulatory Landscape
    • Regional Parent Market Outlook
    • Production and Consumption Statistics
    • Import and Export Statistics
  4. Global Market Analysis 2020 to 2024 and Forecast, 2025 to 2035
    • Historical Market Size Value (USD Million) Analysis, 2020 to 2024
    • Current and Future Market Size Value (USD Million) Projections, 2025 to 2035
      • Y-o-Y Growth Trend Analysis
      • Absolute $ Opportunity Analysis
  5. Global Market Pricing Analysis 2020 to 2024 and Forecast 2025 to 2035
  6. Global Market Analysis 2020 to 2024 and Forecast 2025 to 2035, By Material
    • Introduction / Key Findings
    • Historical Market Size Value (USD Million) Analysis By Material , 2020 to 2024
    • Current and Future Market Size Value (USD Million) Analysis and Forecast By Material , 2025 to 2035
      • Polyethylene (PE)
        • Low-Density Polyethylene (LDPE)
        • Linear Low-Density Polyethylene (LLDPE)
        • High-Density Polyethylene (HDPE)
      • Polypropylene (PP)
      • Others (Bioplastics)
    • Y-o-Y Growth Trend Analysis By Material , 2020 to 2024
    • Absolute $ Opportunity Analysis By Material , 2025 to 2035
  7. Global Market Analysis 2020 to 2024 and Forecast 2025 to 2035, By Capacity
    • Introduction / Key Findings
    • Historical Market Size Value (USD Million) Analysis By Capacity, 2020 to 2024
    • Current and Future Market Size Value (USD Million) Analysis and Forecast By Capacity, 2025 to 2035
      • 11 To 25 Gallons
      • Up To 10 Gallons
      • 26 To 40 Gallons
      • 41 To 55 Gallons
      • Above 55 Gallons
    • Y-o-Y Growth Trend Analysis By Capacity, 2020 to 2024
    • Absolute $ Opportunity Analysis By Capacity, 2025 to 2035
  8. Global Market Analysis 2020 to 2024 and Forecast 2025 to 2035, By End Use
    • Introduction / Key Findings
    • Historical Market Size Value (USD Million) Analysis By End Use, 2020 to 2024
    • Current and Future Market Size Value (USD Million) Analysis and Forecast By End Use, 2025 to 2035
      • Commercial
      • Residential
      • Industrial
    • Y-o-Y Growth Trend Analysis By End Use, 2020 to 2024
    • Absolute $ Opportunity Analysis By End Use, 2025 to 2035
  9. Global Market Analysis 2020 to 2024 and Forecast 2025 to 2035, By Region
    • Introduction
    • Historical Market Size Value (USD Million) Analysis By Region, 2020 to 2024
    • Current Market Size Value (USD Million) Analysis and Forecast By Region, 2025 to 2035
      • North America
      • Latin America
      • Western Europe
      • Eastern Europe
      • East Asia
      • South Asia and Pacific
      • Middle East & Africa
    • Market Attractiveness Analysis By Region
  10. North America Market Analysis 2020 to 2024 and Forecast 2025 to 2035, By Country
    • Historical Market Size Value (USD Million) Trend Analysis By Market Taxonomy, 2020 to 2024
    • Market Size Value (USD Million) Forecast By Market Taxonomy, 2025 to 2035
      • By Country
        • USA
        • Canada
        • Mexico
      • By Material
      • By Capacity
      • By End Use
    • Market Attractiveness Analysis
      • By Country
      • By Material
      • By Capacity
      • By End Use
    • Key Takeaways
  11. Latin America Market Analysis 2020 to 2024 and Forecast 2025 to 2035, By Country
    • Historical Market Size Value (USD Million) Trend Analysis By Market Taxonomy, 2020 to 2024
    • Market Size Value (USD Million) Forecast By Market Taxonomy, 2025 to 2035
      • By Country
        • Brazil
        • Chile
        • Rest of Latin America
      • By Material
      • By Capacity
      • By End Use
    • Market Attractiveness Analysis
      • By Country
      • By Material
      • By Capacity
      • By End Use
    • Key Takeaways
  12. Western Europe Market Analysis 2020 to 2024 and Forecast 2025 to 2035, By Country
    • Historical Market Size Value (USD Million) Trend Analysis By Market Taxonomy, 2020 to 2024
    • Market Size Value (USD Million) Forecast By Market Taxonomy, 2025 to 2035
      • By Country
        • Germany
        • UK
        • Italy
        • Spain
        • France
        • Nordic
        • BENELUX
        • Rest of Western Europe
      • By Material
      • By Capacity
      • By End Use
    • Market Attractiveness Analysis
      • By Country
      • By Material
      • By Capacity
      • By End Use
    • Key Takeaways
  13. Eastern Europe Market Analysis 2020 to 2024 and Forecast 2025 to 2035, By Country
    • Historical Market Size Value (USD Million) Trend Analysis By Market Taxonomy, 2020 to 2024
    • Market Size Value (USD Million) Forecast By Market Taxonomy, 2025 to 2035
      • By Country
        • Russia
        • Poland
        • Hungary
        • Balkan & Baltic
        • Rest of Eastern Europe
      • By Material
      • By Capacity
      • By End Use
    • Market Attractiveness Analysis
      • By Country
      • By Material
      • By Capacity
      • By End Use
    • Key Takeaways
  14. East Asia Market Analysis 2020 to 2024 and Forecast 2025 to 2035, By Country
    • Historical Market Size Value (USD Million) Trend Analysis By Market Taxonomy, 2020 to 2024
    • Market Size Value (USD Million) Forecast By Market Taxonomy, 2025 to 2035
      • By Country
        • China
        • Japan
        • South Korea
      • By Material
      • By Capacity
      • By End Use
    • Market Attractiveness Analysis
      • By Country
      • By Material
      • By Capacity
      • By End Use
    • Key Takeaways
  15. South Asia and Pacific Market Analysis 2020 to 2024 and Forecast 2025 to 2035, By Country
    • Historical Market Size Value (USD Million) Trend Analysis By Market Taxonomy, 2020 to 2024
    • Market Size Value (USD Million) Forecast By Market Taxonomy, 2025 to 2035
      • By Country
        • India
        • ASEAN
        • Australia & New Zealand
        • Rest of South Asia and Pacific
      • By Material
      • By Capacity
      • By End Use
    • Market Attractiveness Analysis
      • By Country
      • By Material
      • By Capacity
      • By End Use
    • Key Takeaways
  16. Middle East & Africa Market Analysis 2020 to 2024 and Forecast 2025 to 2035, By Country
    • Historical Market Size Value (USD Million) Trend Analysis By Market Taxonomy, 2020 to 2024
    • Market Size Value (USD Million) Forecast By Market Taxonomy, 2025 to 2035
      • By Country
        • Kingdom of Saudi Arabia
        • Other GCC Countries
        • Turkiye
        • South Africa
        • Other African Union
        • Rest of Middle East & Africa
      • By Material
      • By Capacity
      • By End Use
    • Market Attractiveness Analysis
      • By Country
      • By Material
      • By Capacity
      • By End Use
    • Key Takeaways
  17. Key Countries Market Analysis
    • USA
      • Pricing Analysis
      • Market Share Analysis, 2024
        • By Material
        • By Capacity
        • By End Use
    • Canada
      • Pricing Analysis
      • Market Share Analysis, 2024
        • By Material
        • By Capacity
        • By End Use
    • Mexico
      • Pricing Analysis
      • Market Share Analysis, 2024
        • By Material
        • By Capacity
        • By End Use
    • Brazil
      • Pricing Analysis
      • Market Share Analysis, 2024
        • By Material
        • By Capacity
        • By End Use
    • Chile
      • Pricing Analysis
      • Market Share Analysis, 2024
        • By Material
        • By Capacity
        • By End Use
    • Germany
      • Pricing Analysis
      • Market Share Analysis, 2024
        • By Material
        • By Capacity
        • By End Use
    • UK
      • Pricing Analysis
      • Market Share Analysis, 2024
        • By Material
        • By Capacity
        • By End Use
    • Italy
      • Pricing Analysis
      • Market Share Analysis, 2024
        • By Material
        • By Capacity
        • By End Use
    • Spain
      • Pricing Analysis
      • Market Share Analysis, 2024
        • By Material
        • By Capacity
        • By End Use
    • France
      • Pricing Analysis
      • Market Share Analysis, 2024
        • By Material
        • By Capacity
        • By End Use
    • India
      • Pricing Analysis
      • Market Share Analysis, 2024
        • By Material
        • By Capacity
        • By End Use
    • ASEAN
      • Pricing Analysis
      • Market Share Analysis, 2024
        • By Material
        • By Capacity
        • By End Use
    • Australia & New Zealand
      • Pricing Analysis
      • Market Share Analysis, 2024
        • By Material
        • By Capacity
        • By End Use
    • China
      • Pricing Analysis
      • Market Share Analysis, 2024
        • By Material
        • By Capacity
        • By End Use
    • Japan
      • Pricing Analysis
      • Market Share Analysis, 2024
        • By Material
        • By Capacity
        • By End Use
    • South Korea
      • Pricing Analysis
      • Market Share Analysis, 2024
        • By Material
        • By Capacity
        • By End Use
    • Russia
      • Pricing Analysis
      • Market Share Analysis, 2024
        • By Material
        • By Capacity
        • By End Use
    • Poland
      • Pricing Analysis
      • Market Share Analysis, 2024
        • By Material
        • By Capacity
        • By End Use
    • Hungary
      • Pricing Analysis
      • Market Share Analysis, 2024
        • By Material
        • By Capacity
        • By End Use
    • Kingdom of Saudi Arabia
      • Pricing Analysis
      • Market Share Analysis, 2024
        • By Material
        • By Capacity
        • By End Use
    • Turkiye
      • Pricing Analysis
      • Market Share Analysis, 2024
        • By Material
        • By Capacity
        • By End Use
    • South Africa
      • Pricing Analysis
      • Market Share Analysis, 2024
        • By Material
        • By Capacity
        • By End Use
  18. Market Structure Analysis
    • Competition Dashboard
    • Competition Benchmarking
    • Market Share Analysis of Top Players
      • By Regional
      • By Material
      • By Capacity
      • By End Use
  19. Competition Analysis
    • Competition Deep Dive
      • Berry Global Inc.
        • Overview
        • Product Portfolio
        • Profitability by Market Segments (Product/Age /Sales Channel/Region)
        • Sales Footprint
        • Strategy Overview
          • Marketing Strategy
          • Product Strategy
          • Channel Strategy
      • The Clorox Company
      • The Glad Product Company
      • Four Star Plastics
      • Mirpack TM
      • Primax D.O.O
      • International Plastics, Inc.
      • NOVPLAST, S.R.O
      • DAGOPLAST AS
      • Terdex GmbH.
      • Kemii Garbage Bag Co. Ltd
      • Novolex
      • International Plastics Inc.
      • Luban Packing LLC
      • Cosmoplast Industrial Company LLC.
  20. Assumptions & Acronyms Used
  21. Research Methodology

List of Tables

  • Table 1: Global Market Value (USD Million) Forecast by Region, 2020-2035
  • Table 2: Global Market Value (USD Million) Forecast by Material , 2020-2035
  • Table 3: Global Market Value (USD Million) Forecast by Capacity, 2020-2035
  • Table 4: Global Market Value (USD Million) Forecast by End Use, 2020-2035
  • Table 5: North America Market Value (USD Million) Forecast by Country, 2020-2035
  • Table 6: North America Market Value (USD Million) Forecast by Material , 2020-2035
  • Table 7: North America Market Value (USD Million) Forecast by Capacity, 2020-2035
  • Table 8: North America Market Value (USD Million) Forecast by End Use, 2020-2035
  • Table 9: Latin America Market Value (USD Million) Forecast by Country, 2020-2035
  • Table 10: Latin America Market Value (USD Million) Forecast by Material , 2020-2035
  • Table 11: Latin America Market Value (USD Million) Forecast by Capacity, 2020-2035
  • Table 12: Latin America Market Value (USD Million) Forecast by End Use, 2020-2035
  • Table 13: Western Europe Market Value (USD Million) Forecast by Country, 2020-2035
  • Table 14: Western Europe Market Value (USD Million) Forecast by Material , 2020-2035
  • Table 15: Western Europe Market Value (USD Million) Forecast by Capacity, 2020-2035
  • Table 16: Western Europe Market Value (USD Million) Forecast by End Use, 2020-2035
  • Table 17: Eastern Europe Market Value (USD Million) Forecast by Country, 2020-2035
  • Table 18: Eastern Europe Market Value (USD Million) Forecast by Material , 2020-2035
  • Table 19: Eastern Europe Market Value (USD Million) Forecast by Capacity, 2020-2035
  • Table 20: Eastern Europe Market Value (USD Million) Forecast by End Use, 2020-2035
  • Table 21: East Asia Market Value (USD Million) Forecast by Country, 2020-2035
  • Table 22: East Asia Market Value (USD Million) Forecast by Material , 2020-2035
  • Table 23: East Asia Market Value (USD Million) Forecast by Capacity, 2020-2035
  • Table 24: East Asia Market Value (USD Million) Forecast by End Use, 2020-2035
  • Table 25: South Asia and Pacific Market Value (USD Million) Forecast by Country, 2020-2035
  • Table 26: South Asia and Pacific Market Value (USD Million) Forecast by Material , 2020-2035
  • Table 27: South Asia and Pacific Market Value (USD Million) Forecast by Capacity, 2020-2035
  • Table 28: South Asia and Pacific Market Value (USD Million) Forecast by End Use, 2020-2035
  • Table 29: Middle East & Africa Market Value (USD Million) Forecast by Country, 2020-2035
  • Table 30: Middle East & Africa Market Value (USD Million) Forecast by Material , 2020-2035
  • Table 31: Middle East & Africa Market Value (USD Million) Forecast by Capacity, 2020-2035
  • Table 32: Middle East & Africa Market Value (USD Million) Forecast by End Use, 2020-2035

List of Figures

  • Figure 1: Global Market Pricing Analysis
  • Figure 2: Global Market Value (USD Million) Forecast 2020-2035
  • Figure 3: Global Market Value Share and BPS Analysis by Material , 2025 and 2035
  • Figure 4: Global Market Y-o-Y Growth Comparison by Material , 2025-2035
  • Figure 5: Global Market Attractiveness Analysis by Material
  • Figure 6: Global Market Value Share and BPS Analysis by Capacity, 2025 and 2035
  • Figure 7: Global Market Y-o-Y Growth Comparison by Capacity, 2025-2035
  • Figure 8: Global Market Attractiveness Analysis by Capacity
  • Figure 9: Global Market Value Share and BPS Analysis by End Use, 2025 and 2035
  • Figure 10: Global Market Y-o-Y Growth Comparison by End Use, 2025-2035
  • Figure 11: Global Market Attractiveness Analysis by End Use
  • Figure 12: Global Market Value (USD Million) Share and BPS Analysis by Region, 2025 and 2035
  • Figure 13: Global Market Y-o-Y Growth Comparison by Region, 2025-2035
  • Figure 14: Global Market Attractiveness Analysis by Region
  • Figure 15: North America Market Incremental Dollar Opportunity, 2025-2035
  • Figure 16: Latin America Market Incremental Dollar Opportunity, 2025-2035
  • Figure 17: Western Europe Market Incremental Dollar Opportunity, 2025-2035
  • Figure 18: Eastern Europe Market Incremental Dollar Opportunity, 2025-2035
  • Figure 19: East Asia Market Incremental Dollar Opportunity, 2025-2035
  • Figure 20: South Asia and Pacific Market Incremental Dollar Opportunity, 2025-2035
  • Figure 21: Middle East & Africa Market Incremental Dollar Opportunity, 2025-2035
  • Figure 22: North America Market Value Share and BPS Analysis by Country, 2025 and 2035
  • Figure 23: North America Market Value Share and BPS Analysis by Material , 2025 and 2035
  • Figure 24: North America Market Y-o-Y Growth Comparison by Material , 2025-2035
  • Figure 25: North America Market Attractiveness Analysis by Material
  • Figure 26: North America Market Value Share and BPS Analysis by Capacity, 2025 and 2035
  • Figure 27: North America Market Y-o-Y Growth Comparison by Capacity, 2025-2035
  • Figure 28: North America Market Attractiveness Analysis by Capacity
  • Figure 29: North America Market Value Share and BPS Analysis by End Use, 2025 and 2035
  • Figure 30: North America Market Y-o-Y Growth Comparison by End Use, 2025-2035
  • Figure 31: North America Market Attractiveness Analysis by End Use
  • Figure 32: Latin America Market Value Share and BPS Analysis by Country, 2025 and 2035
  • Figure 33: Latin America Market Value Share and BPS Analysis by Material , 2025 and 2035
  • Figure 34: Latin America Market Y-o-Y Growth Comparison by Material , 2025-2035
  • Figure 35: Latin America Market Attractiveness Analysis by Material
  • Figure 36: Latin America Market Value Share and BPS Analysis by Capacity, 2025 and 2035
  • Figure 37: Latin America Market Y-o-Y Growth Comparison by Capacity, 2025-2035
  • Figure 38: Latin America Market Attractiveness Analysis by Capacity
  • Figure 39: Latin America Market Value Share and BPS Analysis by End Use, 2025 and 2035
  • Figure 40: Latin America Market Y-o-Y Growth Comparison by End Use, 2025-2035
  • Figure 41: Latin America Market Attractiveness Analysis by End Use
  • Figure 42: Western Europe Market Value Share and BPS Analysis by Country, 2025 and 2035
  • Figure 43: Western Europe Market Value Share and BPS Analysis by Material , 2025 and 2035
  • Figure 44: Western Europe Market Y-o-Y Growth Comparison by Material , 2025-2035
  • Figure 45: Western Europe Market Attractiveness Analysis by Material
  • Figure 46: Western Europe Market Value Share and BPS Analysis by Capacity, 2025 and 2035
  • Figure 47: Western Europe Market Y-o-Y Growth Comparison by Capacity, 2025-2035
  • Figure 48: Western Europe Market Attractiveness Analysis by Capacity
  • Figure 49: Western Europe Market Value Share and BPS Analysis by End Use, 2025 and 2035
  • Figure 50: Western Europe Market Y-o-Y Growth Comparison by End Use, 2025-2035
  • Figure 51: Western Europe Market Attractiveness Analysis by End Use
  • Figure 52: Eastern Europe Market Value Share and BPS Analysis by Country, 2025 and 2035
  • Figure 53: Eastern Europe Market Value Share and BPS Analysis by Material , 2025 and 2035
  • Figure 54: Eastern Europe Market Y-o-Y Growth Comparison by Material , 2025-2035
  • Figure 55: Eastern Europe Market Attractiveness Analysis by Material
  • Figure 56: Eastern Europe Market Value Share and BPS Analysis by Capacity, 2025 and 2035
  • Figure 57: Eastern Europe Market Y-o-Y Growth Comparison by Capacity, 2025-2035
  • Figure 58: Eastern Europe Market Attractiveness Analysis by Capacity
  • Figure 59: Eastern Europe Market Value Share and BPS Analysis by End Use, 2025 and 2035
  • Figure 60: Eastern Europe Market Y-o-Y Growth Comparison by End Use, 2025-2035
  • Figure 61: Eastern Europe Market Attractiveness Analysis by End Use
  • Figure 62: East Asia Market Value Share and BPS Analysis by Country, 2025 and 2035
  • Figure 63: East Asia Market Value Share and BPS Analysis by Material , 2025 and 2035
  • Figure 64: East Asia Market Y-o-Y Growth Comparison by Material , 2025-2035
  • Figure 65: East Asia Market Attractiveness Analysis by Material
  • Figure 66: East Asia Market Value Share and BPS Analysis by Capacity, 2025 and 2035
  • Figure 67: East Asia Market Y-o-Y Growth Comparison by Capacity, 2025-2035
  • Figure 68: East Asia Market Attractiveness Analysis by Capacity
  • Figure 69: East Asia Market Value Share and BPS Analysis by End Use, 2025 and 2035
  • Figure 70: East Asia Market Y-o-Y Growth Comparison by End Use, 2025-2035
  • Figure 71: East Asia Market Attractiveness Analysis by End Use
  • Figure 72: South Asia and Pacific Market Value Share and BPS Analysis by Country, 2025 and 2035
  • Figure 73: South Asia and Pacific Market Value Share and BPS Analysis by Material , 2025 and 2035
  • Figure 74: South Asia and Pacific Market Y-o-Y Growth Comparison by Material , 2025-2035
  • Figure 75: South Asia and Pacific Market Attractiveness Analysis by Material
  • Figure 76: South Asia and Pacific Market Value Share and BPS Analysis by Capacity, 2025 and 2035
  • Figure 77: South Asia and Pacific Market Y-o-Y Growth Comparison by Capacity, 2025-2035
  • Figure 78: South Asia and Pacific Market Attractiveness Analysis by Capacity
  • Figure 79: South Asia and Pacific Market Value Share and BPS Analysis by End Use, 2025 and 2035
  • Figure 80: South Asia and Pacific Market Y-o-Y Growth Comparison by End Use, 2025-2035
  • Figure 81: South Asia and Pacific Market Attractiveness Analysis by End Use
  • Figure 82: Middle East & Africa Market Value Share and BPS Analysis by Country, 2025 and 2035
  • Figure 83: Middle East & Africa Market Value Share and BPS Analysis by Material , 2025 and 2035
  • Figure 84: Middle East & Africa Market Y-o-Y Growth Comparison by Material , 2025-2035
  • Figure 85: Middle East & Africa Market Attractiveness Analysis by Material
  • Figure 86: Middle East & Africa Market Value Share and BPS Analysis by Capacity, 2025 and 2035
  • Figure 87: Middle East & Africa Market Y-o-Y Growth Comparison by Capacity, 2025-2035
  • Figure 88: Middle East & Africa Market Attractiveness Analysis by Capacity
  • Figure 89: Middle East & Africa Market Value Share and BPS Analysis by End Use, 2025 and 2035
  • Figure 90: Middle East & Africa Market Y-o-Y Growth Comparison by End Use, 2025-2035
  • Figure 91: Middle East & Africa Market Attractiveness Analysis by End Use
  • Figure 92: Global Market - Tier Structure Analysis
  • Figure 93: Global Market - Company Share Analysis

Frequently Asked Questions

How big is the refuse bags market in 2025?

The global refuse bags market is estimated to be valued at USD 3.1 billion in 2025.

What will be the size of refuse bags market in 2035?

The market size for the refuse bags market is projected to reach USD 5.8 billion by 2035.

How much will be the refuse bags market growth between 2025 and 2035?

The refuse bags market is expected to grow at a 6.5% CAGR between 2025 and 2035.

What are the key product types in the refuse bags market?

The key product types in refuse bags market are polyethylene (pe), _low-density polyethylene (ldpe), _linear low-density polyethylene (lldpe), _high-density polyethylene (hdpe), polypropylene (PP) and others (bioplastics).

Which capacity segment to contribute significant share in the refuse bags market in 2025?

In terms of capacity, 11 to 25 gallons segment to command 34.2% share in the refuse bags market in 2025.

Explore Similar Insights

Future Market Insights

Refuse Bags Market

Chat With MaRIA

Chat With

MaRIA

Hi There, I am MaRIA, Your Market Research Intelligence Assistant. How may I help you?