RF Power Amplifier Market Outlook (2022 to 2032)

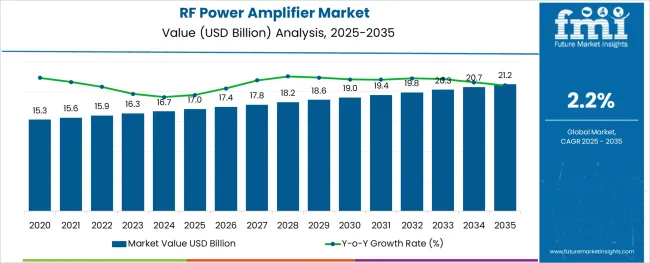
The global RF power amplifier market is poised to register a 14.2% CAGR, capturing a revenue share of USD 5,230 Million in 2022, to reach USD 19,670 Million by 2032.

The high demand for an amplified low-power radio-frequency signal (into a high-power signal) led to the introduction of RF power amplifiers.

Furthermore, increasing demand for RF power amplifiers, owning to various applications of radio frequencies, is being witnessed across various industry verticals. So, companies have started implementing and investing more in RF power amplifiers.

Report Attribute Details
Growth Rate 2.2% CAGR
Market value in 2022 USD 15,941.3 Million
Market value in 2032 USD 19,821.4 Million
Base Year for Estimation 2021
Historical Data 2016 to 2021
Forecast Period 2022 to 2032
Quantitative Units USD Million for Value
Report Coverage Revenue Forecast, Company Ranking, Competitive Landscape, Growth Factors, Trends, and Pricing Analysis
Segments Covered

Product, Application, End-use, Region

Regions Covered

North America; Latin America; Europe; Asia Pacific; Middle East & Africa

Key Countries Profiled United States of America, Canada, Mexico, Brazil, Germany, Italy, France, United Kingdom, China, Japan, South Korea, Malaysia, Singapore, Australia, New Zealand, GCC Countries, South Africa, Israel
Key Companies Profiled

WestRock Company; Mondi Group Plc.; Canfor Corporation; Natron-Hayat d.o.o.; International Paper Company; DS Smith Plc.

Customization Scope Available on Request

RF power amplifiers effectively convert low-power RF signals into high-power RF signals by driving the antenna of a transmitter. Considerably high adoption of RF power amplifiers is observed in consumer electronics as the devices demand an amplified radio frequency signal, for efficient functioning.

Additionally, RF Power Amplifiers are one of the most expensive and integral components of all base stations for wireless cellular and mobile infrastructures, and with drastic developments in telecom infrastructure, the need for RF Power Amplifiers is increasing.

Increasing adoption of consumer electronics is witnessed globally, especially in smartphones and tablets. The market for consumer electronics, especially smartphones and tablets, is furthermore, expected to witness high growth during the forecast period.

What are the Key RF Power Amplifier Market Dynamics?

Globally, cellular network expansion has increased the demand for RF power amplifiers. Consumer electronics, tablets, smartphones, laptops, and other personal electronic devices are the primary market drivers of the RF power amplifier market.

Technological advancements and increasing investment by private companies in product development contribute to the growth of the market.

As the RF power amplifier market grows, it is driven by the intensive use of RF power amplifiers in crucial industries such as aerospace, manufacturing, and consumer electronics. Another driver of the RF power amplifier market growth is the introduction of patent methods that eliminate waste heat. These methods eliminate the need for bulky heat sinks, fans, or cooling liquids.

Several factors, such as the miniaturization of RF power amplifiers for wireless technology, increased energy efficiency, and the introduction of 5G technology drive the RF power amplifiers market growth.

Additionally, proliferating penetration of 4G technology and the emergence of next-generation wireless networks, such as 5G, would also drive the demand and growth of the RF power amplifier market.

Wireless sensors with tiny battery-operated transceivers will be deployed in these cells with the Internet of Things (IoT). RF power amplifiers provide a high-quality transmission that allows this efficiency to be achieved. Miniaturization of RF power amplifiers will be a major factor in integrating them into mobile transceivers.

Thus, requires multiple RF power amplifiers in the wireless sensors of each cell. RF power amplifiers are driving market growth because of their increased power efficiency.

What are the Restraints and Challenges for RF Power Amplifier Market?

High costs associated with RF power amplifiers act as a primary restraint for the global RF power amplifier market, limiting its adoption. In addition to this, large size, high-power consumption, lower profit margins, complex designs, and engineering to attain better efficiency are also a challenge, hampering the growth of RF power amplifiers.

Manufacturers of RF power amplifiers are challenged by the functional properties of the components, such as overall RF design, gain values, noise factors, crosstalk attenuation, and the non-functional properties, such as long-term reliability of the chip, package, and board due to thermal constraints.

These factors are complicating the overall manufacturing process, which is also considered a major market restraint for RF power amplifiers.

Power amplifiers are heavily influenced by established market players; however, the need for higher initial investments during a declining economy poses a challenge for emerging market players. On the other hand, the need for innovation and technology for the further growth of RF power amplifiers is also affecting the overall growth of the RF power amplifier market.

As a result of the linearity issue, RF power amplifiers tend to back off the RF output power, which increases power consumption and reduces battery life.
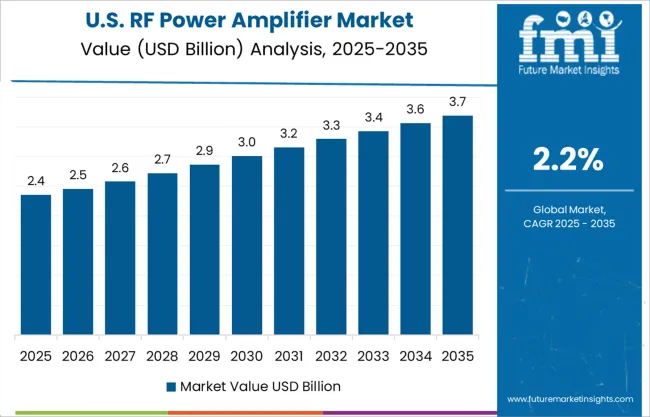
Regional Analysis

How is the North American RF Power Amplifier Market Evolving?

North America is expected to hold the largest share of the RF Power Amplifier market and will continue to flourish in its trend owing to the increasing demand for smartphones and smart devices. RF power amplifiers are enhancing the overall functional properties of smartphones.

North America is anticipated to control an RF power amplifier market share of 28.4% in 2022. Among the total market share of the global RF power amplifier market, it is also predicted to maintain steady growth throughout the forecasted period.

The increasing adoption of new technologies in the healthcare and pharmaceutical industries has increased the RF power amplifier market share.
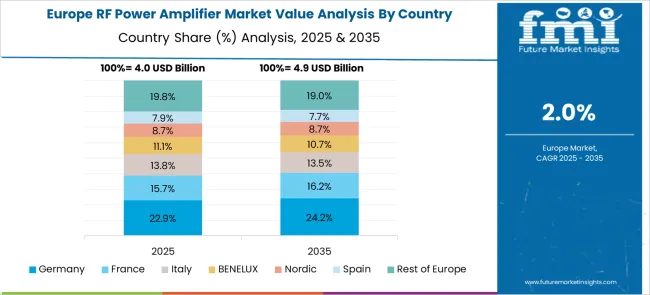
What is the Growth Outlook for the Europe RF Power Amplifier Market and Asia Pacific RF Power Amplifier Market?

The European countries including the UK, Italy, and Germany have combined to attain a global RF power amplifier market share of 18.3% in the forecast period. The growing demand for energy-efficient devices and the presence of major key players in the Europe region are providing significant opportunities for the RF power amplifier market.

Asia Pacific is the largest revenue-generating region for the RF power amplifier market globally. The Asia Pacific region is an important market for consumer electronics, automobiles, and industrial products.

Asia Pacific is the fastest-growing region due to technological advancement in the wireless industry that creates huge opportunities in the cellular segment which is expected to contribute to major growth in the RF power amplifier market.

Huge investments and business development opportunities have been attracted to this region. With high-quality infrastructure and low labor costs, Taiwan, China, India, and Korea are becoming global hubs for large investments and business expansion.

Start-up Ecosystem

How is the Start-up Ecosystem in the RF Power Amplifier Market?

The start-up ecosystem in the RF Power Amplifier market is clouded with multiple players trying to make a breakthrough as LTE networks are deployed more widely, the market for RF power amplifiers is expected to grow.

RF Power Amplifiers are predicted to gain popularity in the coming years as wireless communication devices like tablets and cell phones become more prevalent. However, the complexity of RF devices is expected to harm the RF power amplifier market. Even so, the emerging automation trend is likely to open new doors for the RF power amplifier market.
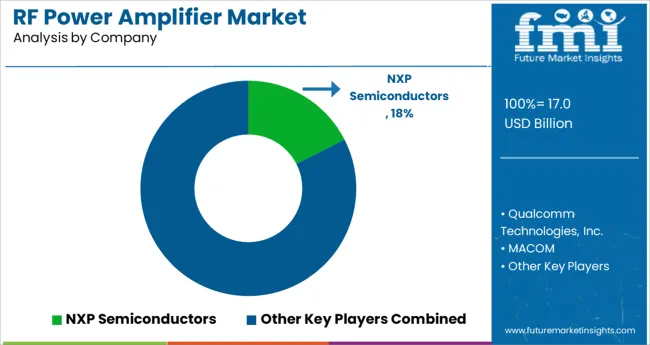
How is the Competition Landscape in the RF Power Amplifier Market?

Some of the key players in the RF Power Amplifier market are NXP Semiconductors, Qualcomm Technologies, Inc., MACOM, BONN Elektronik GmbH, OPHIR RF, Infineon Technologies AG, CML Microsystems Plc, Broadcom, Analog Devices, Inc., ETL Systems Ltd, Analogic Corporation, ETS-Lindgren and Murata Manufacturing Co., Ltd.

Emerging Trends in the RF Power Amplifier market are brought about as a result of the major players' adoption of several growth strategies, including product launches, acquisitions, and collaborations.

  • In 2021, MACOM worked together with another market leader Max-Linear Inc. to guarantee interoperability of MACOM's 100G/path and Max-Linear's PAM4 DSPs. A market characterization capability test of Telcordia GR-468 allowed MACOM to announce its expanded fast laser portfolio.
  • In June 2018, Texas Instruments presented 3 newly developed computerized input Class-D sound enhancers that empower architects to deliver high-goal sound for brilliant home and voice-empowered applications. It includes brilliant speakers, soundbars, TVs, journals, projectors, and Internet-of-Things (IoT) applications at any power level.

Report Scope

Report Attribute Details
Growth Rate CAGR of 14.2% from 2022 to 2032
Base Year for Estimation 2022
Historical Data 2016 to 2021
Forecast Period 2022 to 2032
Quantitative Units Revenue in USD Million and CAGR from 2022 to 2032
Report Coverage Revenue Forecast, Volume Forecast, Company Ranking, Competitive Landscape, Growth Factors, Trends, and Pricing Analysis
Segments Covered

Frequency, Raw Material, Operation Mode, Packaging Type, Industry, Application, Region

Regions Covered

North America; Latin America; Western Europe; Eastern Europe; The Asia Pacific excluding Japan; Japan; The Middle East and Africa

Key Countries Profiled

United States of America, Canada, Brazil, Argentina, Germany, United Kingdom, France, Spain, Italy, Nordics, BENELUX, Australia & New Zealand, China, India, GCC Countries, South Africa

Key Companies Profiled

NXP Semiconductors; Qualcomm Technologies, Inc.; MACOM; BONN Elektronik GmbH; OPHIR RF; Infineon Technologies AG; CML Microsystems PLC; Broadcom; Analog Devises Inc.; ETL Systems Ltd; Analogic Corporation; ETS-Lindgren; Murata Manufacturing Co., Ltd.

Customization Available Upon Request

Key Segments

By Frequency:

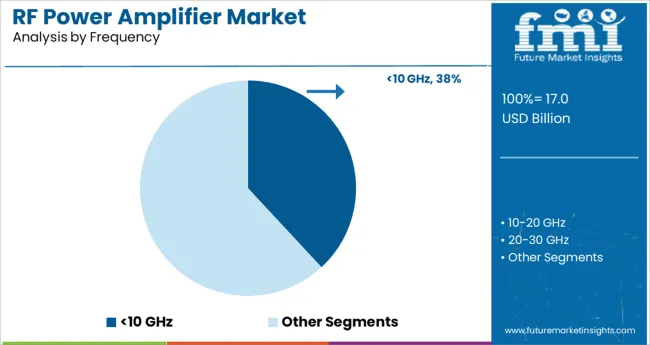
  • <10 GHz
  • 10-20 GHz
  • 20-30 GHz
  • 30+ GHz

By Raw Material:

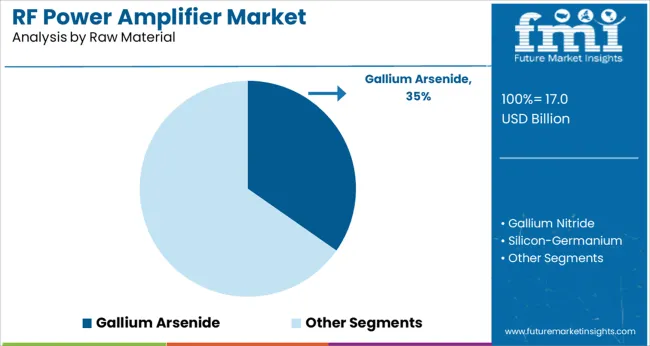
  • Gallium Arsenide
  • Gallium Nitride
  • Silicon-Germanium
  • Others

By Operation Mode:

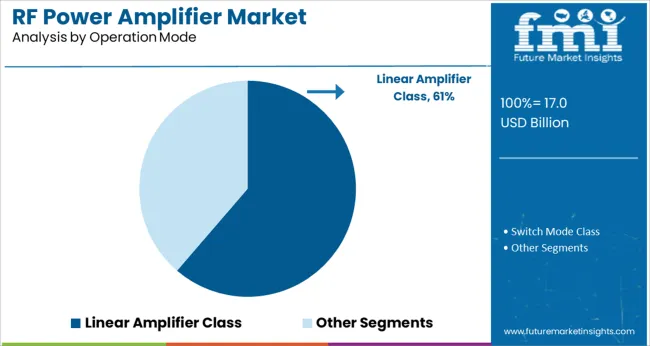
  • Linear Amplifier Class
  • Switch Mode Class

By Packaging Type:

  • Die
  • Surface Mount
  • Stand Alone/Rack Mount
  • Others

By Industry Verticals:

  • Aerospace & Defence
  • Consumer Electronics
  • Automotive Medical
  • Others

By Application:

  • Wireless Receivers
  • Audio Tape Players
  • Broadcast Transmitters
  • CD Players
  • Wireless Transmitters
  • High Audio System

By Region:

  • North America
  • Latin America
  • Asia Pacific
  • Europe
  • Middle East and Africa (MEA)

Table of Content

  • 1. Executive Summary | RF Power Amplifier Market
  • 2. Market Overview
  • 3. Market Background
  • 4. Global Market Analysis 2017 to 2021 and Forecast, 2022 to 2032
  • 5. Global Market Analysis 2017 to 2021 and Forecast 2022 to 2032, By Frequency Output
    • 5.1. <10 GHz
    • 5.2. 10-60 GHz
    • 5.3. >60 GHz
  • 6. Global Market Analysis 2017 to 2021 and Forecast 2022 to 2032, By Type
    • 6.1. Solid State RF Power Amplifiers
    • 6.2. Vacuum Tube RF Power Amplifiers
  • 7. Global Market Analysis 2017 to 2021 and Forecast 2022 to 2032, By Industry Vertical
    • 7.1. Electronics
    • 7.2. Aerospace & Defense
    • 7.3. Automotive
    • 7.4. Healthcare
    • 7.5. Others
  • 8. Global Market Analysis 2017 to 2021 and Forecast 2022 to 2032, By Region
    • 8.1. North America
    • 8.2. Latin America
    • 8.3. Europe
    • 8.4. Asia Pacific
    • 8.5. Middle East and Africa
  • 9. North America Market Analysis 2017 to 2021 and Forecast 2022 to 2032, By Country
  • 10. Latin America Market Analysis 2017 to 2021 and Forecast 2022 to 2032, By Country
  • 11. Europe Market Analysis 2017 to 2021 and Forecast 2022 to 2032, By Country
  • 12. Asia Pacific Market Analysis 2017 to 2021 and Forecast 2022 to 2032, By Country
  • 13. Middle East and Africa Market Analysis 2017 to 2021 and Forecast 2022 to 2032, By Country
  • 14. Key Countries Market Analysis
  • 15. Market Structure Analysis
  • 16. Competition Analysis
    • 16.1. NXP Semiconductors
    • 16.2. Qualcomm Technologies, Inc.
    • 16.3. MACOM
    • 16.4. BONN Elektronik GmbH
    • 16.5. OPHIR RF
    • 16.6. Infineon Technologies AG
    • 16.7. CML Microsystems Plc
    • 16.8. Broadcom
    • 16.9. Analog Devices, Inc.
    • 16.10. ETL Systems Ltd
    • 16.11. Analogic Corporation
    • 16.12. ETS-Lindgren
    • 16.13. Murata Manufacturing Co., Ltd.
  • 17. Assumptions & Acronyms Used
  • 18. Research Methodology

List of Tables

Table 1: Global Market Value (US$ Million) Forecast by Region, 2017 to 2032

Table 2: Global Market Volume (Units) Forecast by Region, 2017 to 2032

Table 3: Global Market Value (US$ Million) Forecast by Frequency Output, 2017 to 2032

Table 4: Global Market Volume (Units) Forecast by Frequency Output, 2017 to 2032

Table 5: Global Market Value (US$ Million) Forecast by Type, 2017 to 2032

Table 6: Global Market Volume (Units) Forecast by Type, 2017 to 2032

Table 7: Global Market Value (US$ Million) Forecast by Industry Vertical, 2017 to 2032

Table 8: Global Market Volume (Units) Forecast by Industry Vertical, 2017 to 2032

Table 9: North America Market Value (US$ Million) Forecast by Country, 2017 to 2032

Table 10: North America Market Volume (Units) Forecast by Country, 2017 to 2032

Table 11: North America Market Value (US$ Million) Forecast by Frequency Output, 2017 to 2032

Table 12: North America Market Volume (Units) Forecast by Frequency Output, 2017 to 2032

Table 13: North America Market Value (US$ Million) Forecast by Type, 2017 to 2032

Table 14: North America Market Volume (Units) Forecast by Type, 2017 to 2032

Table 15: North America Market Value (US$ Million) Forecast by Industry Vertical, 2017 to 2032

Table 16: North America Market Volume (Units) Forecast by Industry Vertical, 2017 to 2032

Table 17: Latin America Market Value (US$ Million) Forecast by Country, 2017 to 2032

Table 18: Latin America Market Volume (Units) Forecast by Country, 2017 to 2032

Table 19: Latin America Market Value (US$ Million) Forecast by Frequency Output, 2017 to 2032

Table 20: Latin America Market Volume (Units) Forecast by Frequency Output, 2017 to 2032

Table 21: Latin America Market Value (US$ Million) Forecast by Type, 2017 to 2032

Table 22: Latin America Market Volume (Units) Forecast by Type, 2017 to 2032

Table 23: Latin America Market Value (US$ Million) Forecast by Industry Vertical, 2017 to 2032

Table 24: Latin America Market Volume (Units) Forecast by Industry Vertical, 2017 to 2032

Table 25: Europe Market Value (US$ Million) Forecast by Country, 2017 to 2032

Table 26: Europe Market Volume (Units) Forecast by Country, 2017 to 2032

Table 27: Europe Market Value (US$ Million) Forecast by Frequency Output, 2017 to 2032

Table 28: Europe Market Volume (Units) Forecast by Frequency Output, 2017 to 2032

Table 29: Europe Market Value (US$ Million) Forecast by Type, 2017 to 2032

Table 30: Europe Market Volume (Units) Forecast by Type, 2017 to 2032

Table 31: Europe Market Value (US$ Million) Forecast by Industry Vertical, 2017 to 2032

Table 32: Europe Market Volume (Units) Forecast by Industry Vertical, 2017 to 2032

Table 33: Asia Pacific Market Value (US$ Million) Forecast by Country, 2017 to 2032

Table 34: Asia Pacific Market Volume (Units) Forecast by Country, 2017 to 2032

Table 35: Asia Pacific Market Value (US$ Million) Forecast by Frequency Output, 2017 to 2032

Table 36: Asia Pacific Market Volume (Units) Forecast by Frequency Output, 2017 to 2032

Table 37: Asia Pacific Market Value (US$ Million) Forecast by Type, 2017 to 2032

Table 38: Asia Pacific Market Volume (Units) Forecast by Type, 2017 to 2032

Table 39: Asia Pacific Market Value (US$ Million) Forecast by Industry Vertical, 2017 to 2032

Table 40: Asia Pacific Market Volume (Units) Forecast by Industry Vertical, 2017 to 2032

Table 41: Middle East and Africa Market Value (US$ Million) Forecast by Country, 2017 to 2032

Table 42: Middle East and Africa Market Volume (Units) Forecast by Country, 2017 to 2032

Table 43: Middle East and Africa Market Value (US$ Million) Forecast by Frequency Output, 2017 to 2032

Table 44: Middle East and Africa Market Volume (Units) Forecast by Frequency Output, 2017 to 2032

Table 45: Middle East and Africa Market Value (US$ Million) Forecast by Type, 2017 to 2032

Table 46: Middle East and Africa Market Volume (Units) Forecast by Type, 2017 to 2032

Table 47: Middle East and Africa Market Value (US$ Million) Forecast by Industry Vertical, 2017 to 2032

Table 48: Middle East and Africa Market Volume (Units) Forecast by Industry Vertical, 2017 to 2032

List of Figures

Figure 1: Global Market Value (US$ Million) by Frequency Output, 2022 to 2032

Figure 2: Global Market Value (US$ Million) by Type, 2022 to 2032

Figure 3: Global Market Value (US$ Million) by Industry Vertical, 2022 to 2032

Figure 4: Global Market Value (US$ Million) by Region, 2022 to 2032

Figure 5: Global Market Value (US$ Million) Analysis by Region, 2017 to 2032

Figure 6: Global Market Volume (Units) Analysis by Region, 2017 to 2032

Figure 7: Global Market Value Share (%) and BPS Analysis by Region, 2022 to 2032

Figure 8: Global Market Y-o-Y Growth (%) Projections by Region, 2022 to 2032

Figure 9: Global Market Value (US$ Million) Analysis by Frequency Output, 2017 to 2032

Figure 10: Global Market Volume (Units) Analysis by Frequency Output, 2017 to 2032

Figure 11: Global Market Value Share (%) and BPS Analysis by Frequency Output, 2022 to 2032

Figure 12: Global Market Y-o-Y Growth (%) Projections by Frequency Output, 2022 to 2032

Figure 13: Global Market Value (US$ Million) Analysis by Type, 2017 to 2032

Figure 14: Global Market Volume (Units) Analysis by Type, 2017 to 2032

Figure 15: Global Market Value Share (%) and BPS Analysis by Type, 2022 to 2032

Figure 16: Global Market Y-o-Y Growth (%) Projections by Type, 2022 to 2032

Figure 17: Global Market Value (US$ Million) Analysis by Industry Vertical, 2017 to 2032

Figure 18: Global Market Volume (Units) Analysis by Industry Vertical, 2017 to 2032

Figure 19: Global Market Value Share (%) and BPS Analysis by Industry Vertical, 2022 to 2032

Figure 20: Global Market Y-o-Y Growth (%) Projections by Industry Vertical, 2022 to 2032

Figure 21: Global Market Attractiveness by Frequency Output, 2022 to 2032

Figure 22: Global Market Attractiveness by Type, 2022 to 2032

Figure 23: Global Market Attractiveness by Industry Vertical, 2022 to 2032

Figure 24: Global Market Attractiveness by Region, 2022 to 2032

Figure 25: North America Market Value (US$ Million) by Frequency Output, 2022 to 2032

Figure 26: North America Market Value (US$ Million) by Type, 2022 to 2032

Figure 27: North America Market Value (US$ Million) by Industry Vertical, 2022 to 2032

Figure 28: North America Market Value (US$ Million) by Country, 2022 to 2032

Figure 29: North America Market Value (US$ Million) Analysis by Country, 2017 to 2032

Figure 30: North America Market Volume (Units) Analysis by Country, 2017 to 2032

Figure 31: North America Market Value Share (%) and BPS Analysis by Country, 2022 to 2032

Figure 32: North America Market Y-o-Y Growth (%) Projections by Country, 2022 to 2032

Figure 33: North America Market Value (US$ Million) Analysis by Frequency Output, 2017 to 2032

Figure 34: North America Market Volume (Units) Analysis by Frequency Output, 2017 to 2032

Figure 35: North America Market Value Share (%) and BPS Analysis by Frequency Output, 2022 to 2032

Figure 36: North America Market Y-o-Y Growth (%) Projections by Frequency Output, 2022 to 2032

Figure 37: North America Market Value (US$ Million) Analysis by Type, 2017 to 2032

Figure 38: North America Market Volume (Units) Analysis by Type, 2017 to 2032

Figure 39: North America Market Value Share (%) and BPS Analysis by Type, 2022 to 2032

Figure 40: North America Market Y-o-Y Growth (%) Projections by Type, 2022 to 2032

Figure 41: North America Market Value (US$ Million) Analysis by Industry Vertical, 2017 to 2032

Figure 42: North America Market Volume (Units) Analysis by Industry Vertical, 2017 to 2032

Figure 43: North America Market Value Share (%) and BPS Analysis by Industry Vertical, 2022 to 2032

Figure 44: North America Market Y-o-Y Growth (%) Projections by Industry Vertical, 2022 to 2032

Figure 45: North America Market Attractiveness by Frequency Output, 2022 to 2032

Figure 46: North America Market Attractiveness by Type, 2022 to 2032

Figure 47: North America Market Attractiveness by Industry Vertical, 2022 to 2032

Figure 48: North America Market Attractiveness by Country, 2022 to 2032

Figure 49: Latin America Market Value (US$ Million) by Frequency Output, 2022 to 2032

Figure 50: Latin America Market Value (US$ Million) by Type, 2022 to 2032

Figure 51: Latin America Market Value (US$ Million) by Industry Vertical, 2022 to 2032

Figure 52: Latin America Market Value (US$ Million) by Country, 2022 to 2032

Figure 53: Latin America Market Value (US$ Million) Analysis by Country, 2017 to 2032

Figure 54: Latin America Market Volume (Units) Analysis by Country, 2017 to 2032

Figure 55: Latin America Market Value Share (%) and BPS Analysis by Country, 2022 to 2032

Figure 56: Latin America Market Y-o-Y Growth (%) Projections by Country, 2022 to 2032

Figure 57: Latin America Market Value (US$ Million) Analysis by Frequency Output, 2017 to 2032

Figure 58: Latin America Market Volume (Units) Analysis by Frequency Output, 2017 to 2032

Figure 59: Latin America Market Value Share (%) and BPS Analysis by Frequency Output, 2022 to 2032

Figure 60: Latin America Market Y-o-Y Growth (%) Projections by Frequency Output, 2022 to 2032

Figure 61: Latin America Market Value (US$ Million) Analysis by Type, 2017 to 2032

Figure 62: Latin America Market Volume (Units) Analysis by Type, 2017 to 2032

Figure 63: Latin America Market Value Share (%) and BPS Analysis by Type, 2022 to 2032

Figure 64: Latin America Market Y-o-Y Growth (%) Projections by Type, 2022 to 2032

Figure 65: Latin America Market Value (US$ Million) Analysis by Industry Vertical, 2017 to 2032

Figure 66: Latin America Market Volume (Units) Analysis by Industry Vertical, 2017 to 2032

Figure 67: Latin America Market Value Share (%) and BPS Analysis by Industry Vertical, 2022 to 2032

Figure 68: Latin America Market Y-o-Y Growth (%) Projections by Industry Vertical, 2022 to 2032

Figure 69: Latin America Market Attractiveness by Frequency Output, 2022 to 2032

Figure 70: Latin America Market Attractiveness by Type, 2022 to 2032

Figure 71: Latin America Market Attractiveness by Industry Vertical, 2022 to 2032

Figure 72: Latin America Market Attractiveness by Country, 2022 to 2032

Figure 73: Europe Market Value (US$ Million) by Frequency Output, 2022 to 2032

Figure 74: Europe Market Value (US$ Million) by Type, 2022 to 2032

Figure 75: Europe Market Value (US$ Million) by Industry Vertical, 2022 to 2032

Figure 76: Europe Market Value (US$ Million) by Country, 2022 to 2032

Figure 77: Europe Market Value (US$ Million) Analysis by Country, 2017 to 2032

Figure 78: Europe Market Volume (Units) Analysis by Country, 2017 to 2032

Figure 79: Europe Market Value Share (%) and BPS Analysis by Country, 2022 to 2032

Figure 80: Europe Market Y-o-Y Growth (%) Projections by Country, 2022 to 2032

Figure 81: Europe Market Value (US$ Million) Analysis by Frequency Output, 2017 to 2032

Figure 82: Europe Market Volume (Units) Analysis by Frequency Output, 2017 to 2032

Figure 83: Europe Market Value Share (%) and BPS Analysis by Frequency Output, 2022 to 2032

Figure 84: Europe Market Y-o-Y Growth (%) Projections by Frequency Output, 2022 to 2032

Figure 85: Europe Market Value (US$ Million) Analysis by Type, 2017 to 2032

Figure 86: Europe Market Volume (Units) Analysis by Type, 2017 to 2032

Figure 87: Europe Market Value Share (%) and BPS Analysis by Type, 2022 to 2032

Figure 88: Europe Market Y-o-Y Growth (%) Projections by Type, 2022 to 2032

Figure 89: Europe Market Value (US$ Million) Analysis by Industry Vertical, 2017 to 2032

Figure 90: Europe Market Volume (Units) Analysis by Industry Vertical, 2017 to 2032

Figure 91: Europe Market Value Share (%) and BPS Analysis by Industry Vertical, 2022 to 2032

Figure 92: Europe Market Y-o-Y Growth (%) Projections by Industry Vertical, 2022 to 2032

Figure 93: Europe Market Attractiveness by Frequency Output, 2022 to 2032

Figure 94: Europe Market Attractiveness by Type, 2022 to 2032

Figure 95: Europe Market Attractiveness by Industry Vertical, 2022 to 2032

Figure 96: Europe Market Attractiveness by Country, 2022 to 2032

Figure 97: Asia Pacific Market Value (US$ Million) by Frequency Output, 2022 to 2032

Figure 98: Asia Pacific Market Value (US$ Million) by Type, 2022 to 2032

Figure 99: Asia Pacific Market Value (US$ Million) by Industry Vertical, 2022 to 2032

Figure 100: Asia Pacific Market Value (US$ Million) by Country, 2022 to 2032

Figure 101: Asia Pacific Market Value (US$ Million) Analysis by Country, 2017 to 2032

Figure 102: Asia Pacific Market Volume (Units) Analysis by Country, 2017 to 2032

Figure 103: Asia Pacific Market Value Share (%) and BPS Analysis by Country, 2022 to 2032

Figure 104: Asia Pacific Market Y-o-Y Growth (%) Projections by Country, 2022 to 2032

Figure 105: Asia Pacific Market Value (US$ Million) Analysis by Frequency Output, 2017 to 2032

Figure 106: Asia Pacific Market Volume (Units) Analysis by Frequency Output, 2017 to 2032

Figure 107: Asia Pacific Market Value Share (%) and BPS Analysis by Frequency Output, 2022 to 2032

Figure 108: Asia Pacific Market Y-o-Y Growth (%) Projections by Frequency Output, 2022 to 2032

Figure 109: Asia Pacific Market Value (US$ Million) Analysis by Type, 2017 to 2032

Figure 110: Asia Pacific Market Volume (Units) Analysis by Type, 2017 to 2032

Figure 111: Asia Pacific Market Value Share (%) and BPS Analysis by Type, 2022 to 2032

Figure 112: Asia Pacific Market Y-o-Y Growth (%) Projections by Type, 2022 to 2032

Figure 113: Asia Pacific Market Value (US$ Million) Analysis by Industry Vertical, 2017 to 2032

Figure 114: Asia Pacific Market Volume (Units) Analysis by Industry Vertical, 2017 to 2032

Figure 115: Asia Pacific Market Value Share (%) and BPS Analysis by Industry Vertical, 2022 to 2032

Figure 116: Asia Pacific Market Y-o-Y Growth (%) Projections by Industry Vertical, 2022 to 2032

Figure 117: Asia Pacific Market Attractiveness by Frequency Output, 2022 to 2032

Figure 118: Asia Pacific Market Attractiveness by Type, 2022 to 2032

Figure 119: Asia Pacific Market Attractiveness by Industry Vertical, 2022 to 2032

Figure 120: Asia Pacific Market Attractiveness by Country, 2022 to 2032

Figure 121: Middle East and Africa Market Value (US$ Million) by Frequency Output, 2022 to 2032

Figure 122: Middle East and Africa Market Value (US$ Million) by Type, 2022 to 2032

Figure 123: Middle East and Africa Market Value (US$ Million) by Industry Vertical, 2022 to 2032

Figure 124: Middle East and Africa Market Value (US$ Million) by Country, 2022 to 2032

Figure 125: Middle East and Africa Market Value (US$ Million) Analysis by Country, 2017 to 2032

Figure 126: Middle East and Africa Market Volume (Units) Analysis by Country, 2017 to 2032

Figure 127: Middle East and Africa Market Value Share (%) and BPS Analysis by Country, 2022 to 2032

Figure 128: Middle East and Africa Market Y-o-Y Growth (%) Projections by Country, 2022 to 2032

Figure 129: Middle East and Africa Market Value (US$ Million) Analysis by Frequency Output, 2017 to 2032

Figure 130: Middle East and Africa Market Volume (Units) Analysis by Frequency Output, 2017 to 2032

Figure 131: Middle East and Africa Market Value Share (%) and BPS Analysis by Frequency Output, 2022 to 2032

Figure 132: Middle East and Africa Market Y-o-Y Growth (%) Projections by Frequency Output, 2022 to 2032

Figure 133: Middle East and Africa Market Value (US$ Million) Analysis by Type, 2017 to 2032

Figure 134: Middle East and Africa Market Volume (Units) Analysis by Type, 2017 to 2032

Figure 135: Middle East and Africa Market Value Share (%) and BPS Analysis by Type, 2022 to 2032

Figure 136: Middle East and Africa Market Y-o-Y Growth (%) Projections by Type, 2022 to 2032

Figure 137: Middle East and Africa Market Value (US$ Million) Analysis by Industry Vertical, 2017 to 2032

Figure 138: Middle East and Africa Market Volume (Units) Analysis by Industry Vertical, 2017 to 2032

Figure 139: Middle East and Africa Market Value Share (%) and BPS Analysis by Industry Vertical, 2022 to 2032

Figure 140: Middle East and Africa Market Y-o-Y Growth (%) Projections by Industry Vertical, 2022 to 2032

Figure 141: Middle East and Africa Market Attractiveness by Frequency Output, 2022 to 2032

Figure 142: Middle East and Africa Market Attractiveness by Type, 2022 to 2032

Figure 143: Middle East and Africa Market Attractiveness by Industry Vertical, 2022 to 2032

Figure 144: Middle East and Africa Market Attractiveness by Country, 2022 to 2032

Frequently Asked Questions

What is the Growth Outlook for the Global RF Power Amplifier Market?

The global RF Power Amplifier market is set to advance at a CAGR of 14.2% from 2022 to 2032.

What is the Future of the RF Power Amplifier Market?

The future of the RF power amplifier market is likely to account for USD 19,670 Million by 2032.

What is the Anticipated RF Power Amplifier Market Share of North America?

North America is likely to hold an RF power amplifier market share of 28.4% in 2022.

What is the Adoption Potential of RF Power Amplifiers?

The adoption of RF Power Amplifiers is likely to reach a valuation of USD 5230 Million in 2022.

Explore Similar Insights

Future Market Insights

RF Power Amplifier Market