

- Market Size (2026)
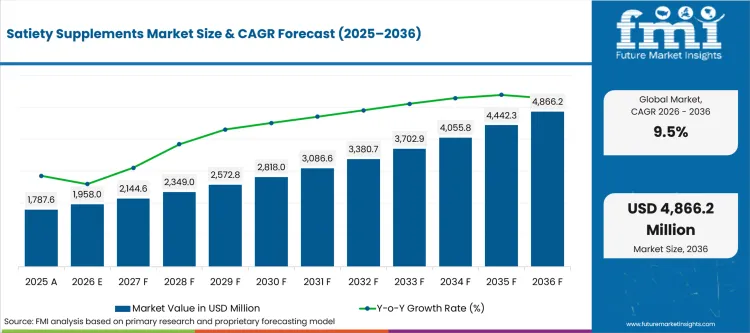
- USD 1958.0 Mn
- Forecast (2036)
- USD 4866.2 Mn
- CAGR (2026 to 2036)
- 9.5%
How big is the Satiety Supplements Market in 2026?
USD 1,958.0 million in 2026 and USD 4,866.2 million by 2036 at a 9.5% CAGR.
Satiety supplements demand is tied to formulation credibility and repeat-purchase pressure. Buyer groups such as brand owners, retailers and formulation teams are paying closer attention to consumer repeat purchase and ingredient credibility. Contract manufacturers remain part of the same sourcing check. Sensory performance and channel fit also affect supplier qualification. Poor product fit can still create waste, delay or approval risk. The purchase case improves when the market supports claim substantiation and user adherence. Public food, ingredient, and safety references can support the market boundary; but formulation fit still has to be proven in the buyer's product. The senior-buyer test is claim substantiation and user adherence. Sourcing teams need product evidence, claim support, and manufacturing confidence before the item moves from trial to launch.
Key Takeaways of Satiety Supplements Market
- Demand for satiety supplements is driven by claim substantiation and user adherence, with buyers prioritizing suppliers that reduce formulation risk and demonstrate measurable product performance before scaling adoption.
- By product type, powders are expected to lead with 34.3% share in 2026 (USD 671.6 million), gaining importance when product performance aligns with buyer specifications.
- Glucomannan is the dominant ingredient segment, projected to hold 32.0% share in 2026 (USD 626.6 million), with technical performance remaining a key purchasing criterion.
- Appetite suppression is estimated to lead the function category with 30.5% share in 2026 (USD 597.2 million), driven by trial evidence and application fit influencing repeat purchasing decisions.
- Buyers favor suppliers that minimize uncertainty after the initial order, seeking fewer launch failures from weak batches, missed specifications, or delayed support that could disrupt operations.
- India and China are expected to form the higher-growth country tier, advancing at 11.8% and 10.8% CAGR respectively through 2036, supported by expanding sourcing activity and large-scale channel operations.
- Competition centers on Nestlé, Abbott, Herbalife, Glanbia, GNC, Amway, Mars, Roquette, Ingredion, and Beneo, with vendors differentiating through product fit, documentation quality, channel reach, and service support.
Analyst Opinion
"The satiety supplements market is being shaped by products that can consistently support appetite management while fitting seamlessly into consumer wellness routines. Brand owners and manufacturers are looking for suppliers that provide substantiated efficacy, formulation expertise, and dependable technical support beyond product launch. Companies that combine scientifically backed ingredients with reliable quality standards and responsive customer service are likely to build lasting commercial relationships in this rapidly evolving category."
How is the Satiety Supplements Market segmented?
The satiety supplements industry is segmented by Product Type, Ingredient and Function; Distribution Channel and Region complete the forecast structure.
In satiety supplements market, segmentation starts with Product Type, Ingredient and Function. Distribution Channel and Region then show where use case, channel role, and geography change the buying case. Shares stay in the segment questions, so this view stays focused on how the market is organized.
Where does glucomannan create value in the ingredient category?
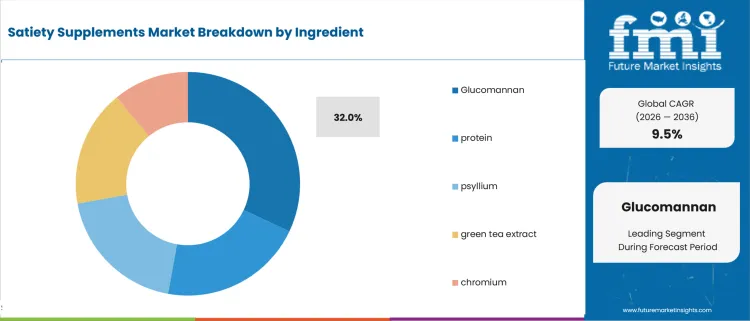
Glucomannan leads Ingredient because it has the deepest clinical evidence base among fiber-derived satiety actives, giving formulators a defensible claim when a regulator or retailer questions the product's appetite-suppression messaging. Supplement brands and contract manufacturers are the primary users, and the deciding factor is whether the ingredient's viscosity and expansion behavior stays consistent across batches, since inconsistent gel formation weakens the physical fullness effect the claim depends on.
- Glucomannan holds 32% of Ingredient share in 2026 at USD 626.6 million, growing from USD 569.6 million in 2025 to USD 1,557.2 million by 2036. This position reflects the ingredient's established clinical backing relative to newer satiety actives still building their evidence base.
- Repeat purchasing hinges on whether users experience the physical fullness effect consistently, since a batch with weak gel-forming behavior undercuts the product's core claim quickly. Brands sourcing from suppliers with tight viscosity specifications retain user adherence better than those absorbing batch variability.
What keeps appetite suppression relevant within function?
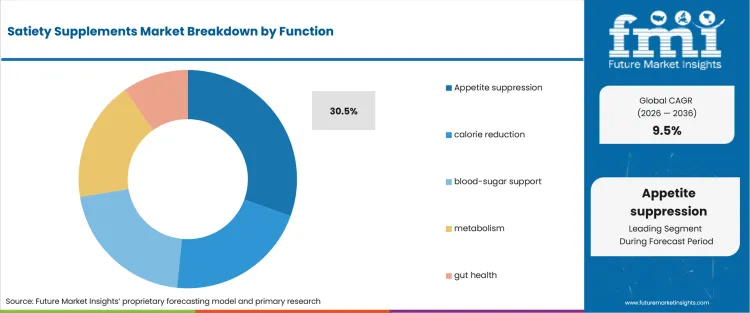
Appetite suppression leads Function because it maps to the most immediate and self-evident use case in the category: a user takes the product expecting to feel less hungry within a single sitting, unlike slower-acting metabolic or fat-management claims that take weeks to show results. Brands marketing to weight-conscious consumers are the primary drivers here, and the deciding factor is whether the effect is noticeable enough, quickly enough, to justify a repeat purchase before the user gives up on the category.
- Appetite suppression contributes 30.5% of Function share in 2026 at USD 597.2 million, projected to reach USD 1,484.2 million by 2036, reflecting the segment's fit with the fastest, most self-verifiable satiety claim in the category.
- Trial-to-repeat conversion depends on how quickly a user notices reduced hunger after first use, since a delayed or unclear effect loses buyers before a second purchase. Brands pairing the product with clear usage guidance see stronger follow-through past the first trial.
How does powders influence buying within product Type?
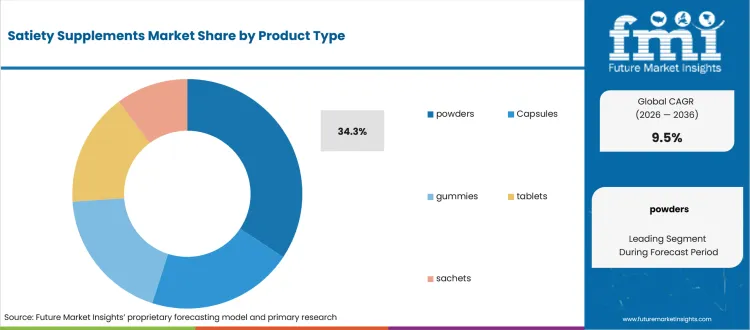
Powders give brands more flexibility in dosing than capsules, letting a user adjust serving size against body weight or appetite intensity, which matters for a category where the right dose varies more by individual than in most supplement types. Contract manufacturers and private-label brands favor this format for its lower per-unit cost, and the deciding factor is whether the powder mixes cleanly without clumping or separating in liquid, since a poor mixing experience undercuts daily use.
- Powders represent 34.3% of Product Type share in 2026, equal to USD 671.6 million, rising from USD 610.5 million in 2025 to USD 1,669.1 million by 2036, reflecting the format's dosing flexibility relative to fixed-dose capsules.
- Daily-use adherence depends on mixing quality and taste masking, since a gritty or unpleasant-tasting powder gets abandoned faster than a capsule with no sensory barrier. Brands investing in flavor and solubility testing see longer user retention across repeat purchases.
Why is capsules still important in product Type?
Capsules solve the convenience problem powders can't: no mixing, no taste to mask, and a dose a user can take on the go, which matters for glucomannan-based products where the ingredient's viscosity makes for an unpleasant drinking experience in liquid form. Time-pressed consumers and brands targeting portability are the primary drivers, and the deciding factor is whether the capsule size and count per serving stays manageable, since satiety ingredients often require a higher dose than a single capsule can hold.
- Capsules stand at 27.7% of Product Type share in 2026, equal to USD 542.4 million, moving from USD 493.1 million in 2025 to USD 1,347.9 million by 2036, reflecting the format's convenience advantage for ingredients that are difficult to consume in powder form.
- Repeat purchasing depends on whether the daily capsule count stays reasonable for the user, since a dose requiring six or more capsules per serving discourages consistent use. Brands optimizing capsule size and fill density retain adherence better than those requiring a high pill count.
How should buyers read North America demand within Region?
North America benefits from earlier regulatory clarity around satiety-ingredient claims than several other regions, giving brands a clearer path to market appetite-suppression messaging without the extended substantiation requirements some markets impose. Supplement brands and retailers in the region are the primary adopters, and the deciding factor is whether the market's already-high supplement consumption habits translate into consistent reorder behavior for a category still building long-term user loyalty.
- North America accounts for 26.8% of Region share in 2026, rising from USD 477.0 million in 2025 to USD 524.7 million in 2026 and reaching USD 1,304.1 million by 2036, reflecting the region's earlier regulatory clarity relative to markets still developing satiety-claim standards.
- Claim substantiation shapes retailer confidence in the region, since a brand that can document its appetite-suppression evidence clearly secures shelf space faster than one relying on unverified marketing claims. That documentation also supports user adherence once the product reaches the shelf.
What factors shape the Satiety Supplements Market?
Satiety supplements market purchases are being shaped by claim credibility, formulation performance, repeat purchase; and channel fit.
- Driver: claim substantiation and user adherence. Demand strengthens when buyers can connect the purchase to a measurable operating, formulation, compliance; or cost outcome in Satiety Supplements Market.
- Restraint: proof burden and implementation risk. Adoption slows when Satiety Supplements Market buyers cannot validate claim substantiation and user adherence under their own operating conditions.
- Opportunity: supplier programs built around claim substantiation and user adherence. The better opening is with vendors that make approval easier through field support, clear proof, and repeatable execution.
Satiety Supplements Market demand is strongest where the product solves a real formulation or consumer-repeat problem. Brand teams need evidence that the ingredient, format, or claim can survive taste; label; cost; and retail review.
Supplier pressure is strongest where Satiety Supplements Market buyers need proof before changing an approved route. Evidence quality and service response decide whether the first order becomes recurring spend.
Adoption can still slow when Satiety Supplements Market buyers do not know who owns rollout support. Vendors that define responsibility early have a cleaner path to repeat orders.
Which country CAGRs are profiled in the Satiety Supplements Market?
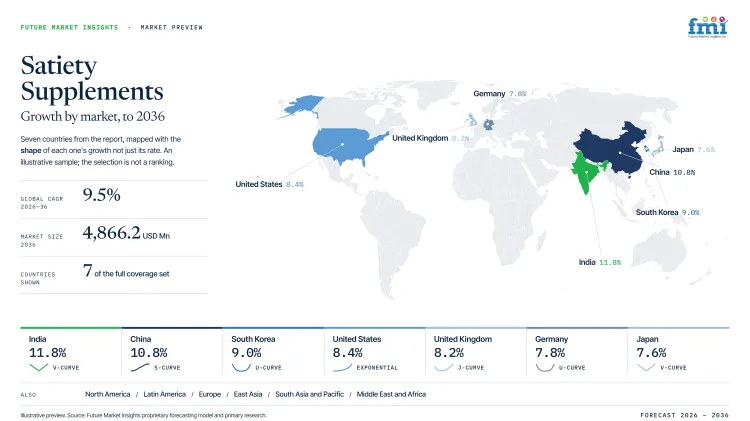
| Country | CAGR |
|---|---|
| United States | 8.4% |
| China | 10.8% |
| India | 11.8% |
| Germany | 7.8% |
| United Kingdom | 8.2% |
| Japan | 7.6% |
| South Korea | 8.9% |
| Rest of World | 10.2% |
How do country-level CAGRs compare in the Satiety Supplements Market?
The country comparison spans 4.2 percentage points and reveals four distinct growth groups across the satiety supplements market. India, China and the Rest of World form the highest-growth cluster with 1.6 percentage points separating the three markets. South Korea stands between the upper and lower groups, positioned 1.3 percentage points below the Rest of World. The United States and the United Kingdom remain closely aligned with only a 0.2-point difference, while Germany and Japan are separated by just 0.2 percentage points. Markets where preventive health, weight management and functional nutrition are gaining wider consumer acceptance generally demonstrate stronger growth.
- India records the highest CAGR at 11.8% as increasing obesity awareness, expanding preventive healthcare spending and rising demand for science-backed weight management products continue to strengthen consumption of satiety supplements.
- China follows 1.0 percentage point behind India, supported by a rapidly growing functional nutrition sector, greater consumer focus on healthy weight maintenance and expanding availability of dietary supplements through online and retail channels.
- The Rest of World stands at 10.2%, remaining 0.6 percentage points below China. Growth is driven by rising health awareness, increasing adoption of nutritional supplements and expanding access to wellness products across emerging consumer markets.
- South Korea sits 1.3 percentage points below the Rest of World, where strong consumer interest in fitness, calorie management and premium health supplements continues to create opportunities for satiety-focused formulations.
- The United States posts a CAGR of 8.4%, trailing South Korea by 0.5 percentage points. Demand is supported by widespread use of dietary supplements, growing preference for appetite management products and continued interest in high-fiber and protein-based formulations.
- The United Kingdom remains only 0.2 percentage points below the United States as consumers increasingly incorporate satiety supplements into broader wellness and weight control routines alongside balanced nutrition and active lifestyles.
- Germany records a CAGR of 7.8%, placing it 0.4 percentage points below the United Kingdom. The market benefits from steady demand for clinically supported nutritional products and increasing preference for natural ingredients that promote fullness and portion control.
- Japan registers a CAGR of 7.6%, just 0.2 percentage points below Germany. Product uptake is shaped by an aging population, growing interest in metabolic health and demand for convenient nutritional solutions that complement healthy eating habits.
Comparable CAGRs can still produce different market entry conditions. Differences in consumer health priorities, dietary supplement regulations, retail distribution networks and acceptance of functional nutrition influence commercialization opportunities and long-term market development. The full report provides country-level CAGR analysis across North America, Latin America, Europe, East Asia, South Asia, Oceania and the Middle East and Africa.
Country-wise Analysis
- United States rises from USD 427.2 million in 2025 to USD 469.9 million in 2026. By 2036, it is projected at USD 1,050.8 million at a 8.4% CAGR. United States buyers treat Satiety Supplements Market as a claim substantiation and user adherence decision. Approval usually needs measurable operating proof before volume moves from existing suppliers.
- For Satiety Supplements Market, China moves from USD 267.0 million in 2025 to USD 293.7 million in 2026. The 2036 value is USD 817.7 million, supported by an 10.8% CAGR. China's buying condition is scale plus execution discipline in Satiety Supplements Market. Suppliers need availability, channel control, and proof that claim substantiation and user adherence can hold across fast-ramping accounts.
- For Satiety Supplements Market, India is estimated at USD 178.0 million in 2025 and USD 195.8 million in 2026. It is projected at USD 596.4 million by 2036, with a 11.8% CAGR. India demand is tied to formal procurement and wider production activity in Satiety Supplements Market. Cost remains a hard filter, so suppliers need a price case that still supports claim substantiation and user adherence.
- Germany stands at USD 142.4 million in 2025 and USD 156.6 million in 2026. By 2036, the value is projected at USD 331.4 million at a 7.8% CAGR. Germany is qualification-led for Satiety Supplements Market. Technical review focuses on whether claim substantiation and user adherence can be proven before commercial negotiation.
- United Kingdom rises from USD 106.8 million in 2025 to USD 117.5 million in 2026. By 2036, it is projected at USD 257.9 million at a 8.2% CAGR. United Kingdom buyers in Satiety Supplements Market place more weight on vendor accountability and delivery reliability. Switching costs rise when claim substantiation and user adherence is not supported after purchase.
- Japan moves from USD 124.6 million in 2025 to USD 137.1 million in 2026. The 2036 value is USD 284.6 million, supported by an 7.6% CAGR. Japan's approval cycle for Satiety Supplements Market favors suppliers that reduce inspection work and keep claim substantiation and user adherence consistent across repeat orders.
- South Korea is estimated at USD 71.20 million in 2025 and USD 78.32 million in 2026. It is projected at USD 185.1 million by 2036, with a 8.9% CAGR. South Korea's compact supply chains make Satiety Supplements Market feedback fast. Suppliers need responsive support because weak execution on claim substantiation and user adherence can affect production schedules.
- Rest of World stands at USD 462.8 million in 2025 and USD 509.1 million in 2026. By 2036, the value is projected at USD 1,342.4 million at a 10.2% CAGR. Rest of World demand for Satiety Supplements Market is uneven. Local service access and import reliability matter where buyers need help proving claim substantiation and user adherence without mature support networks.
Who are the notable companies in the Satiety Supplements Market?
Nestle; Abbott; Herbalife; Glanbia; GNC; Amway; Roquette; Ingredion and Beneo are the notable companies assessed in this market.
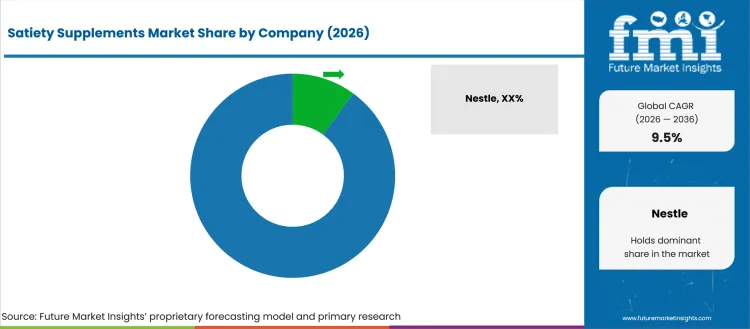
Satiety Supplements Market competition is strongest where suppliers can connect ingredient function with launch economics. Buyers compare who can help brands protect taste, label credibility, shelf stability; and repeat purchase after launch.
- Nutrition companies such as Nestle, Abbott, Herbalife and Glanbia matter when buyers compare supplier fit against the approval burden. Their value depends on evidence quality and service response after selection.
- Retail supplement brands such as GNC, and Amway are useful where procurement needs a supplier role that is clear before volume expands. Buyers check whether the group can support the use case after approval.
- Satiety ingredient suppliers such as Roquette, Ingredion and Beneo matter where the buyer needs deeper application guidance or specification fit. Their advantage is narrower expertise that can shorten review after a trial.
Competitive Benchmarking: Satiety Supplements Market
| Company | Brand or Ingredient Fit | Application Support | Channel Reach | Geographic Footprint |
|---|---|---|---|---|
| Nestle | High | High | Strong | Global |
| Abbott | High | Medium | Strong | Global |
| Herbalife | Strong | High | Medium | Global or regional |
| Glanbia | Medium | High | Medium | Regional |
| GNC | Strong | Medium | Medium | Regional or global |
| Amway | High | High | Strong | Global |
| Roquette | Strong | High | Medium | Global or regional |
| Ingredion | Medium | High | Medium | Regional |
| Beneo | Strong | Medium | Medium | Regional or global |
Source: Future Market Insights competitive analysis, 2026. Ratings for Satiety Supplements Market reflect formulation support, claim credibility, ingredient availability; channel fit; and relevance to branded food or nutrition launches.
Key Players in the Satiety Supplements Market
Nutrition companies
- Nestle
- Abbott
- Herbalife
- Glanbia
Retail supplement brands
- GNC
- Amway
Satiety ingredient suppliers
- Roquette
- Ingredion
- Beneo
Satiety Supplements Market - Report Scope
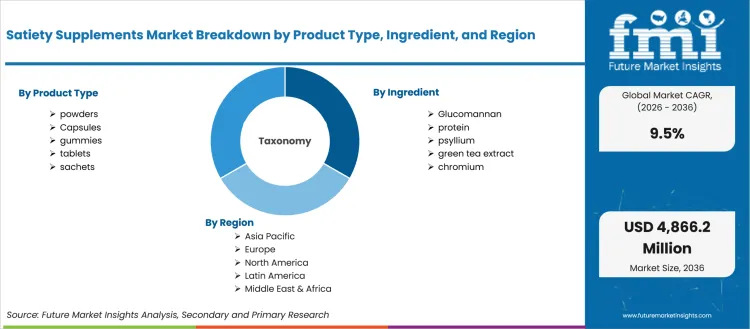
| Coverage field | Report scope |
|---|---|
| Market breakdown | Satiety Supplements Market Breakdown By Product Type, Ingredient and Function; Distribution Channel and Region |
| Market Definition | Commercial demand for products; services covered under Satiety Supplements Market; including country demand; segment demand; and supplier-selection context |
| Regions Covered | North America; Latin America; Europe; East Asia; South Asia and Pacific; Middle East and Africa |
| Countries Covered | United States; United Kingdom; Germany; France; Japan; China; South Korea; India; and 30+ countries |
| Key Companies Profiled | Nestle; Abbott; Herbalife; Glanbia; GNC; Amway; Roquette; Ingredion; and Beneo |
| Forecast Period | 2026 to 2036 |
| Approach | Satiety Supplements Market: Ingredient demand, product-format use, retail and formulation signals; country channel readiness; and supplier relevance were used to build the sizing approach. |
Satiety Supplements Market - Research Methodology
| Method | Approach |
|---|---|
| Primary Research |
FMI analysts gathered input from manufacturers, service providers, technology developers, distributors, end users, sourcing teams, and subject-matter experts. Interviews examined purchasing decisions, product or service evaluation, adoption barriers, approval requirements, pricing considerations, and expectations for technical or commercial support. Respondents were also asked what evidence is required before a trial, pilot, or initial order develops into regular purchasing. |
| Desk Research |
Desk research covered government statistics, regulatory publications, trade data, industry associations, technical literature, standards, company filings, product information, and official corporate announcements. Sources were reviewed for relevance, publication date, geographic coverage, and consistency with the defined market scope. Claims relating to performance, applications, approvals, capacity, investment, and commercial activity were retained only when supported by credible public evidence. |
| Market Sizing and Forecasting |
The market model combined the baseline value with historical performance, segment structure, pricing and volume indicators, adoption levels, company participation, and country-level demand conditions. Forecast assumptions considered economic activity, investment trends, regulatory developments, technology adoption, purchasing cycles, supply availability, and barriers to wider market use. Segment and regional estimates were reconciled before the final market total was calculated. |
| Data Validation |
Estimates were checked against multiple independent indicators, including public data, company activity, trade patterns, industry developments, and findings from primary interviews. Validation also tested whether products, services, applications, and company revenues fell within the defined market boundaries. Adjacent categories, unsupported claims, overlapping revenues, and activities without direct market relevance were excluded to reduce double counting and maintain consistency across segments and countries. |
Satiety Supplements Market by Segments
Satiety Supplements Market segmented by Product Type:
- Capsules
- Powders
- Gummies
- Tablets
- Sachets
Satiety Supplements Market segmented by Ingredient:
- Glucomannan
- Protein
- Psyllium
- Green tea extract
- Chromium
Satiety Supplements Market segmented by Function:
- Appetite suppression
- Calorie reduction
- Blood-sugar support
- Metabolism
- Gut health
Satiety Supplements Market segmented by Distribution Channel:
- Pharmacies
- Online retail
- Specialty stores
- Supermarkets
- Direct-to-consumer
Satiety Supplements Market segmented by Region:
- North America
- Europe
- East Asia
- South Asia
- Latin America
Research Sources and Bibliography
Secondary validation for Satiety Supplements Market uses food consumption data, ingredient oversight, safety references and trade exposure together. Consumption sources frame the demand base, FDA/Codex/EFSA help define what can be sold or claimed, and trade data tests whether ingredient availability supports the forecast story.
- 1. FAOSTAT.
- 2. USDA ERS Food Availability Data System.
- 3. FDA Food Ingredients and Packaging.
- 4. Codex Alimentarius.
- 5. EFSA Food Ingredients and Packaging.
- 6. WHO Food Safety.y claims.
- 7. UN Comtrade.
- 8. Nestle.
- 9. Abbott.
- 10. Herbalife.
- 11. Glanbia.
- 12. GNC.
- 13. Amway.
- 14. Mars.
This Report Answers
- What value is forecast for the Satiety Supplements Market in 2026 and by 2036?
- What CAGR is forecast for the Satiety Supplements Market during the 2026 to 2036 period?
- Which segment groups are used to assess demand across Satiety Supplements Market?
- Which buyer problems are creating procurement interest in Satiety Supplements Market?
- How do the main segment shares shape Satiety Supplements Market decisions in the 2026 base?
- Which countries are profiled in the Satiety Supplements Market forecast and how do their CAGRs differ?
- Which companies are assessed in this market?
- What should Satiety Supplements Market buyers evaluate before changing suppliers?
- How does FMI size and validate Satiety Supplements Market country and segment demand?
- What risks could delay Satiety Supplements Market adoption, qualification, or repeat purchasing?
Frequently Asked Questions
Why should executives track the Satiety Supplements Market?
Executives should track Satiety Supplements Market because claim substantiation and user adherence affects procurement risk and operating performance. The value is in knowing where the purchase can reduce cost, avoid disruption, or improve buyer confidence.
What business problem does the Satiety Supplements Market address?
Satiety Supplements Market addresses claim substantiation and user adherence. Buyers use the category when routine procurement cannot protect launch quality, channel fit, or repeat purchase.
What should Satiety Supplements Market procurement leaders evaluate before selecting suppliers?
Satiety Supplements Market procurement leaders should test ingredient reliability, formulation fit, label risk; sensory impact; and production scalability. A low-cost input is weak if it damages repeat purchase or slows launch approval.
What can limit return on investment for buyers?
Satiety Supplements Market payback depends on whether the product supports repeat purchase, price realization, cleaner label positioning; or channel acceptance. Buyers reduce risk by testing taste, stability, claim support; and supply continuity before launch.
How can suppliers build executive confidence?
Satiety Supplements Market suppliers build confidence when they can support formulation work, claim discipline, batch consistency; and post-launch troubleshooting. Brand teams value partners that reduce launch risk, not just ingredient cost.
Preview the report firsthand - request a free sample
Get SampleGet the brochure for pricing and purchase details.
Get PDFTable of Content
- Key Takeaways
- Market Size and CAGR
- Top Growth Driver
- Fastest Growing Segment
- Leading Region
- Key Companies
- Emerging Opportunities
- Executive Summary
- Global Market Outlook
- Demand-side Trends
- Supply-side Trends
- Technology Roadmap Analysis
- Analysis and Recommendations
- Analyst Perspective (What is happening? Why now? What should investors know?)
- Key Questions Answered
- How large is the market?
- What is the CAGR?
- What are key trends?
- Which region dominates?
- Who are the leaders?
- Market Overview
- Market Coverage / Taxonomy
- Market Definition / Scope / Limitations
- Research Methodology
- Chapter Orientation
- Analytical Lens and Working Hypotheses
- Market Structure, Signals, and Trend Drivers
- Benchmarking and Cross-market Comparability
- Market Sizing, Forecasting, and Opportunity Mapping
- Research Design and Evidence Framework
- Desk Research Programme (Secondary Evidence)
- Expert Input and Fieldwork (Primary Evidence)
- Tooling, Models, and Reference Databases
- Data Engineering and Model Build
- Quality Assurance and Audit Trail
- Market Background
- Market Dynamics (Drivers, Restraints, Opportunity, Trends)
- Scenario Forecast (Optimistic, Likely, Conservative)
- Impact Analysis
- AI Impact
- Sustainability Impact
- Regulatory Impact
- Technology Impact
- Consumer / Buyer Analysis
- Purchase Drivers
- Adoption Barriers
- Buyer Journey
- Opportunity Map Analysis
- Product Life Cycle Analysis
- Supply Chain Analysis
- Investment Feasibility Matrix
- Value Chain Analysis
- PESTLE and Porter's Analysis
- Regulatory Landscape
- Regional Parent Market Outlook
- Production and Consumption Statistics
- Import and Export Statistics
- Global Market Analysis and Forecast, 2021 to 2036
- Historical Market Size Value (USD Million) Analysis, 2021 to 2025
- Current and Future Market Size Value (USD Million) Projections, 2026 to 2036
- Y-o-Y Growth Trend Analysis
- Absolute $ Opportunity Analysis
- Global Market Pricing Analysis, 2021 to 2036
- Global Market Analysis and Forecast, By Product Type, 2021 to 2036
- Introduction / Key Findings
- Historical Market Size Value (USD Million) Analysis By Product Type, 2021 to 2025
- Current and Future Market Size Value (USD Million) Analysis and Forecast By Product Type, 2026 to 2036
- powders
- Capsules
- gummies
- tablets
- sachets
- powders
- Y-o-Y Growth Trend Analysis By Product Type, 2021 to 2025
- Absolute $ Opportunity Analysis By Product Type, 2026 to 2036
- Global Market Analysis and Forecast, By Ingredient, 2021 to 2036
- Introduction / Key Findings
- Historical Market Size Value (USD Million) Analysis By Ingredient, 2021 to 2025
- Current and Future Market Size Value (USD Million) Analysis and Forecast By Ingredient, 2026 to 2036
- Glucomannan
- protein
- psyllium
- green tea extract
- chromium
- Glucomannan
- Y-o-Y Growth Trend Analysis By Ingredient, 2021 to 2025
- Absolute $ Opportunity Analysis By Ingredient, 2026 to 2036
- Global Market Analysis and Forecast, By Function, 2021 to 2036
- Introduction / Key Findings
- Historical Market Size Value (USD Million) Analysis By Function, 2021 to 2025
- Current and Future Market Size Value (USD Million) Analysis and Forecast By Function, 2026 to 2036
- Appetite suppression
- calorie reduction
- blood-sugar support
- metabolism
- gut health
- Appetite suppression
- Y-o-Y Growth Trend Analysis By Function, 2021 to 2025
- Absolute $ Opportunity Analysis By Function, 2026 to 2036
- Global Market Analysis and Forecast, By Distribution Channel, 2021 to 2036
- Introduction / Key Findings
- Historical Market Size Value (USD Million) Analysis By Distribution Channel, 2021 to 2025
- Current and Future Market Size Value (USD Million) Analysis and Forecast By Distribution Channel, 2026 to 2036
- Pharmacies
- online retail
- specialty stores
- supermarkets
- direct-to-consumer
- Pharmacies
- Y-o-Y Growth Trend Analysis By Distribution Channel, 2021 to 2025
- Absolute $ Opportunity Analysis By Distribution Channel, 2026 to 2036
- Global Market Analysis and Forecast, By Region, 2021 to 2036
- Introduction
- Historical Market Size Value (USD Million) Analysis By Region, 2021 to 2025
- Current Market Size Value (USD Million) Analysis and Forecast By Region, 2026 to 2036
- North America
- Latin America
- Western Europe
- Eastern Europe
- East Asia
- South Asia and Pacific
- Middle East & Africa
- Market Attractiveness Analysis By Region
- North America Market Analysis and Forecast, By Country, 2021 to 2036
- Historical Market Size Value (USD Million) Trend Analysis By Market Taxonomy, 2021 to 2025
- Market Size Value (USD Million) Forecast By Market Taxonomy, 2026 to 2036
- By Country
- USA
- Canada
- By Product Type
- By Ingredient
- By Function
- By Distribution Channel
- By Country
- Market Attractiveness Analysis
- By Country
- By Product Type
- By Ingredient
- By Function
- By Distribution Channel
- Key Takeaways
- Latin America Market Analysis and Forecast, By Country
- Historical Market Size Value (USD Million) Trend Analysis By Market Taxonomy, 2021 to 2025
- Market Size Value (USD Million) Forecast By Market Taxonomy, 2026 to 2036
- By Country
- Brazil
- Mexico
- Chile
- Rest of Latin America
- By Product Type
- By Ingredient
- By Function
- By Distribution Channel
- By Country
- Market Attractiveness Analysis
- By Country
- By Product Type
- By Ingredient
- By Function
- By Distribution Channel
- Key Takeaways
- Western Europe Market Analysis and Forecast, By Country
- Historical Market Size Value (USD Million) Trend Analysis By Market Taxonomy, 2021 to 2025
- Market Size Value (USD Million) Forecast By Market Taxonomy, 2026 to 2036
- By Country
- Germany
- UK
- Italy
- Spain
- France
- Nordic
- BENELUX
- Rest of Western Europe
- By Product Type
- By Ingredient
- By Function
- By Distribution Channel
- By Country
- Market Attractiveness Analysis
- By Country
- By Product Type
- By Ingredient
- By Function
- By Distribution Channel
- Key Takeaways
- Eastern Europe Market Analysis and Forecast, By Country
- Historical Market Size Value (USD Million) Trend Analysis By Market Taxonomy, 2021 to 2025
- Market Size Value (USD Million) Forecast By Market Taxonomy, 2026 to 2036
- By Country
- Russia
- Poland
- Hungary
- Balkan & Baltic
- Rest of Eastern Europe
- By Product Type
- By Ingredient
- By Function
- By Distribution Channel
- By Country
- Market Attractiveness Analysis
- By Country
- By Product Type
- By Ingredient
- By Function
- By Distribution Channel
- Key Takeaways
- East Asia Market Analysis and Forecast, By Country
- Historical Market Size Value (USD Million) Trend Analysis By Market Taxonomy, 2021 to 2025
- Market Size Value (USD Million) Forecast By Market Taxonomy, 2026 to 2036
- By Country
- China
- Japan
- South Korea
- By Product Type
- By Ingredient
- By Function
- By Distribution Channel
- By Country
- Market Attractiveness Analysis
- By Country
- By Product Type
- By Ingredient
- By Function
- By Distribution Channel
- Key Takeaways
- South Asia and Pacific Market Analysis and Forecast, By Country
- Historical Market Size Value (USD Million) Trend Analysis By Market Taxonomy, 2021 to 2025
- Market Size Value (USD Million) Forecast By Market Taxonomy, 2026 to 2036
- By Country
- India
- ASEAN
- Australia & New Zealand
- Rest of South Asia and Pacific
- By Product Type
- By Ingredient
- By Function
- By Distribution Channel
- By Country
- Market Attractiveness Analysis
- By Country
- By Product Type
- By Ingredient
- By Function
- By Distribution Channel
- Key Takeaways
- Middle East & Africa Market Analysis and Forecast, By Country
- Historical Market Size Value (USD Million) Trend Analysis By Market Taxonomy, 2021 to 2025
- Market Size Value (USD Million) Forecast By Market Taxonomy, 2026 to 2036
- By Country
- Kingdom of Saudi Arabia
- Other GCC Countries
- Türkiye
- South Africa
- Other African Union
- Rest of Middle East & Africa
- By Product Type
- By Ingredient
- By Function
- By Distribution Channel
- By Country
- Market Attractiveness Analysis
- By Country
- By Product Type
- By Ingredient
- By Function
- By Distribution Channel
- Key Takeaways
- Key Countries Market Analysis
- USA
- Pricing Analysis
- Market Share Analysis, 2025
- By Product Type
- By Ingredient
- By Function
- By Distribution Channel
- Canada
- Pricing Analysis
- Market Share Analysis, 2025
- By Product Type
- By Ingredient
- By Function
- By Distribution Channel
- Mexico
- Pricing Analysis
- Market Share Analysis, 2025
- By Product Type
- By Ingredient
- By Function
- By Distribution Channel
- Brazil
- Pricing Analysis
- Market Share Analysis, 2025
- By Product Type
- By Ingredient
- By Function
- By Distribution Channel
- Chile
- Pricing Analysis
- Market Share Analysis, 2025
- By Product Type
- By Ingredient
- By Function
- By Distribution Channel
- Germany
- Pricing Analysis
- Market Share Analysis, 2025
- By Product Type
- By Ingredient
- By Function
- By Distribution Channel
- UK
- Pricing Analysis
- Market Share Analysis, 2025
- By Product Type
- By Ingredient
- By Function
- By Distribution Channel
- Italy
- Pricing Analysis
- Market Share Analysis, 2025
- By Product Type
- By Ingredient
- By Function
- By Distribution Channel
- Spain
- Pricing Analysis
- Market Share Analysis, 2025
- By Product Type
- By Ingredient
- By Function
- By Distribution Channel
- France
- Pricing Analysis
- Market Share Analysis, 2025
- By Product Type
- By Ingredient
- By Function
- By Distribution Channel
- India
- Pricing Analysis
- Market Share Analysis, 2025
- By Product Type
- By Ingredient
- By Function
- By Distribution Channel
- ASEAN
- Pricing Analysis
- Market Share Analysis, 2025
- By Product Type
- By Ingredient
- By Function
- By Distribution Channel
- Australia & New Zealand
- Pricing Analysis
- Market Share Analysis, 2025
- By Product Type
- By Ingredient
- By Function
- By Distribution Channel
- China
- Pricing Analysis
- Market Share Analysis, 2025
- By Product Type
- By Ingredient
- By Function
- By Distribution Channel
- Japan
- Pricing Analysis
- Market Share Analysis, 2025
- By Product Type
- By Ingredient
- By Function
- By Distribution Channel
- South Korea
- Pricing Analysis
- Market Share Analysis, 2025
- By Product Type
- By Ingredient
- By Function
- By Distribution Channel
- Russia
- Pricing Analysis
- Market Share Analysis, 2025
- By Product Type
- By Ingredient
- By Function
- By Distribution Channel
- Poland
- Pricing Analysis
- Market Share Analysis, 2025
- By Product Type
- By Ingredient
- By Function
- By Distribution Channel
- Hungary
- Pricing Analysis
- Market Share Analysis, 2025
- By Product Type
- By Ingredient
- By Function
- By Distribution Channel
- Kingdom of Saudi Arabia
- Pricing Analysis
- Market Share Analysis, 2025
- By Product Type
- By Ingredient
- By Function
- By Distribution Channel
- Türkiye
- Pricing Analysis
- Market Share Analysis, 2025
- By Product Type
- By Ingredient
- By Function
- By Distribution Channel
- South Africa
- Pricing Analysis
- Market Share Analysis, 2025
- By Product Type
- By Ingredient
- By Function
- By Distribution Channel
- USA
- Market Structure Analysis
- Competition Dashboard
- Competition Benchmarking
- Market Share Analysis of Top Players
- By Regional
- By Product Type
- By Ingredient
- By Function
- By Distribution Channel
- Emerging Startups
- Innovation Benchmarking
- Competition Analysis
- Competition Deep Dive
- Nestle
- Overview
- Product Portfolio
- Profitability by Market Segments
- Sales Footprint
- Strategy Overview
- Marketing Strategy
- Product Strategy
- Channel Strategy
- Abbott
- Herbalife
- Glanbia
- GNC
- Amway
- Mars
- Roquette
- Ingredion
- Beneo
- Nestle
- Case Studies
- Success Stories
- Recent Developments
- Competition Deep Dive
- Assumptions & Acronyms Used


