

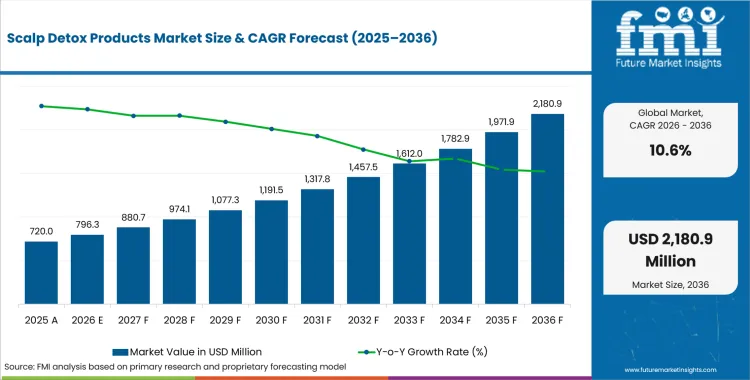
- Market Size (2026)
- USD 796.3 Mn
- Forecast (2036)
- USD 2180.9 Mn
- CAGR (2026 to 2036)
- 10.6%
How big is the Scalp Detox Products Market in 2026?
USD 796.3 million in 2026 and USD 2,180.9 million by 2036 at a 10.6% CAGR.
Demand for scalp detox products exists because buyers need the product to perform inside a real operating workflow, beyond a trend label. FDA cosmetics and MoCRA resources place compliance or claim evidence close to launch decisions, while European Commission SCCS opinions keep quality and safety expectations visible. ECHA and OECD chemicalsafety references add the country and standards context that procurement teams use when they compare suppliers, so scalp detox products suppliers need documented performance before accounts scale.
The commercial opportunity is clearest where scalp detox products reduces a specific pain point for beauty brands, retailers, formulators and packaging teams. Accounts are expected to compare SKU economics, supplier service and proof of skin-contact safety, use precision, ingredient review and repeat-purchase proof before volume moves from trial runs to recurring purchase orders.
Country demand will not develop evenly. India shows the higher CAGR reference in the model, while Rest of World remains an important value pool because larger buyers ask for stricter evidence before switching formats, materials or suppliers.
Key Takeaways
-
Demand for scalp detox products is driven by beauty brands and retailers screening formulations against skin-contact safety, use precision, and ingredient review, with FDA/MoCRA and SCCS opinions shaping the buyer evidence file.
-
By product type, scalp scrubs are expected to lead with 33.1% share in 2026, reflecting how scrub formats change skin feel, use precision, and hygiene perception.
-
Buildup is the dominant concern segment, projected to hold 31.5% share in 2026, driven by consumer focus on visible residue removal and scalp cleansing outcomes.
-
Salicylic acid is estimated to lead the formulation category with 29.6% share in 2026, tied to its established role in exfoliation and scalp-clarifying claims.
-
Supermarkets/hypermarkets are anticipated to lead the distribution channel segment with 33.8% share in 2026, shaping trial frequency and hygiene perception at shelf.
-
India is expected to post the strongest growth at 9.6% CAGR through 2036, with China also rewarding suppliers that localize specifications for price-tiered programs, while Germany, Japan, and the United Kingdom move through slower, documentation-led reviews.
-
Competition centers on L'Oreal, Procter & Gamble, and Unilever alongside specialist suppliers, with vendors differentiating through skin-contact evidence, material fit, and retail documentation support.
Analyst Perspective
"The scalp detox products market is becoming increasingly evidence-driven as brands and retailers seek solutions that deliver consistent consumer results while meeting quality and compliance expectations. Commercial success depends on suppliers that can support performance claims with robust product documentation, reliable manufacturing standards, and responsive technical service. Those that combine category expertise with dependable supply execution are likely to earn stronger brand partnerships as the market matures."
- Rahul Pandita, Principal Analyst at Future Market Insights
How is the Scalp Detox Products Market segmented?
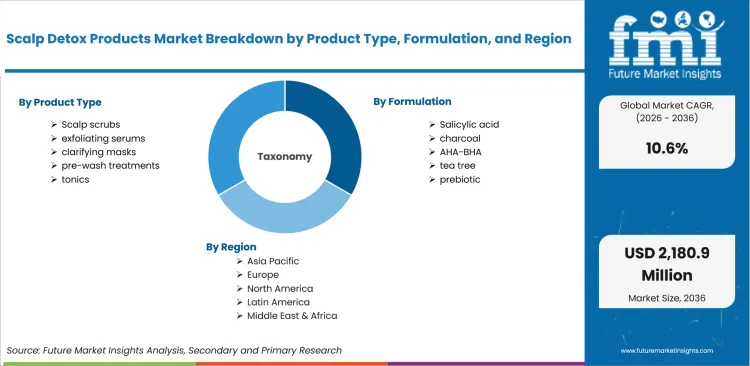
The scalp detox products market industry is segmented by Product Type, Formulation, Concern, Distribution Channel and Region.
By Product Type, the market covers scalp scrubs, exfoliating serums, clarifying masks, pre-wash treatments, and tonics. By Formulation, it spans salicylic acid, charcoal, AHA/BHA, tea tree, and prebiotic-based systems. By Concern, coverage includes buildup, oiliness, flaking, sensitivity, and density support. By Distribution Channel, the market is assessed across supermarkets/hypermarkets, convenience stores, drug stores/pharmacies, e-commerce, and specialty retail. Regional coverage spans North America, Latin America, Europe, East Asia, South Asia and Pacific, and Middle East and Africa.
How does Scalp scrubs shape demand within the product type category?
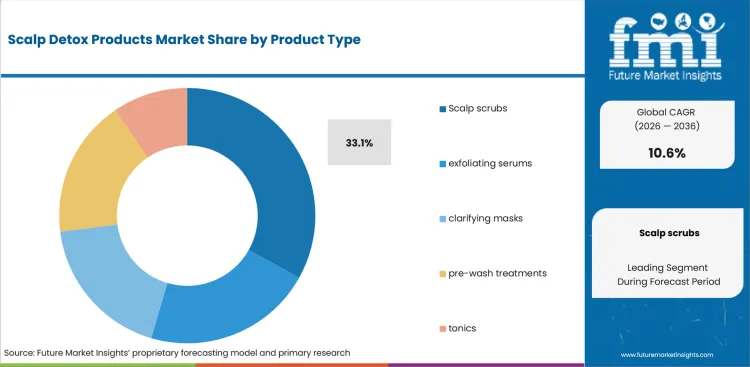
Scalp scrubs occupy the entry point of most detox routines because the format delivers a visible, tactile result within a single use: loosened buildup and a lighter scalp feel. That immediate payoff shortens the trust building period newer formats such as serums or tonics typically need, since users don't have to wait several washes to judge whether the product is working. For many first time buyers, a scrub also feels closer to a familiar exfoliation ritual borrowed from skincare, which lowers the hesitation that comes with trying an unfamiliar format.
- Scalp scrubs are estimated to hold 33.1% share in 2026, with exfoliation and abrasive particle safety claims commonly substantiated against FDA cosmetics/MoCRA documentation and European Commission SCCS opinions.
- Scrubs set the sensory benchmark, including grit level, rinse off ease, and fragrance carryover, that other formats in the category get measured against, so brands able to document that profile clearly tend to expand retail placement with less fric
What supports Salicylic acid purchasing within formulation?
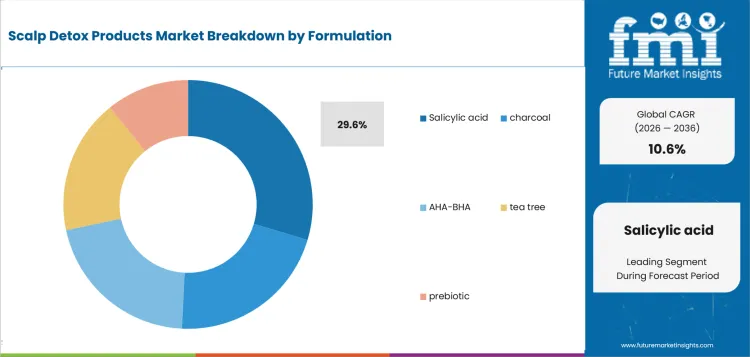
Salicylic acid's position rests on its dual identity as both a cosmetic exfoliant and a dermatologically recognized keratolytic, which gives it credibility with consumers managing flaking or buildup as a recurring issue rather than a one-off concern. That recognition lets brands position salicylic acid formulas closer to a treatment than a cosmetic add-on, which supports a higher price point and repeat purchase behavior. It also gives brands a clearer story to tell around efficacy, since the ingredient already carries meaning from skincare use.
- Salicylic acid is estimated to hold 29.6% share in 2026, with concentration and labeling guidance shaped by FDA cosmetics/MoCRA materials and SCCS opinions on beta hydroxy acids.
- Formulas built around this active carry more usage instruction weight than milder alternatives, making clear frequency and patch test guidance part of the product's credibility rather than an afterthought.
Where does Buildup fit in the concern mix?
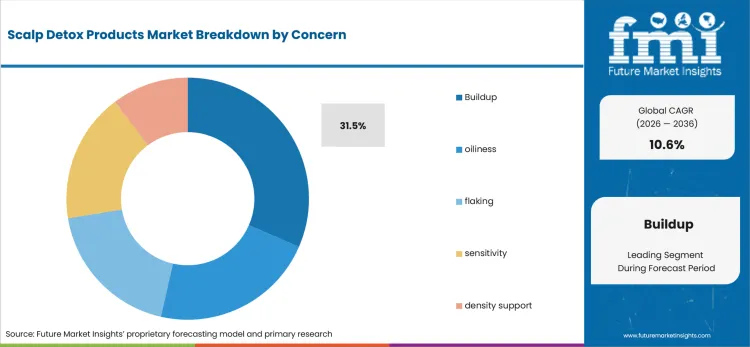
Buildup is the concern most consumers can self diagnose without a professional opinion, since visible residue, flattened roots, or a heavier wash day are enough to prompt a purchase. That self diagnosis shortens the path from noticing a problem to buying a solution, compared with concerns like sensitivity that often involve more hesitation or a dermatologist's input first. Because the problem is visible and the fix is immediate, buildup also tends to drive faster repeat purchase once a product proves it works.
- Buildup is estimated to hold 31.5% share in 2026, with clarifying actives such as charcoal and clay derivatives substantiated through FDA cosmetics/MoCRA disclosure norms and related SCCS opinions.
- Buildup focused products can lean on before and after visual proof more than other concerns, since the result is externally observable rather than a subjective sensation like itch or tightness.
Why is Supermarkets/hypermarkets important to buyer screening in distribution channel?
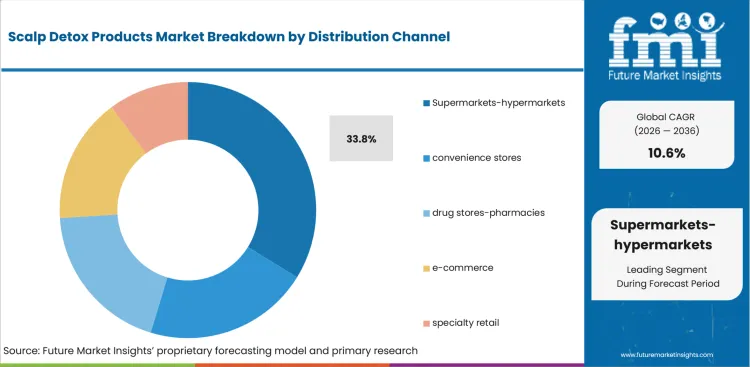
Supermarkets and hypermarkets benefit from placing scalp detox products in the same aisle as everyday shampoo and conditioner, which turns the category into an add on decision rather than a destination purchase. That adjacency matters because scalp detox is still an emerging habit for many shoppers, not yet a planned trip on its own. Placement near familiar hair care staples also helps new buyers trust an unfamiliar product category faster than they would in a standalone specialty setting.
- Supermarkets/hypermarkets are estimated to hold 33.8% share in 2026, with shelf listing decisions informed by FDA cosmetics/MoCRA labeling rules and SCCS opinions on active ingredient thresholds.
- Brands in this channel need packaging and claims that hold up to shelf level scrutiny without an in store consultant to explain the product, unlike specialty retail where staff can guide the sale.
What are the drivers, restraints, and opportunities in the Scalp Detox Products Market?
Near-term purchases are being shaped by the operating requirement, implementation constraint and account-expansion route outlined below.
- Driver: Beauty buyers are using scalp detox products to make hygiene, application control or convenience visible at the product level.
- Restraint: Adoption can pause when scalp detox products formats raise skin-contact, claims, material or disposal questions during retailer review.
- Opportunity: Suppliers that connect material safety with practical use testing can earn earlier specification access for scalp detox products.
Demand for scalp detox products is tied to a specific buyer problem: skin-contact safety, use precision, ingredient review and repeat-purchase proof. This is why account teams ask for evidence at the SKU, format or application level rather than accepting category growth as proof.
Buyer pressure is strongest where scalp detox products touches claims, product safety, shipment performance, GMP files or retailer scorecards. FDA cosmetics and MoCRA resources, European Commission SCCS opinions and ECHA and OECD chemicalsafety references make those checks visible across national and cross-border programs.
Implementation friction sits in the handoff between product teams, quality managers and channel owners. Suppliers that answer questions on specifications, test results and service response before launch discussions move faster through buyer review.
Which country CAGRs are profiled in the Scalp Detox Products Market?
.webp "Top Country Growth Comparison Scalp Detox Products Market Cagr (2026 2036)")
| Country | CAGR |
|---|---|
| United States | 6.8% |
| China | 8.2% |
| India | 9.6% |
| Germany | 5.9% |
| United Kingdom | 6.3% |
| Japan | 5.1% |
| South Korea | 6.6% |
Source: FMI's proprietary forecasting model and primary research.
How do country-level CAGRs compare in the Scalp Detox Products Market?
Country growth should be read as a buying-cycle signal, not a simple ranking. For scalp detox products, higher CAGR markets usually show faster channel formation or material substitution, while larger 2026 value pools such as Rest of World often require stricter proof before suppliers win recurring accounts.
- United States is projected at 6.8% CAGR through 2036. The country is modeled at USD 215.0 Mn in 2026 and USD 415.1 Mn by 2036. FDA MoCRA resources keep cosmetics listing and safety files visible. Buyers use national accounts to test scalp detox products shelf economics before broader rollouts. For scalp detox products skin-contact and use-experience proof, the United States differs because retailer and regulator-facing reviews come earlier in the launch cycle.
- China is projected at 8.2% CAGR through 2036. The country is modeled at USD 111.5 Mn in 2026 and USD 245.2 Mn by 2036. National statistics and customs signals point to large manufacturing and retail conversion pools. Local suppliers need scalp detox products formats that can handle high-volume platform and brand programs. For scalp detox products skin-contact and use-experience proof, China differs because factory scale and platform selling can expose small specification failures quickly.
- India is projected at 9.6% CAGR through 2036. The country is modeled at USD 35.8 Mn in 2026 and USD 89.6 Mn by 2036. official industrial and e-commerce indicators keep regional scale-up visible. Price-tiered buyers need scalp detox products specifications that work across modern trade, pharmacy or online fulfillment without adding avoidable cost. For scalp detox products skin-contact and use-experience proof, India differs because affordability and distribution reach decide whether a specification can survive outside metro accounts.
- Germany is projected at 5.9% CAGR through 2036. The country is modeled at USD 63.7 Mn in 2026 and USD 113.0 Mn by 2036. ECHA and EU product rules make ingredient documentation central. Engineering or category teams review scalp detox products against EU documentation, material or ingredient files before switching approved suppliers. For scalp detox products skin-contact and use-experience proof, Germany differs because EU compliance records carry more weight before supplier substitution.
- United Kingdom is projected at 6.3% CAGR through 2036. The country is modeled at USD 51.8 Mn in 2026 and USD 95.4 Mn by 2036. ONS and UK regulator references keep retail-channel and import discipline visible. Retailer scorecards make scalp detox products availability, pack claims and import continuity part of the buying decision. For scalp detox products skin-contact and use-experience proof, the United Kingdom differs because importer reliance and retailer scorecards make pack claims and supply assurance visible.
- Japan is projected at 5.1% CAGR through 2036. The country is modeled at USD 55.7 Mn in 2026 and USD 91.7 Mn by 2036. MHLW, METI and official trade indicators keep quality and audit expectations visible. Buyers place more weight on compact formats, consistency checks and low-defect presentation for scalp detox products. For scalp detox products skin-contact and use-experience proof, Japan differs because low-defect presentation and compact usage matter more than speed of listing.
- South Korea is projected at 6.6% CAGR through 2036. The country is modeled at USD 47.8 Mn in 2026 and USD 90.5 Mn by 2036. MFDS, MOTIE and Statistics Korea references keep export-oriented product cycles visible. Short product cycles reward suppliers that can adjust scalp detox products packaging, claims or specifications quickly. For scalp detox products skin-contact and use-experience proof, South Korea differs because rapid product refresh cycles favor suppliers that shorten sampling and approval loops.
Who are the notable companies in the Scalp Detox Products Market?
L'Oreal, Procter & Gamble, Unilever, Henkel, Kao, Kenvue, Shiseido and Church & Dwight are the notable companies shaping this market.
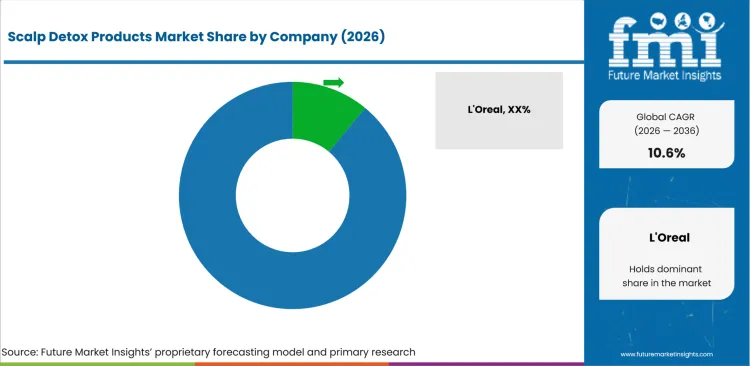
Competition is organized around skin-contact evidence, material fit, brand execution and retail documentation. Buyers compare suppliers on whether they can translate product claims into repeatable specifications, then support the account after launch.
- Personal-care multinationals matter because L'Oreal, Procter & Gamble and Unilever bring account access, portfolio breadth or specialist support for scalp detox products. Their role is clearest where buyers want fewer supplier handoffs during qualification, listing or fulfillment review.
- Beauty and skin-care brand owners matter because Henkel, Kao and Kenvue bring account access, portfolio breadth or specialist support for scalp detox products. Their role is clearest where buyers want fewer supplier handoffs during qualification, listing or fulfillment review.
- Format and application specialists matter because Shiseido and Church & Dwight bring account access, portfolio breadth or specialist support for scalp detox products. Their role is clearest where buyers want fewer supplier handoffs during qualification, listing or fulfillment review.
Competitive Benchmarking: Scalp Detox Products Market
| Company | Portfolio Relevance | Format Fit | Application Support | Service Reach |
|---|---|---|---|---|
| L'Oreal | Medium | High | Medium | Global |
| Procter & Gamble | Strong | High | Strong | Global |
| Unilever | Medium | High | Strong | Global |
| Henkel | High | Medium | Strong | Global |
| Kao | High | Medium | Medium | Multi-region |
| Kenvue | High | Medium | High | Multi-region |
| Shiseido | High | Strong | High | Multi-region |
| Church & Dwight | High | Strong | Strong | Multi-region |
Source: Future Market Insights competitive analysis, 2026. Ratings reflect relative portfolio relevance, workflow or project fit, service capability, and geographic reach.
Key Developments in the Scalp Detox Products Market
- In 2026, FDA updated MoCRA resources covering cosmetic facility registration and product listing requirements. For scalp detox products, responsible persons need ingredient and facility records ready before product scale-up.
- FDA began publishing summary data on cosmetic product facility registrations and product listings in March 2025. The publication keeps documentation discipline visible for scalp detox products suppliers selling to national beauty accounts.
- FDA updated guidance for cosmetic product facility registration and product listing in December 2024. The guidance keeps scalp detox products launches tied to who submits, what is submitted and when listing records must be updated.
Key Players in the Scalp Detox Products Market
Personal-care multinationals
- L'Oreal
- Procter & Gamble
- Unilever
Beauty and skin-care brand owners
- Henkel
- Kao
- Kenvue
Format and application specialists
- Shiseido
- Church & Dwight
Scalp Detox Products Market - Report Scope
| Coverage field | Report scope |
|---|---|
| Market breakdown | Scalp Detox Products Market Breakdown By Product Type, Formulation, Concern, Distribution Channel and Region |
| Market Definition | Scalp Detox Products products include cosmetic, personal-care or applicator formats designed to improve use precision, hygiene, preparation or post-use handling in daily routines. |
| Regions Covered | North America, Latin America, Europe, East Asia, South Asia and Pacific, and Middle East and Africa |
| Countries Covered | United States, China, India, Germany, United Kingdom, Japan, South Korea, Rest of World and 30+ countries |
| Key Companies Profiled | L'Oreal, Procter & Gamble, Unilever, Henkel, Kao, Kenvue, Shiseido and Church & Dwight |
| Forecast Period | 2026 to 2036 |
| Approach | Hybrid bottom-up and top-down methodology using segment share, country growth, skin-contact safety, use precision, ingredient review and repeat-purchase proof, supplier portfolio depth and channel exposure |
Scalp Detox Products Market - Research Methodology
| Method | Approach |
|---|---|
| Primary Research | FMI analysts gathered input from manufacturers, service providers, technology developers, distributors, end users, procurement teams, and subject-matter experts. Interviews examined purchasing decisions, product or service evaluation, adoption barriers, approval requirements, pricing considerations, and expectations for technical or commercial support. Respondents were also asked what evidence is required before a trial, pilot, or initial order develops into regular purchasing. |
| Desk Research | Desk research covered government statistics, regulatory publications, trade data, industry associations, technical literature, standards, company filings, product information, and official corporate announcements. Sources were reviewed for relevance, publication date, geographic coverage, and consistency with the defined market scope. Claims relating to performance, applications, approvals, capacity, investment, and commercial activity were retained only when supported by credible public evidence. |
| Market Sizing and Forecasting | The market model combined the baseline value with historical performance, segment structure, pricing and volume indicators, adoption levels, company participation, and country-level demand conditions. Forecast assumptions considered economic activity, investment trends, regulatory developments, technology adoption, purchasing cycles, supply availability, and barriers to wider market use. Segment and regional estimates were reconciled before the final market total was calculated. |
| Data Validation | Estimates were checked against multiple independent indicators, including public data, company activity, trade patterns, industry developments, and findings from primary interviews. Validation also tested whether products, services, applications, and company revenues fell within the defined market boundaries. Adjacent categories, unsupported claims, overlapping revenues, and activities without direct market relevance were excluded to reduce double counting and maintain consistency across segments and countries. |
Source: Future Market Insights (FMI) analysis, based on proprietary forecasting model and primary research.
Scalp Detox Products Market by Segments
Scalp Detox Products Market segmented by Product Type:
- Scalp scrubs
- exfoliating serums
- clarifying masks
- pre-wash treatments
- tonics
Scalp Detox Products Market segmented by Formulation:
- Salicylic acid
- charcoal
- AHA/BHA
- tea tree
- prebiotic
Scalp Detox Products Market segmented by Concern:
- Buildup
- oiliness
- flaking
- sensitivity
- density support
Scalp Detox Products Market segmented by Distribution Channel:
- Supermarkets/hypermarkets
- convenience stores
- drug stores/pharmacies
- e-commerce
- specialty retail
Scalp Detox Products Market segmented by Region:
- North America
- Europe
- East Asia
- South Asia
- Latin America
Research Sources and Bibliography
- USA Food and Drug Administration. Cosmetics and MoCRA resources.
- European Commission Scientific Committee on Consumer Safety. Cosmetic ingredient opinions.
- European Chemicals Agency. Chemicalsafety and restriction information.
- Organisation for Economic Co-operation and Development. Chemicalsafety resources.
- Future Market Insights. Proprietary forecasting model and primary research, 2026.
This bibliography is provided for reader reference and uses primary government, standards-body, official trade body and company sources.
This Report Answers
- What value is the scalp detox products market estimated at in 2026 and forecast to reach by 2036?
- What CAGR is expected for the scalp detox products market from 2026 to 2036?
- Which segments shape demand across Product Type, Formulation, Concern, Distribution Channel and Region?
- Which operating pressures support purchase activity among beauty brands, retailers, formulators and packaging teams?
- How do country CAGRs differ across the profiled markets?
- Which companies compete across portfolio relevance, application support and service reach?
- How does FMI validate forecasts using a hybrid bottom-up and top-down approach?
- What factors should category, procurement or engineering teams address before broader account expansion?
- How do claims review, documentation and performance evidence affect supplier selection?
- What limits return on investment for buyers adding scalp detox products to their portfolio or operation?
Frequently Asked Questions
What is driving growth in the Scalp Detox Products Market?
Growth is expected to be driven by scalp cleansing routines and stricter claim review. Retail category teams are projected to favor evidence-backed formats.
Who are the key players in the Scalp Detox Products Market?
Key players include L’Oréal and Procter & Gamble with Unilever, Henkel, Kao, Kenvue, Shiseido and Church & Dwight. Competition is projected to center on scalp proof and retail execution.
What is a significant restraint in the Scalp Detox Products Market?
A significant restraint is the proof burden around safety files and scalp claims. Adoption is anticipated to slow when claim support remains thin.
Why should executives track the Scalp Detox Products Market?
Executives should track this market because scalp care is moving from basic cleansing into targeted routines focused on buildup removal, oil control and scalp comfort. Growth is being supported by beauty e-commerce, mass retail replenishment and evidence-backed product claims.
What business problem does the Scalp Detox Products Market address?
The market addresses the need for products that help consumers manage scalp buildup, oiliness and residue from styling routines without shifting into medical treatment claims. It gives brands a way to add a visible scalp reset step within existing hair-care routines.
What should procurement leaders evaluate before selecting suppliers?
Procurement leaders should evaluate ingredient safety, claim substantiation, scalp-comfort testing and regulatory compliance across target markets. They should also assess manufacturing consistency, packaging clarity and complaint-handling support before supplier selection.
What can limit return on investment for buyers?
Return on investment can be limited by weak claim support, irritation complaints, poor rinse feel or low repeat purchase after initial trial. Inconsistent texture, unclear usage instructions and overextended scalp claims can also reduce long-term commercial success.
How can suppliers build executive confidence?
Suppliers can build confidence by providing substantiated scalp-care claims, clear ingredient documentation and consistent product performance across production batches. Strong retailer support, reliable fulfillment and complaint-monitoring processes also strengthen buyer trust.
Preview the report firsthand - request a free sample
Get SampleGet the brochure for pricing and purchase details.
Get PDFTable of Content
- Key Takeaways
- Market Size and CAGR
- Top Growth Driver
- Fastest Growing Segment
- Leading Region
- Key Companies
- Emerging Opportunities
- Executive Summary
- Global Market Outlook
- Demand-side Trends
- Supply-side Trends
- Technology Roadmap Analysis
- Analysis and Recommendations
- Analyst Perspective (What is happening? Why now? What should investors know?)
- Key Questions Answered
- How large is the market?
- What is the CAGR?
- What are key trends?
- Which region dominates?
- Who are the leaders?
- Market Overview
- Market Coverage / Taxonomy
- Market Definition / Scope / Limitations
- Research Methodology
- Chapter Orientation
- Analytical Lens and Working Hypotheses
- Market Structure, Signals, and Trend Drivers
- Benchmarking and Cross-market Comparability
- Market Sizing, Forecasting, and Opportunity Mapping
- Research Design and Evidence Framework
- Desk Research Programme (Secondary Evidence)
- Expert Input and Fieldwork (Primary Evidence)
- Tooling, Models, and Reference Databases
- Data Engineering and Model Build
- Quality Assurance and Audit Trail
- Market Background
- Market Dynamics (Drivers, Restraints, Opportunity, Trends)
- Scenario Forecast (Optimistic, Likely, Conservative)
- Impact Analysis
- AI Impact
- Sustainability Impact
- Regulatory Impact
- Technology Impact
- Consumer / Buyer Analysis
- Purchase Drivers
- Adoption Barriers
- Buyer Journey
- Opportunity Map Analysis
- Product Life Cycle Analysis
- Supply Chain Analysis
- Investment Feasibility Matrix
- Value Chain Analysis
- PESTLE and Porter's Analysis
- Regulatory Landscape
- Regional Parent Market Outlook
- Production and Consumption Statistics
- Import and Export Statistics
- Global Market Analysis and Forecast, 2021 to 2036
- Historical Market Size Value (USD Million) Analysis, 2021 to 2025
- Current and Future Market Size Value (USD Million) Projections, 2026 to 2036
- Y-o-Y Growth Trend Analysis
- Absolute $ Opportunity Analysis
- Global Market Pricing Analysis, 2021 to 2036
- Global Market Analysis and Forecast, By Product Type, 2021 to 2036
- Introduction / Key Findings
- Historical Market Size Value (USD Million) Analysis By Product Type, 2021 to 2025
- Current and Future Market Size Value (USD Million) Analysis and Forecast By Product Type, 2026 to 2036
- Scalp scrubs
- exfoliating serums
- clarifying masks
- pre-wash treatments
- tonics
- Scalp scrubs
- Y-o-Y Growth Trend Analysis By Product Type, 2021 to 2025
- Absolute $ Opportunity Analysis By Product Type, 2026 to 2036
- Global Market Analysis and Forecast, By Formulation, 2021 to 2036
- Introduction / Key Findings
- Historical Market Size Value (USD Million) Analysis By Formulation, 2021 to 2025
- Current and Future Market Size Value (USD Million) Analysis and Forecast By Formulation, 2026 to 2036
- Salicylic acid
- charcoal
- AHA-BHA
- tea tree
- prebiotic
- Salicylic acid
- Y-o-Y Growth Trend Analysis By Formulation, 2021 to 2025
- Absolute $ Opportunity Analysis By Formulation, 2026 to 2036
- Global Market Analysis and Forecast, By Concern, 2021 to 2036
- Introduction / Key Findings
- Historical Market Size Value (USD Million) Analysis By Concern, 2021 to 2025
- Current and Future Market Size Value (USD Million) Analysis and Forecast By Concern, 2026 to 2036
- Buildup
- oiliness
- flaking
- sensitivity
- density support
- Buildup
- Y-o-Y Growth Trend Analysis By Concern, 2021 to 2025
- Absolute $ Opportunity Analysis By Concern, 2026 to 2036
- Global Market Analysis and Forecast, By Distribution Channel, 2021 to 2036
- Introduction / Key Findings
- Historical Market Size Value (USD Million) Analysis By Distribution Channel, 2021 to 2025
- Current and Future Market Size Value (USD Million) Analysis and Forecast By Distribution Channel, 2026 to 2036
- Supermarkets-hypermarkets
- convenience stores
- drug stores-pharmacies
- e-commerce
- specialty retail
- Supermarkets-hypermarkets
- Y-o-Y Growth Trend Analysis By Distribution Channel, 2021 to 2025
- Absolute $ Opportunity Analysis By Distribution Channel, 2026 to 2036
- Global Market Analysis and Forecast, By Region, 2021 to 2036
- Introduction
- Historical Market Size Value (USD Million) Analysis By Region, 2021 to 2025
- Current Market Size Value (USD Million) Analysis and Forecast By Region, 2026 to 2036
- North America
- Latin America
- Western Europe
- Eastern Europe
- East Asia
- South Asia and Pacific
- Middle East & Africa
- Market Attractiveness Analysis By Region
- North America Market Analysis and Forecast, By Country, 2021 to 2036
- Historical Market Size Value (USD Million) Trend Analysis By Market Taxonomy, 2021 to 2025
- Market Size Value (USD Million) Forecast By Market Taxonomy, 2026 to 2036
- By Country
- USA
- Canada
- By Product Type
- By Formulation
- By Concern
- By Distribution Channel
- By Country
- Market Attractiveness Analysis
- By Country
- By Product Type
- By Formulation
- By Concern
- By Distribution Channel
- Key Takeaways
- Latin America Market Analysis and Forecast, By Country
- Historical Market Size Value (USD Million) Trend Analysis By Market Taxonomy, 2021 to 2025
- Market Size Value (USD Million) Forecast By Market Taxonomy, 2026 to 2036
- By Country
- Brazil
- Mexico
- Chile
- Rest of Latin America
- By Product Type
- By Formulation
- By Concern
- By Distribution Channel
- By Country
- Market Attractiveness Analysis
- By Country
- By Product Type
- By Formulation
- By Concern
- By Distribution Channel
- Key Takeaways
- Western Europe Market Analysis and Forecast, By Country
- Historical Market Size Value (USD Million) Trend Analysis By Market Taxonomy, 2021 to 2025
- Market Size Value (USD Million) Forecast By Market Taxonomy, 2026 to 2036
- By Country
- Germany
- UK
- Italy
- Spain
- France
- Nordic
- BENELUX
- Rest of Western Europe
- By Product Type
- By Formulation
- By Concern
- By Distribution Channel
- By Country
- Market Attractiveness Analysis
- By Country
- By Product Type
- By Formulation
- By Concern
- By Distribution Channel
- Key Takeaways
- Eastern Europe Market Analysis and Forecast, By Country
- Historical Market Size Value (USD Million) Trend Analysis By Market Taxonomy, 2021 to 2025
- Market Size Value (USD Million) Forecast By Market Taxonomy, 2026 to 2036
- By Country
- Russia
- Poland
- Hungary
- Balkan & Baltic
- Rest of Eastern Europe
- By Product Type
- By Formulation
- By Concern
- By Distribution Channel
- By Country
- Market Attractiveness Analysis
- By Country
- By Product Type
- By Formulation
- By Concern
- By Distribution Channel
- Key Takeaways
- East Asia Market Analysis and Forecast, By Country
- Historical Market Size Value (USD Million) Trend Analysis By Market Taxonomy, 2021 to 2025
- Market Size Value (USD Million) Forecast By Market Taxonomy, 2026 to 2036
- By Country
- China
- Japan
- South Korea
- By Product Type
- By Formulation
- By Concern
- By Distribution Channel
- By Country
- Market Attractiveness Analysis
- By Country
- By Product Type
- By Formulation
- By Concern
- By Distribution Channel
- Key Takeaways
- South Asia and Pacific Market Analysis and Forecast, By Country
- Historical Market Size Value (USD Million) Trend Analysis By Market Taxonomy, 2021 to 2025
- Market Size Value (USD Million) Forecast By Market Taxonomy, 2026 to 2036
- By Country
- India
- ASEAN
- Australia & New Zealand
- Rest of South Asia and Pacific
- By Product Type
- By Formulation
- By Concern
- By Distribution Channel
- By Country
- Market Attractiveness Analysis
- By Country
- By Product Type
- By Formulation
- By Concern
- By Distribution Channel
- Key Takeaways
- Middle East & Africa Market Analysis and Forecast, By Country
- Historical Market Size Value (USD Million) Trend Analysis By Market Taxonomy, 2021 to 2025
- Market Size Value (USD Million) Forecast By Market Taxonomy, 2026 to 2036
- By Country
- Kingdom of Saudi Arabia
- Other GCC Countries
- Türkiye
- South Africa
- Other African Union
- Rest of Middle East & Africa
- By Product Type
- By Formulation
- By Concern
- By Distribution Channel
- By Country
- Market Attractiveness Analysis
- By Country
- By Product Type
- By Formulation
- By Concern
- By Distribution Channel
- Key Takeaways
- Key Countries Market Analysis
- USA
- Pricing Analysis
- Market Share Analysis, 2025
- By Product Type
- By Formulation
- By Concern
- By Distribution Channel
- Canada
- Pricing Analysis
- Market Share Analysis, 2025
- By Product Type
- By Formulation
- By Concern
- By Distribution Channel
- Mexico
- Pricing Analysis
- Market Share Analysis, 2025
- By Product Type
- By Formulation
- By Concern
- By Distribution Channel
- Brazil
- Pricing Analysis
- Market Share Analysis, 2025
- By Product Type
- By Formulation
- By Concern
- By Distribution Channel
- Chile
- Pricing Analysis
- Market Share Analysis, 2025
- By Product Type
- By Formulation
- By Concern
- By Distribution Channel
- Germany
- Pricing Analysis
- Market Share Analysis, 2025
- By Product Type
- By Formulation
- By Concern
- By Distribution Channel
- UK
- Pricing Analysis
- Market Share Analysis, 2025
- By Product Type
- By Formulation
- By Concern
- By Distribution Channel
- Italy
- Pricing Analysis
- Market Share Analysis, 2025
- By Product Type
- By Formulation
- By Concern
- By Distribution Channel
- Spain
- Pricing Analysis
- Market Share Analysis, 2025
- By Product Type
- By Formulation
- By Concern
- By Distribution Channel
- France
- Pricing Analysis
- Market Share Analysis, 2025
- By Product Type
- By Formulation
- By Concern
- By Distribution Channel
- India
- Pricing Analysis
- Market Share Analysis, 2025
- By Product Type
- By Formulation
- By Concern
- By Distribution Channel
- ASEAN
- Pricing Analysis
- Market Share Analysis, 2025
- By Product Type
- By Formulation
- By Concern
- By Distribution Channel
- Australia & New Zealand
- Pricing Analysis
- Market Share Analysis, 2025
- By Product Type
- By Formulation
- By Concern
- By Distribution Channel
- China
- Pricing Analysis
- Market Share Analysis, 2025
- By Product Type
- By Formulation
- By Concern
- By Distribution Channel
- Japan
- Pricing Analysis
- Market Share Analysis, 2025
- By Product Type
- By Formulation
- By Concern
- By Distribution Channel
- South Korea
- Pricing Analysis
- Market Share Analysis, 2025
- By Product Type
- By Formulation
- By Concern
- By Distribution Channel
- Russia
- Pricing Analysis
- Market Share Analysis, 2025
- By Product Type
- By Formulation
- By Concern
- By Distribution Channel
- Poland
- Pricing Analysis
- Market Share Analysis, 2025
- By Product Type
- By Formulation
- By Concern
- By Distribution Channel
- Hungary
- Pricing Analysis
- Market Share Analysis, 2025
- By Product Type
- By Formulation
- By Concern
- By Distribution Channel
- Kingdom of Saudi Arabia
- Pricing Analysis
- Market Share Analysis, 2025
- By Product Type
- By Formulation
- By Concern
- By Distribution Channel
- Türkiye
- Pricing Analysis
- Market Share Analysis, 2025
- By Product Type
- By Formulation
- By Concern
- By Distribution Channel
- South Africa
- Pricing Analysis
- Market Share Analysis, 2025
- By Product Type
- By Formulation
- By Concern
- By Distribution Channel
- USA
- Market Structure Analysis
- Competition Dashboard
- Competition Benchmarking
- Market Share Analysis of Top Players
- By Regional
- By Product Type
- By Formulation
- By Concern
- By Distribution Channel
- Emerging Startups
- Innovation Benchmarking
- Competition Analysis
- Competition Deep Dive
- L'Oreal
- Overview
- Product Portfolio
- Profitability by Market Segments
- Sales Footprint
- Strategy Overview
- Marketing Strategy
- Product Strategy
- Channel Strategy
- Procter & Gamble
- Unilever
- Henkel
- Kao
- Kenvue
- Shiseido
- Church & Dwight
- L'Oreal
- Case Studies
- Success Stories
- Recent Developments
- Competition Deep Dive
- Assumptions & Acronyms Used


