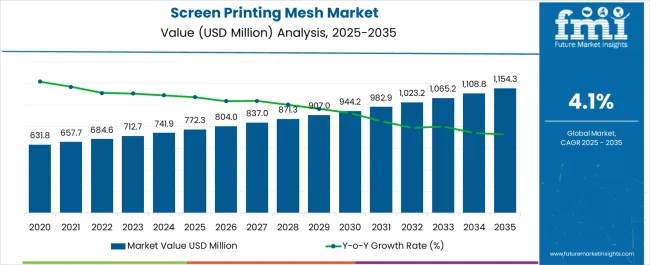
The global Screen Printing Mesh Market is predicted to register a CAGR of 4.10% during the forecast period. The global market is anticipated to secure a valuation of USD 712.7 million in 2023 and reach USD 1,134.2 million by 2033.
The adoption of mesh screen printing is widely rising among various end-use industries such as electrical, packaging, ceramics, and electronics are driving the market revenue.
The surging demand for optimal printing method for electronic gadgets are booming the global market size. Glass manufacturers are increasing the adoption of screen printing mesh to raise the demand for printed glass or decorated glass among consumers.
Manufacturers are offering efficient and durable screen printing for decoration purposes and are increasing the adoption of screen printing mesh.
Increasing printing of mesh materials used for fabric print is eye-catching for beautiful printing designs in the textile sector, which is gaining immense popularity. Manufacturers offer polyester screen printing technologies in the textile industry to strengthen the cloth without affecting or upsurging the market growth.
On the other hand, construction and architecture sectors are choosing advanced and cutting-edge technologies to reduce additional costs of printing methods and capture end users' needs.
Manufacturers prefer high printing technologies such as hybrid printing, offset printing, and digital printing with low volume output are capturing huge market share. In developing countries, the expanding unorganized manufacturing industry accepts advanced printing technologies to gain vast revenue in the global screen printing mesh market.
Key companies are advertising their products to reach more audiences through banners and posters, increasing the adoption of versatile screen printing mesh.
Manufacturers offering customized products with cost-effective solutions are increasing end users' demand for sustainable printing. Consumers' growing concerns about environmental impacts are rising, and adopting eco-friendly inks is gaining massive popularity in the market.
Attributes | Details |
---|---|
Screen Printing Mesh Market Size, 2023 | USD 712.7 million |
Screen Printing Mesh Market Size, 2033 | USD 1,134.2 million |
Value-based CAGR from 2023 to 2033 | 4.10% |
Competition: The growing alternative technologies, such as digital printing, are offering high-quality, better designs to decline the demand for screen printing mesh.
Environmental Concerns: The increasing environmental concerns increase the demand for eco-friendly inks. The lack of these inks and sustainable materials for printing may restrain the global market growth.
High Material Costs: Shortage of materials, supply chain disruptions, and reduced profit margins are likely to increase the costs, which may decrease the market size.
Quality Control: Manufacturers are facing issues with color accuracy, and printing quality is restraining the global market revenue.
Shortage of Skilled Labor: The need for more technicians and operators faced challenges regarding using chemicals and inks for printing, which may decline the market growth.
The global screen printing mesh market grew steadily, with a valuation of USD 682.1 million in 2022. The increasing demand for attractive packaging style and sealing packaging outlook is raising the need for screen printing mesh.
Increasing consumer demand for decorative items such as glass, cloth, electronic goods, and electric items is rapidly surging the adoption of screen printing mesh.
Attributes | Details |
---|---|
Screen Printing Mesh Market Size, 2022 | USD 682.1 million |
Consumers are looking for effective and high-quality printing solutions for special event presents, increasing the market revenue. Manufacturers are focused on shifting consumers' preferences, changing lifestyles, and enhancing product quality with printing technologies.
Manufacturers are developing new technologies to strengthen touchscreen production for electronic components to boost the global industry.
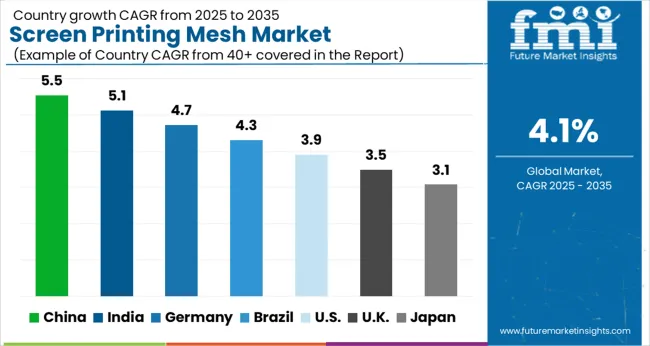
Countries | Forecast CAGR Between 2023 to 2033 |
---|---|
United States | 2.1% |
Canada | 3.7% |
Germany | 2.0% |
United Kingdom | 3.9% |
Italy | 2.9% |
France | 3.3% |
Spain | 2.5% |
China | 5.7% |
India | 6.3% |
Japan | 3.1% |
South Korea | 4.5% |
Thailand | 5.2% |
During the forecast period, Canada is estimated to secure a CAGR of 3.7% in the global market. Increasing manufacturing, retail, glass, and ceramic industries are significantly booming the global Canada screen printing mesh market. The rising fashion industry and advertising companies are adopting a wide range of printing products, increasing the demand for screen printing mesh.
Diverse businesses are producing customized products such as apparel, electronic, and electric products, gaining vast popularity in the market. Key players are growing concerned about effective and sustainable practices to reduce carbon footprints by maintaining product quality. They are trying to offer cost-effective screen printing mesh to capture consumers' requirements.
The United Kingdom is anticipated to capture a CAGR of 3.9% in the global market during the forecast period. The rapidly surging fashion and creative industries are bringing opportunities by increasing demand for screen printing services.
These industries heavily rely on screen printing mesh for customized design and print for apparel to gain consumers' desires.
Growing trade activities and changing regulations seek advanced printing operations, enhancing businesses' revenue. The changing consumers' desire for sustainable and high-quality printing solutions is increasing the demand for screen printing mesh.
Rapidly growing e-commerce sectors offering better pricing or affordable customized printing products fuel the United Kingdom screen printing mesh market.
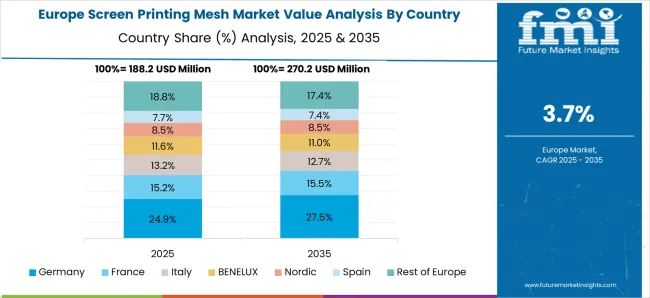
France is likely to secure a CAGR of 3.3% in the global market during the forecast period. Rising, well-established infrastructure, urbanization, and fashion & art industries are surging the demand for screen printing mesh.
France is rich in art, advertising, fashion, and design for promoting their products internationally and is gaining the popularity of screen printing mesh.
Manufacturers are providing efficient products with sustainable materials without lacking quality and are capturing consumers' requirements. France's screen printing mesh market is constantly gaining by managing initial costs, quality control, and craftsmanship with digital printing technologies.
During the forecast period, India is anticipated to secure a CAGR of 6.3% in the global market. The growing economies, urbanization, and vast infrastructure are increasing the demand for screen printing mesh. The rising middle class, changing demographic trends, and custom clothing are increasing the adoption of screen printing mesh.
Manufacturers promote their products with effective logo printing designs, attracting consumers' attention.
Key companies are offering large quantity printing with color accuracy, high quality, and eco-friendly inks, driving the India screen printing mesh market. These companies are offering environmentally friendly products to meet customers' requirements. Key companies are reaching the international market by developing high-material printing products.
The increasing demand for sustainable practices is raising the adoption of screen printing mesh. Based on substrate, paper & paperboard are likely to lead the global screen printing mesh market by capturing a share of 36.1% by 2033.
Consumers are looking for paper-based substrates for eco-friendly solutions to reduce carbon footprints. Key players designing advanced labeling and packaging solutions for various industries are increasingly adopting paper & paperboard. They are branding their products and enhancing sales by offering eye-catching paper & paperboard screen printing, enhancing consumers' desires.
Manufacturers can offer better designs without compromising the quality of products and are increasing the adoption of paper & paperboards. They provide safety regulations with standardized solutions and are gaining vast popularity among customers.
Ongoing technologies, equipment, and mesh are easy to work with, and these substrates are driving the market growth.
Based on end-use, the textile sector is estimated to dominate the global screen printing mesh market by securing a CAGR of 58.1% by 2033. The increasing trendy fashions, cloth designing, and apparel printing are increasing the demand for screen printing mesh in the flourishing textile sector.
They are printing fabrics with unique designs and customized solutions for advertising and promoting their brands, which drive consumer demand.
The rising sports and athletics wear such as t-shirts, jerseys, and uniforms are surging the demand for durable screen printing mesh and are fueling the market size. The textile industry offers its products for promotional merchandise, increasing the adoption of screen printing mesh for effective marketing.
Manufacturers offer innovative printing in the textile sector to improve printing machines, inks, materials, and screen mesh to enhance quality. These technologies bring businesses forward to boost sales and provide high-quality screen printing solutions.
Various events and trade shows are produced to attract a wide range of audiences to promote their brand. The textile sector dominates the global market due to its variety of trends, fashion, and promotional apparel activities to gain maximum Share.
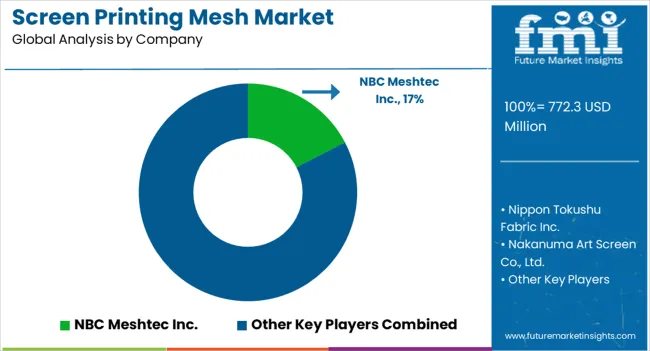
The global screen printing mesh market is highly fragmented by prominent players developing reliable, versatile, and high-quality products significantly. They are focused on end users' requirements and create better products to gain their trust. Key players heavily invest a vast amount in research and development to carry out new and brilliant ideas to expand the market reach.
Recent Developments in the Screen Printing Mesh Market
In 2021, Haver & Boecker announced its newly launched metal mesh for architecture printing in France. This mesh is suitable for outdoor activities with sun protection and ensuring sustainability.
MaiShi Manufacture Group, a China-based manufacturer of wire mesh products, launched an FDA-approved nylon mesh that is acid and alkaline-resistant. It is primarily used to create filtration bags and for pharmaceuticals and food filtration.
Table 1: Global Market Value (US$ Million) Forecast by Region, 2018 to 2033
Table 2: Global Market Volume (Meter) Forecast by Region, 2018 to 2033
Table 3: Global Market Value (US$ Million) Forecast by Material, 2018 to 2033
Table 4: Global Market Volume (Meter) Forecast by Material, 2018 to 2033
Table 5: Global Market Value (US$ Million) Forecast by Filament, 2018 to 2033
Table 6: Global Market Volume (Meter) Forecast by Filament, 2018 to 2033
Table 7: Global Market Value (US$ Million) Forecast by Mesh Count, 2018 to 2033
Table 8: Global Market Volume (Meter) Forecast by Mesh Count, 2018 to 2033
Table 9: Global Market Value (US$ Million) Forecast by Thread Diameter, 2018 to 2033
Table 10: Global Market Volume (Meter) Forecast by Thread Diameter, 2018 to 2033
Table 11: Global Market Value (US$ Million) Forecast by Substrate, 2018 to 2033
Table 12: Global Market Volume (Meter) Forecast by Substrate, 2018 to 2033
Table 13: Global Market Value (US$ Million) Forecast by End-use Industry, 2018 to 2033
Table 14: Global Market Volume (Meter) Forecast by End-use Industry, 2018 to 2033
Table 15: North America Market Value (US$ Million) Forecast by Country, 2018 to 2033
Table 16: North America Market Volume (Meter) Forecast by Country, 2018 to 2033
Table 17: North America Market Value (US$ Million) Forecast by Material, 2018 to 2033
Table 18: North America Market Volume (Meter) Forecast by Material, 2018 to 2033
Table 19: North America Market Value (US$ Million) Forecast by Filament, 2018 to 2033
Table 20: North America Market Volume (Meter) Forecast by Filament, 2018 to 2033
Table 21: North America Market Value (US$ Million) Forecast by Mesh Count, 2018 to 2033
Table 22: North America Market Volume (Meter) Forecast by Mesh Count, 2018 to 2033
Table 23: North America Market Value (US$ Million) Forecast by Thread Diameter, 2018 to 2033
Table 24: North America Market Volume (Meter) Forecast by Thread Diameter, 2018 to 2033
Table 25: North America Market Value (US$ Million) Forecast by Substrate, 2018 to 2033
Table 26: North America Market Volume (Meter) Forecast by Substrate, 2018 to 2033
Table 27: North America Market Value (US$ Million) Forecast by End-use Industry, 2018 to 2033
Table 28: North America Market Volume (Meter) Forecast by End-use Industry, 2018 to 2033
Table 29: Latin America Market Value (US$ Million) Forecast by Country, 2018 to 2033
Table 30: Latin America Market Volume (Meter) Forecast by Country, 2018 to 2033
Table 31: Latin America Market Value (US$ Million) Forecast by Material, 2018 to 2033
Table 32: Latin America Market Volume (Meter) Forecast by Material, 2018 to 2033
Table 33: Latin America Market Value (US$ Million) Forecast by Filament, 2018 to 2033
Table 34: Latin America Market Volume (Meter) Forecast by Filament, 2018 to 2033
Table 35: Latin America Market Value (US$ Million) Forecast by Mesh Count, 2018 to 2033
Table 36: Latin America Market Volume (Meter) Forecast by Mesh Count, 2018 to 2033
Table 37: Latin America Market Value (US$ Million) Forecast by Thread Diameter, 2018 to 2033
Table 38: Latin America Market Volume (Meter) Forecast by Thread Diameter, 2018 to 2033
Table 39: Latin America Market Value (US$ Million) Forecast by Substrate, 2018 to 2033
Table 40: Latin America Market Volume (Meter) Forecast by Substrate, 2018 to 2033
Table 41: Latin America Market Value (US$ Million) Forecast by End-use Industry, 2018 to 2033
Table 42: Latin America Market Volume (Meter) Forecast by End-use Industry, 2018 to 2033
Table 43: Western Europe Market Value (US$ Million) Forecast by Country, 2018 to 2033
Table 44: Western Europe Market Volume (Meter) Forecast by Country, 2018 to 2033
Table 45: Western Europe Market Value (US$ Million) Forecast by Material, 2018 to 2033
Table 46: Western Europe Market Volume (Meter) Forecast by Material, 2018 to 2033
Table 47: Western Europe Market Value (US$ Million) Forecast by Filament, 2018 to 2033
Table 48: Western Europe Market Volume (Meter) Forecast by Filament, 2018 to 2033
Table 49: Western Europe Market Value (US$ Million) Forecast by Mesh Count, 2018 to 2033
Table 50: Western Europe Market Volume (Meter) Forecast by Mesh Count, 2018 to 2033
Table 51: Western Europe Market Value (US$ Million) Forecast by Thread Diameter, 2018 to 2033
Table 52: Western Europe Market Volume (Meter) Forecast by Thread Diameter, 2018 to 2033
Table 53: Western Europe Market Value (US$ Million) Forecast by Substrate, 2018 to 2033
Table 54: Western Europe Market Volume (Meter) Forecast by Substrate, 2018 to 2033
Table 55: Western Europe Market Value (US$ Million) Forecast by End-use Industry, 2018 to 2033
Table 56: Western Europe Market Volume (Meter) Forecast by End-use Industry, 2018 to 2033
Table 57: Eastern Europe Market Value (US$ Million) Forecast by Country, 2018 to 2033
Table 58: Eastern Europe Market Volume (Meter) Forecast by Country, 2018 to 2033
Table 59: Eastern Europe Market Value (US$ Million) Forecast by Material, 2018 to 2033
Table 60: Eastern Europe Market Volume (Meter) Forecast by Material, 2018 to 2033
Table 61: Eastern Europe Market Value (US$ Million) Forecast by Filament, 2018 to 2033
Table 62: Eastern Europe Market Volume (Meter) Forecast by Filament, 2018 to 2033
Table 63: Eastern Europe Market Value (US$ Million) Forecast by Mesh Count, 2018 to 2033
Table 64: Eastern Europe Market Volume (Meter) Forecast by Mesh Count, 2018 to 2033
Table 65: Eastern Europe Market Value (US$ Million) Forecast by Thread Diameter, 2018 to 2033
Table 66: Eastern Europe Market Volume (Meter) Forecast by Thread Diameter, 2018 to 2033
Table 67: Eastern Europe Market Value (US$ Million) Forecast by Substrate, 2018 to 2033
Table 68: Eastern Europe Market Volume (Meter) Forecast by Substrate, 2018 to 2033
Table 69: Eastern Europe Market Value (US$ Million) Forecast by End-use Industry, 2018 to 2033
Table 70: Eastern Europe Market Volume (Meter) Forecast by End-use Industry, 2018 to 2033
Table 71: South Asia and Pacific Market Value (US$ Million) Forecast by Country, 2018 to 2033
Table 72: South Asia and Pacific Market Volume (Meter) Forecast by Country, 2018 to 2033
Table 73: South Asia and Pacific Market Value (US$ Million) Forecast by Material, 2018 to 2033
Table 74: South Asia and Pacific Market Volume (Meter) Forecast by Material, 2018 to 2033
Table 75: South Asia and Pacific Market Value (US$ Million) Forecast by Filament, 2018 to 2033
Table 76: South Asia and Pacific Market Volume (Meter) Forecast by Filament, 2018 to 2033
Table 77: South Asia and Pacific Market Value (US$ Million) Forecast by Mesh Count, 2018 to 2033
Table 78: South Asia and Pacific Market Volume (Meter) Forecast by Mesh Count, 2018 to 2033
Table 79: South Asia and Pacific Market Value (US$ Million) Forecast by Thread Diameter, 2018 to 2033
Table 80: South Asia and Pacific Market Volume (Meter) Forecast by Thread Diameter, 2018 to 2033
Table 81: South Asia and Pacific Market Value (US$ Million) Forecast by Substrate, 2018 to 2033
Table 82: South Asia and Pacific Market Volume (Meter) Forecast by Substrate, 2018 to 2033
Table 83: South Asia and Pacific Market Value (US$ Million) Forecast by End-use Industry, 2018 to 2033
Table 84: South Asia and Pacific Market Volume (Meter) Forecast by End-use Industry, 2018 to 2033
Table 85: East Asia Market Value (US$ Million) Forecast by Country, 2018 to 2033
Table 86: East Asia Market Volume (Meter) Forecast by Country, 2018 to 2033
Table 87: East Asia Market Value (US$ Million) Forecast by Material, 2018 to 2033
Table 88: East Asia Market Volume (Meter) Forecast by Material, 2018 to 2033
Table 89: East Asia Market Value (US$ Million) Forecast by Filament, 2018 to 2033
Table 90: East Asia Market Volume (Meter) Forecast by Filament, 2018 to 2033
Table 91: East Asia Market Value (US$ Million) Forecast by Mesh Count, 2018 to 2033
Table 92: East Asia Market Volume (Meter) Forecast by Mesh Count, 2018 to 2033
Table 93: East Asia Market Value (US$ Million) Forecast by Thread Diameter, 2018 to 2033
Table 94: East Asia Market Volume (Meter) Forecast by Thread Diameter, 2018 to 2033
Table 95: East Asia Market Value (US$ Million) Forecast by Substrate, 2018 to 2033
Table 96: East Asia Market Volume (Meter) Forecast by Substrate, 2018 to 2033
Table 97: East Asia Market Value (US$ Million) Forecast by End-use Industry, 2018 to 2033
Table 98: East Asia Market Volume (Meter) Forecast by End-use Industry, 2018 to 2033
Table 99: Middle East and Africa Market Value (US$ Million) Forecast by Country, 2018 to 2033
Table 100: Middle East and Africa Market Volume (Meter) Forecast by Country, 2018 to 2033
Table 101: Middle East and Africa Market Value (US$ Million) Forecast by Material, 2018 to 2033
Table 102: Middle East and Africa Market Volume (Meter) Forecast by Material, 2018 to 2033
Table 103: Middle East and Africa Market Value (US$ Million) Forecast by Filament, 2018 to 2033
Table 104: Middle East and Africa Market Volume (Meter) Forecast by Filament, 2018 to 2033
Table 105: Middle East and Africa Market Value (US$ Million) Forecast by Mesh Count, 2018 to 2033
Table 106: Middle East and Africa Market Volume (Meter) Forecast by Mesh Count, 2018 to 2033
Table 107: Middle East and Africa Market Value (US$ Million) Forecast by Thread Diameter, 2018 to 2033
Table 108: Middle East and Africa Market Volume (Meter) Forecast by Thread Diameter, 2018 to 2033
Table 109: Middle East and Africa Market Value (US$ Million) Forecast by Substrate, 2018 to 2033
Table 110: Middle East and Africa Market Volume (Meter) Forecast by Substrate, 2018 to 2033
Table 111: Middle East and Africa Market Value (US$ Million) Forecast by End-use Industry, 2018 to 2033
Table 112: Middle East and Africa Market Volume (Meter) Forecast by End-use Industry, 2018 to 2033
Figure 1: Global Market Value (US$ Million) by Material, 2023 to 2033
Figure 2: Global Market Value (US$ Million) by Filament, 2023 to 2033
Figure 3: Global Market Value (US$ Million) by Mesh Count, 2023 to 2033
Figure 4: Global Market Value (US$ Million) by Thread Diameter, 2023 to 2033
Figure 5: Global Market Value (US$ Million) by Substrate, 2023 to 2033
Figure 6: Global Market Value (US$ Million) by End-use Industry, 2023 to 2033
Figure 7: Global Market Value (US$ Million) by Region, 2023 to 2033
Figure 8: Global Market Value (US$ Million) Analysis by Region, 2018 to 2033
Figure 9: Global Market Volume (Meter) Analysis by Region, 2018 to 2033
Figure 10: Global Market Value Share (%) and BPS Analysis by Region, 2023 to 2033
Figure 11: Global Market Y-o-Y Growth (%) Projections by Region, 2023 to 2033
Figure 12: Global Market Value (US$ Million) Analysis by Material, 2018 to 2033
Figure 13: Global Market Volume (Meter) Analysis by Material, 2018 to 2033
Figure 14: Global Market Value Share (%) and BPS Analysis by Material, 2023 to 2033
Figure 15: Global Market Y-o-Y Growth (%) Projections by Material, 2023 to 2033
Figure 16: Global Market Value (US$ Million) Analysis by Filament, 2018 to 2033
Figure 17: Global Market Volume (Meter) Analysis by Filament, 2018 to 2033
Figure 18: Global Market Value Share (%) and BPS Analysis by Filament, 2023 to 2033
Figure 19: Global Market Y-o-Y Growth (%) Projections by Filament, 2023 to 2033
Figure 20: Global Market Value (US$ Million) Analysis by Mesh Count, 2018 to 2033
Figure 21: Global Market Volume (Meter) Analysis by Mesh Count, 2018 to 2033
Figure 22: Global Market Value Share (%) and BPS Analysis by Mesh Count, 2023 to 2033
Figure 23: Global Market Y-o-Y Growth (%) Projections by Mesh Count, 2023 to 2033
Figure 24: Global Market Value (US$ Million) Analysis by Thread Diameter, 2018 to 2033
Figure 25: Global Market Volume (Meter) Analysis by Thread Diameter, 2018 to 2033
Figure 26: Global Market Value Share (%) and BPS Analysis by Thread Diameter, 2023 to 2033
Figure 27: Global Market Y-o-Y Growth (%) Projections by Thread Diameter, 2023 to 2033
Figure 28: Global Market Value (US$ Million) Analysis by Substrate, 2018 to 2033
Figure 29: Global Market Volume (Meter) Analysis by Substrate, 2018 to 2033
Figure 30: Global Market Value Share (%) and BPS Analysis by Substrate, 2023 to 2033
Figure 31: Global Market Y-o-Y Growth (%) Projections by Substrate, 2023 to 2033
Figure 32: Global Market Value (US$ Million) Analysis by End-use Industry, 2018 to 2033
Figure 33: Global Market Volume (Meter) Analysis by End-use Industry, 2018 to 2033
Figure 34: Global Market Value Share (%) and BPS Analysis by End-use Industry, 2023 to 2033
Figure 35: Global Market Y-o-Y Growth (%) Projections by End-use Industry, 2023 to 2033
Figure 36: Global Market Attractiveness by Material, 2023 to 2033
Figure 37: Global Market Attractiveness by Filament, 2023 to 2033
Figure 38: Global Market Attractiveness by Mesh Count, 2023 to 2033
Figure 39: Global Market Attractiveness by Thread Diameter, 2023 to 2033
Figure 40: Global Market Attractiveness by Substrate, 2023 to 2033
Figure 41: Global Market Attractiveness by End-use Industry, 2023 to 2033
Figure 42: Global Market Attractiveness by Region, 2023 to 2033
Figure 43: North America Market Value (US$ Million) by Material, 2023 to 2033
Figure 44: North America Market Value (US$ Million) by Filament, 2023 to 2033
Figure 45: North America Market Value (US$ Million) by Mesh Count, 2023 to 2033
Figure 46: North America Market Value (US$ Million) by Thread Diameter, 2023 to 2033
Figure 47: North America Market Value (US$ Million) by Substrate, 2023 to 2033
Figure 48: North America Market Value (US$ Million) by End-use Industry, 2023 to 2033
Figure 49: North America Market Value (US$ Million) by Country, 2023 to 2033
Figure 50: North America Market Value (US$ Million) Analysis by Country, 2018 to 2033
Figure 51: North America Market Volume (Meter) Analysis by Country, 2018 to 2033
Figure 52: North America Market Value Share (%) and BPS Analysis by Country, 2023 to 2033
Figure 53: North America Market Y-o-Y Growth (%) Projections by Country, 2023 to 2033
Figure 54: North America Market Value (US$ Million) Analysis by Material, 2018 to 2033
Figure 55: North America Market Volume (Meter) Analysis by Material, 2018 to 2033
Figure 56: North America Market Value Share (%) and BPS Analysis by Material, 2023 to 2033
Figure 57: North America Market Y-o-Y Growth (%) Projections by Material, 2023 to 2033
Figure 58: North America Market Value (US$ Million) Analysis by Filament, 2018 to 2033
Figure 59: North America Market Volume (Meter) Analysis by Filament, 2018 to 2033
Figure 60: North America Market Value Share (%) and BPS Analysis by Filament, 2023 to 2033
Figure 61: North America Market Y-o-Y Growth (%) Projections by Filament, 2023 to 2033
Figure 62: North America Market Value (US$ Million) Analysis by Mesh Count, 2018 to 2033
Figure 63: North America Market Volume (Meter) Analysis by Mesh Count, 2018 to 2033
Figure 64: North America Market Value Share (%) and BPS Analysis by Mesh Count, 2023 to 2033
Figure 65: North America Market Y-o-Y Growth (%) Projections by Mesh Count, 2023 to 2033
Figure 66: North America Market Value (US$ Million) Analysis by Thread Diameter, 2018 to 2033
Figure 67: North America Market Volume (Meter) Analysis by Thread Diameter, 2018 to 2033
Figure 68: North America Market Value Share (%) and BPS Analysis by Thread Diameter, 2023 to 2033
Figure 69: North America Market Y-o-Y Growth (%) Projections by Thread Diameter, 2023 to 2033
Figure 70: North America Market Value (US$ Million) Analysis by Substrate, 2018 to 2033
Figure 71: North America Market Volume (Meter) Analysis by Substrate, 2018 to 2033
Figure 72: North America Market Value Share (%) and BPS Analysis by Substrate, 2023 to 2033
Figure 73: North America Market Y-o-Y Growth (%) Projections by Substrate, 2023 to 2033
Figure 74: North America Market Value (US$ Million) Analysis by End-use Industry, 2018 to 2033
Figure 75: North America Market Volume (Meter) Analysis by End-use Industry, 2018 to 2033
Figure 76: North America Market Value Share (%) and BPS Analysis by End-use Industry, 2023 to 2033
Figure 77: North America Market Y-o-Y Growth (%) Projections by End-use Industry, 2023 to 2033
Figure 78: North America Market Attractiveness by Material, 2023 to 2033
Figure 79: North America Market Attractiveness by Filament, 2023 to 2033
Figure 80: North America Market Attractiveness by Mesh Count, 2023 to 2033
Figure 81: North America Market Attractiveness by Thread Diameter, 2023 to 2033
Figure 82: North America Market Attractiveness by Substrate, 2023 to 2033
Figure 83: North America Market Attractiveness by End-use Industry, 2023 to 2033
Figure 84: North America Market Attractiveness by Country, 2023 to 2033
Figure 85: Latin America Market Value (US$ Million) by Material, 2023 to 2033
Figure 86: Latin America Market Value (US$ Million) by Filament, 2023 to 2033
Figure 87: Latin America Market Value (US$ Million) by Mesh Count, 2023 to 2033
Figure 88: Latin America Market Value (US$ Million) by Thread Diameter, 2023 to 2033
Figure 89: Latin America Market Value (US$ Million) by Substrate, 2023 to 2033
Figure 90: Latin America Market Value (US$ Million) by End-use Industry, 2023 to 2033
Figure 91: Latin America Market Value (US$ Million) by Country, 2023 to 2033
Figure 92: Latin America Market Value (US$ Million) Analysis by Country, 2018 to 2033
Figure 93: Latin America Market Volume (Meter) Analysis by Country, 2018 to 2033
Figure 94: Latin America Market Value Share (%) and BPS Analysis by Country, 2023 to 2033
Figure 95: Latin America Market Y-o-Y Growth (%) Projections by Country, 2023 to 2033
Figure 96: Latin America Market Value (US$ Million) Analysis by Material, 2018 to 2033
Figure 97: Latin America Market Volume (Meter) Analysis by Material, 2018 to 2033
Figure 98: Latin America Market Value Share (%) and BPS Analysis by Material, 2023 to 2033
Figure 99: Latin America Market Y-o-Y Growth (%) Projections by Material, 2023 to 2033
Figure 100: Latin America Market Value (US$ Million) Analysis by Filament, 2018 to 2033
Figure 101: Latin America Market Volume (Meter) Analysis by Filament, 2018 to 2033
Figure 102: Latin America Market Value Share (%) and BPS Analysis by Filament, 2023 to 2033
Figure 103: Latin America Market Y-o-Y Growth (%) Projections by Filament, 2023 to 2033
Figure 104: Latin America Market Value (US$ Million) Analysis by Mesh Count, 2018 to 2033
Figure 105: Latin America Market Volume (Meter) Analysis by Mesh Count, 2018 to 2033
Figure 106: Latin America Market Value Share (%) and BPS Analysis by Mesh Count, 2023 to 2033
Figure 107: Latin America Market Y-o-Y Growth (%) Projections by Mesh Count, 2023 to 2033
Figure 108: Latin America Market Value (US$ Million) Analysis by Thread Diameter, 2018 to 2033
Figure 109: Latin America Market Volume (Meter) Analysis by Thread Diameter, 2018 to 2033
Figure 110: Latin America Market Value Share (%) and BPS Analysis by Thread Diameter, 2023 to 2033
Figure 111: Latin America Market Y-o-Y Growth (%) Projections by Thread Diameter, 2023 to 2033
Figure 112: Latin America Market Value (US$ Million) Analysis by Substrate, 2018 to 2033
Figure 113: Latin America Market Volume (Meter) Analysis by Substrate, 2018 to 2033
Figure 114: Latin America Market Value Share (%) and BPS Analysis by Substrate, 2023 to 2033
Figure 115: Latin America Market Y-o-Y Growth (%) Projections by Substrate, 2023 to 2033
Figure 116: Latin America Market Value (US$ Million) Analysis by End-use Industry, 2018 to 2033
Figure 117: Latin America Market Volume (Meter) Analysis by End-use Industry, 2018 to 2033
Figure 118: Latin America Market Value Share (%) and BPS Analysis by End-use Industry, 2023 to 2033
Figure 119: Latin America Market Y-o-Y Growth (%) Projections by End-use Industry, 2023 to 2033
Figure 120: Latin America Market Attractiveness by Material, 2023 to 2033
Figure 121: Latin America Market Attractiveness by Filament, 2023 to 2033
Figure 122: Latin America Market Attractiveness by Mesh Count, 2023 to 2033
Figure 123: Latin America Market Attractiveness by Thread Diameter, 2023 to 2033
Figure 124: Latin America Market Attractiveness by Substrate, 2023 to 2033
Figure 125: Latin America Market Attractiveness by End-use Industry, 2023 to 2033
Figure 126: Latin America Market Attractiveness by Country, 2023 to 2033
Figure 127: Western Europe Market Value (US$ Million) by Material, 2023 to 2033
Figure 128: Western Europe Market Value (US$ Million) by Filament, 2023 to 2033
Figure 129: Western Europe Market Value (US$ Million) by Mesh Count, 2023 to 2033
Figure 130: Western Europe Market Value (US$ Million) by Thread Diameter, 2023 to 2033
Figure 131: Western Europe Market Value (US$ Million) by Substrate, 2023 to 2033
Figure 132: Western Europe Market Value (US$ Million) by End-use Industry, 2023 to 2033
Figure 133: Western Europe Market Value (US$ Million) by Country, 2023 to 2033
Figure 134: Western Europe Market Value (US$ Million) Analysis by Country, 2018 to 2033
Figure 135: Western Europe Market Volume (Meter) Analysis by Country, 2018 to 2033
Figure 136: Western Europe Market Value Share (%) and BPS Analysis by Country, 2023 to 2033
Figure 137: Western Europe Market Y-o-Y Growth (%) Projections by Country, 2023 to 2033
Figure 138: Western Europe Market Value (US$ Million) Analysis by Material, 2018 to 2033
Figure 139: Western Europe Market Volume (Meter) Analysis by Material, 2018 to 2033
Figure 140: Western Europe Market Value Share (%) and BPS Analysis by Material, 2023 to 2033
Figure 141: Western Europe Market Y-o-Y Growth (%) Projections by Material, 2023 to 2033
Figure 142: Western Europe Market Value (US$ Million) Analysis by Filament, 2018 to 2033
Figure 143: Western Europe Market Volume (Meter) Analysis by Filament, 2018 to 2033
Figure 144: Western Europe Market Value Share (%) and BPS Analysis by Filament, 2023 to 2033
Figure 145: Western Europe Market Y-o-Y Growth (%) Projections by Filament, 2023 to 2033
Figure 146: Western Europe Market Value (US$ Million) Analysis by Mesh Count, 2018 to 2033
Figure 147: Western Europe Market Volume (Meter) Analysis by Mesh Count, 2018 to 2033
Figure 148: Western Europe Market Value Share (%) and BPS Analysis by Mesh Count, 2023 to 2033
Figure 149: Western Europe Market Y-o-Y Growth (%) Projections by Mesh Count, 2023 to 2033
Figure 150: Western Europe Market Value (US$ Million) Analysis by Thread Diameter, 2018 to 2033
Figure 151: Western Europe Market Volume (Meter) Analysis by Thread Diameter, 2018 to 2033
Figure 152: Western Europe Market Value Share (%) and BPS Analysis by Thread Diameter, 2023 to 2033
Figure 153: Western Europe Market Y-o-Y Growth (%) Projections by Thread Diameter, 2023 to 2033
Figure 154: Western Europe Market Value (US$ Million) Analysis by Substrate, 2018 to 2033
Figure 155: Western Europe Market Volume (Meter) Analysis by Substrate, 2018 to 2033
Figure 156: Western Europe Market Value Share (%) and BPS Analysis by Substrate, 2023 to 2033
Figure 157: Western Europe Market Y-o-Y Growth (%) Projections by Substrate, 2023 to 2033
Figure 158: Western Europe Market Value (US$ Million) Analysis by End-use Industry, 2018 to 2033
Figure 159: Western Europe Market Volume (Meter) Analysis by End-use Industry, 2018 to 2033
Figure 160: Western Europe Market Value Share (%) and BPS Analysis by End-use Industry, 2023 to 2033
Figure 161: Western Europe Market Y-o-Y Growth (%) Projections by End-use Industry, 2023 to 2033
Figure 162: Western Europe Market Attractiveness by Material, 2023 to 2033
Figure 163: Western Europe Market Attractiveness by Filament, 2023 to 2033
Figure 164: Western Europe Market Attractiveness by Mesh Count, 2023 to 2033
Figure 165: Western Europe Market Attractiveness by Thread Diameter, 2023 to 2033
Figure 166: Western Europe Market Attractiveness by Substrate, 2023 to 2033
Figure 167: Western Europe Market Attractiveness by End-use Industry, 2023 to 2033
Figure 168: Western Europe Market Attractiveness by Country, 2023 to 2033
Figure 169: Eastern Europe Market Value (US$ Million) by Material, 2023 to 2033
Figure 170: Eastern Europe Market Value (US$ Million) by Filament, 2023 to 2033
Figure 171: Eastern Europe Market Value (US$ Million) by Mesh Count, 2023 to 2033
Figure 172: Eastern Europe Market Value (US$ Million) by Thread Diameter, 2023 to 2033
Figure 173: Eastern Europe Market Value (US$ Million) by Substrate, 2023 to 2033
Figure 174: Eastern Europe Market Value (US$ Million) by End-use Industry, 2023 to 2033
Figure 175: Eastern Europe Market Value (US$ Million) by Country, 2023 to 2033
Figure 176: Eastern Europe Market Value (US$ Million) Analysis by Country, 2018 to 2033
Figure 177: Eastern Europe Market Volume (Meter) Analysis by Country, 2018 to 2033
Figure 178: Eastern Europe Market Value Share (%) and BPS Analysis by Country, 2023 to 2033
Figure 179: Eastern Europe Market Y-o-Y Growth (%) Projections by Country, 2023 to 2033
Figure 180: Eastern Europe Market Value (US$ Million) Analysis by Material, 2018 to 2033
Figure 181: Eastern Europe Market Volume (Meter) Analysis by Material, 2018 to 2033
Figure 182: Eastern Europe Market Value Share (%) and BPS Analysis by Material, 2023 to 2033
Figure 183: Eastern Europe Market Y-o-Y Growth (%) Projections by Material, 2023 to 2033
Figure 184: Eastern Europe Market Value (US$ Million) Analysis by Filament, 2018 to 2033
Figure 185: Eastern Europe Market Volume (Meter) Analysis by Filament, 2018 to 2033
Figure 186: Eastern Europe Market Value Share (%) and BPS Analysis by Filament, 2023 to 2033
Figure 187: Eastern Europe Market Y-o-Y Growth (%) Projections by Filament, 2023 to 2033
Figure 188: Eastern Europe Market Value (US$ Million) Analysis by Mesh Count, 2018 to 2033
Figure 189: Eastern Europe Market Volume (Meter) Analysis by Mesh Count, 2018 to 2033
Figure 190: Eastern Europe Market Value Share (%) and BPS Analysis by Mesh Count, 2023 to 2033
Figure 191: Eastern Europe Market Y-o-Y Growth (%) Projections by Mesh Count, 2023 to 2033
Figure 192: Eastern Europe Market Value (US$ Million) Analysis by Thread Diameter, 2018 to 2033
Figure 193: Eastern Europe Market Volume (Meter) Analysis by Thread Diameter, 2018 to 2033
Figure 194: Eastern Europe Market Value Share (%) and BPS Analysis by Thread Diameter, 2023 to 2033
Figure 195: Eastern Europe Market Y-o-Y Growth (%) Projections by Thread Diameter, 2023 to 2033
Figure 196: Eastern Europe Market Value (US$ Million) Analysis by Substrate, 2018 to 2033
Figure 197: Eastern Europe Market Volume (Meter) Analysis by Substrate, 2018 to 2033
Figure 198: Eastern Europe Market Value Share (%) and BPS Analysis by Substrate, 2023 to 2033
Figure 199: Eastern Europe Market Y-o-Y Growth (%) Projections by Substrate, 2023 to 2033
Figure 200: Eastern Europe Market Value (US$ Million) Analysis by End-use Industry, 2018 to 2033
Figure 201: Eastern Europe Market Volume (Meter) Analysis by End-use Industry, 2018 to 2033
Figure 202: Eastern Europe Market Value Share (%) and BPS Analysis by End-use Industry, 2023 to 2033
Figure 203: Eastern Europe Market Y-o-Y Growth (%) Projections by End-use Industry, 2023 to 2033
Figure 204: Eastern Europe Market Attractiveness by Material, 2023 to 2033
Figure 205: Eastern Europe Market Attractiveness by Filament, 2023 to 2033
Figure 206: Eastern Europe Market Attractiveness by Mesh Count, 2023 to 2033
Figure 207: Eastern Europe Market Attractiveness by Thread Diameter, 2023 to 2033
Figure 208: Eastern Europe Market Attractiveness by Substrate, 2023 to 2033
Figure 209: Eastern Europe Market Attractiveness by End-use Industry, 2023 to 2033
Figure 210: Eastern Europe Market Attractiveness by Country, 2023 to 2033
Figure 211: South Asia and Pacific Market Value (US$ Million) by Material, 2023 to 2033
Figure 212: South Asia and Pacific Market Value (US$ Million) by Filament, 2023 to 2033
Figure 213: South Asia and Pacific Market Value (US$ Million) by Mesh Count, 2023 to 2033
Figure 214: South Asia and Pacific Market Value (US$ Million) by Thread Diameter, 2023 to 2033
Figure 215: South Asia and Pacific Market Value (US$ Million) by Substrate, 2023 to 2033
Figure 216: South Asia and Pacific Market Value (US$ Million) by End-use Industry, 2023 to 2033
Figure 217: South Asia and Pacific Market Value (US$ Million) by Country, 2023 to 2033
Figure 218: South Asia and Pacific Market Value (US$ Million) Analysis by Country, 2018 to 2033
Figure 219: South Asia and Pacific Market Volume (Meter) Analysis by Country, 2018 to 2033
Figure 220: South Asia and Pacific Market Value Share (%) and BPS Analysis by Country, 2023 to 2033
Figure 221: South Asia and Pacific Market Y-o-Y Growth (%) Projections by Country, 2023 to 2033
Figure 222: South Asia and Pacific Market Value (US$ Million) Analysis by Material, 2018 to 2033
Figure 223: South Asia and Pacific Market Volume (Meter) Analysis by Material, 2018 to 2033
Figure 224: South Asia and Pacific Market Value Share (%) and BPS Analysis by Material, 2023 to 2033
Figure 225: South Asia and Pacific Market Y-o-Y Growth (%) Projections by Material, 2023 to 2033
Figure 226: South Asia and Pacific Market Value (US$ Million) Analysis by Filament, 2018 to 2033
Figure 227: South Asia and Pacific Market Volume (Meter) Analysis by Filament, 2018 to 2033
Figure 228: South Asia and Pacific Market Value Share (%) and BPS Analysis by Filament, 2023 to 2033
Figure 229: South Asia and Pacific Market Y-o-Y Growth (%) Projections by Filament, 2023 to 2033
Figure 230: South Asia and Pacific Market Value (US$ Million) Analysis by Mesh Count, 2018 to 2033
Figure 231: South Asia and Pacific Market Volume (Meter) Analysis by Mesh Count, 2018 to 2033
Figure 232: South Asia and Pacific Market Value Share (%) and BPS Analysis by Mesh Count, 2023 to 2033
Figure 233: South Asia and Pacific Market Y-o-Y Growth (%) Projections by Mesh Count, 2023 to 2033
Figure 234: South Asia and Pacific Market Value (US$ Million) Analysis by Thread Diameter, 2018 to 2033
Figure 235: South Asia and Pacific Market Volume (Meter) Analysis by Thread Diameter, 2018 to 2033
Figure 236: South Asia and Pacific Market Value Share (%) and BPS Analysis by Thread Diameter, 2023 to 2033
Figure 237: South Asia and Pacific Market Y-o-Y Growth (%) Projections by Thread Diameter, 2023 to 2033
Figure 238: South Asia and Pacific Market Value (US$ Million) Analysis by Substrate, 2018 to 2033
Figure 239: South Asia and Pacific Market Volume (Meter) Analysis by Substrate, 2018 to 2033
Figure 240: South Asia and Pacific Market Value Share (%) and BPS Analysis by Substrate, 2023 to 2033
Figure 241: South Asia and Pacific Market Y-o-Y Growth (%) Projections by Substrate, 2023 to 2033
Figure 242: South Asia and Pacific Market Value (US$ Million) Analysis by End-use Industry, 2018 to 2033
Figure 243: South Asia and Pacific Market Volume (Meter) Analysis by End-use Industry, 2018 to 2033
Figure 244: South Asia and Pacific Market Value Share (%) and BPS Analysis by End-use Industry, 2023 to 2033
Figure 245: South Asia and Pacific Market Y-o-Y Growth (%) Projections by End-use Industry, 2023 to 2033
Figure 246: South Asia and Pacific Market Attractiveness by Material, 2023 to 2033
Figure 247: South Asia and Pacific Market Attractiveness by Filament, 2023 to 2033
Figure 248: South Asia and Pacific Market Attractiveness by Mesh Count, 2023 to 2033
Figure 249: South Asia and Pacific Market Attractiveness by Thread Diameter, 2023 to 2033
Figure 250: South Asia and Pacific Market Attractiveness by Substrate, 2023 to 2033
Figure 251: South Asia and Pacific Market Attractiveness by End-use Industry, 2023 to 2033
Figure 252: South Asia and Pacific Market Attractiveness by Country, 2023 to 2033
Figure 253: East Asia Market Value (US$ Million) by Material, 2023 to 2033
Figure 254: East Asia Market Value (US$ Million) by Filament, 2023 to 2033
Figure 255: East Asia Market Value (US$ Million) by Mesh Count, 2023 to 2033
Figure 256: East Asia Market Value (US$ Million) by Thread Diameter, 2023 to 2033
Figure 257: East Asia Market Value (US$ Million) by Substrate, 2023 to 2033
Figure 258: East Asia Market Value (US$ Million) by End-use Industry, 2023 to 2033
Figure 259: East Asia Market Value (US$ Million) by Country, 2023 to 2033
Figure 260: East Asia Market Value (US$ Million) Analysis by Country, 2018 to 2033
Figure 261: East Asia Market Volume (Meter) Analysis by Country, 2018 to 2033
Figure 262: East Asia Market Value Share (%) and BPS Analysis by Country, 2023 to 2033
Figure 263: East Asia Market Y-o-Y Growth (%) Projections by Country, 2023 to 2033
Figure 264: East Asia Market Value (US$ Million) Analysis by Material, 2018 to 2033
Figure 265: East Asia Market Volume (Meter) Analysis by Material, 2018 to 2033
Figure 266: East Asia Market Value Share (%) and BPS Analysis by Material, 2023 to 2033
Figure 267: East Asia Market Y-o-Y Growth (%) Projections by Material, 2023 to 2033
Figure 268: East Asia Market Value (US$ Million) Analysis by Filament, 2018 to 2033
Figure 269: East Asia Market Volume (Meter) Analysis by Filament, 2018 to 2033
Figure 270: East Asia Market Value Share (%) and BPS Analysis by Filament, 2023 to 2033
Figure 271: East Asia Market Y-o-Y Growth (%) Projections by Filament, 2023 to 2033
Figure 272: East Asia Market Value (US$ Million) Analysis by Mesh Count, 2018 to 2033
Figure 273: East Asia Market Volume (Meter) Analysis by Mesh Count, 2018 to 2033
Figure 274: East Asia Market Value Share (%) and BPS Analysis by Mesh Count, 2023 to 2033
Figure 275: East Asia Market Y-o-Y Growth (%) Projections by Mesh Count, 2023 to 2033
Figure 276: East Asia Market Value (US$ Million) Analysis by Thread Diameter, 2018 to 2033
Figure 277: East Asia Market Volume (Meter) Analysis by Thread Diameter, 2018 to 2033
Figure 278: East Asia Market Value Share (%) and BPS Analysis by Thread Diameter, 2023 to 2033
Figure 279: East Asia Market Y-o-Y Growth (%) Projections by Thread Diameter, 2023 to 2033
Figure 280: East Asia Market Value (US$ Million) Analysis by Substrate, 2018 to 2033
Figure 281: East Asia Market Volume (Meter) Analysis by Substrate, 2018 to 2033
Figure 282: East Asia Market Value Share (%) and BPS Analysis by Substrate, 2023 to 2033
Figure 283: East Asia Market Y-o-Y Growth (%) Projections by Substrate, 2023 to 2033
Figure 284: East Asia Market Value (US$ Million) Analysis by End-use Industry, 2018 to 2033
Figure 285: East Asia Market Volume (Meter) Analysis by End-use Industry, 2018 to 2033
Figure 286: East Asia Market Value Share (%) and BPS Analysis by End-use Industry, 2023 to 2033
Figure 287: East Asia Market Y-o-Y Growth (%) Projections by End-use Industry, 2023 to 2033
Figure 288: East Asia Market Attractiveness by Material, 2023 to 2033
Figure 289: East Asia Market Attractiveness by Filament, 2023 to 2033
Figure 290: East Asia Market Attractiveness by Mesh Count, 2023 to 2033
Figure 291: East Asia Market Attractiveness by Thread Diameter, 2023 to 2033
Figure 292: East Asia Market Attractiveness by Substrate, 2023 to 2033
Figure 293: East Asia Market Attractiveness by End-use Industry, 2023 to 2033
Figure 294: East Asia Market Attractiveness by Country, 2023 to 2033
Figure 295: Middle East and Africa Market Value (US$ Million) by Material, 2023 to 2033
Figure 296: Middle East and Africa Market Value (US$ Million) by Filament, 2023 to 2033
Figure 297: Middle East and Africa Market Value (US$ Million) by Mesh Count, 2023 to 2033
Figure 298: Middle East and Africa Market Value (US$ Million) by Thread Diameter, 2023 to 2033
Figure 299: Middle East and Africa Market Value (US$ Million) by Substrate, 2023 to 2033
Figure 300: Middle East and Africa Market Value (US$ Million) by End-use Industry, 2023 to 2033
Figure 301: Middle East and Africa Market Value (US$ Million) by Country, 2023 to 2033
Figure 302: Middle East and Africa Market Value (US$ Million) Analysis by Country, 2018 to 2033
Figure 303: Middle East and Africa Market Volume (Meter) Analysis by Country, 2018 to 2033
Figure 304: Middle East and Africa Market Value Share (%) and BPS Analysis by Country, 2023 to 2033
Figure 305: Middle East and Africa Market Y-o-Y Growth (%) Projections by Country, 2023 to 2033
Figure 306: Middle East and Africa Market Value (US$ Million) Analysis by Material, 2018 to 2033
Figure 307: Middle East and Africa Market Volume (Meter) Analysis by Material, 2018 to 2033
Figure 308: Middle East and Africa Market Value Share (%) and BPS Analysis by Material, 2023 to 2033
Figure 309: Middle East and Africa Market Y-o-Y Growth (%) Projections by Material, 2023 to 2033
Figure 310: Middle East and Africa Market Value (US$ Million) Analysis by Filament, 2018 to 2033
Figure 311: Middle East and Africa Market Volume (Meter) Analysis by Filament, 2018 to 2033
Figure 312: Middle East and Africa Market Value Share (%) and BPS Analysis by Filament, 2023 to 2033
Figure 313: Middle East and Africa Market Y-o-Y Growth (%) Projections by Filament, 2023 to 2033
Figure 314: Middle East and Africa Market Value (US$ Million) Analysis by Mesh Count, 2018 to 2033
Figure 315: Middle East and Africa Market Volume (Meter) Analysis by Mesh Count, 2018 to 2033
Figure 316: Middle East and Africa Market Value Share (%) and BPS Analysis by Mesh Count, 2023 to 2033
Figure 317: Middle East and Africa Market Y-o-Y Growth (%) Projections by Mesh Count, 2023 to 2033
Figure 318: Middle East and Africa Market Value (US$ Million) Analysis by Thread Diameter, 2018 to 2033
Figure 319: Middle East and Africa Market Volume (Meter) Analysis by Thread Diameter, 2018 to 2033
Figure 320: Middle East and Africa Market Value Share (%) and BPS Analysis by Thread Diameter, 2023 to 2033
Figure 321: Middle East and Africa Market Y-o-Y Growth (%) Projections by Thread Diameter, 2023 to 2033
Figure 322: Middle East and Africa Market Value (US$ Million) Analysis by Substrate, 2018 to 2033
Figure 323: Middle East and Africa Market Volume (Meter) Analysis by Substrate, 2018 to 2033
Figure 324: Middle East and Africa Market Value Share (%) and BPS Analysis by Substrate, 2023 to 2033
Figure 325: Middle East and Africa Market Y-o-Y Growth (%) Projections by Substrate, 2023 to 2033
Figure 326: Middle East and Africa Market Value (US$ Million) Analysis by End-use Industry, 2018 to 2033
Figure 327: Middle East and Africa Market Volume (Meter) Analysis by End-use Industry, 2018 to 2033
Figure 328: Middle East and Africa Market Value Share (%) and BPS Analysis by End-use Industry, 2023 to 2033
Figure 329: Middle East and Africa Market Y-o-Y Growth (%) Projections by End-use Industry, 2023 to 2033
Figure 330: Middle East and Africa Market Attractiveness by Material, 2023 to 2033
Figure 331: Middle East and Africa Market Attractiveness by Filament, 2023 to 2033
Figure 332: Middle East and Africa Market Attractiveness by Mesh Count, 2023 to 2033
Figure 333: Middle East and Africa Market Attractiveness by Thread Diameter, 2023 to 2033
Figure 334: Middle East and Africa Market Attractiveness by Substrate, 2023 to 2033
Figure 335: Middle East and Africa Market Attractiveness by End-use Industry, 2023 to 2033
Figure 336: Middle East and Africa Market Attractiveness by Country, 2023 to 2033
The screen printing mesh market is estimated to secure a valuation of USD 712.7 million in 2023.
The United States is leading the market for screen printing mesh.
The screen printing mesh market is likely to capture a CAGR of 4.10% in 2023.
The growing focus on sustainability and reducing carbon emissions.
Weisse & Eschrich GmbH & Co. KG and Asada Mesh Co., Ltd. are the key players in the global market.
Explore Similar Insights
Thank you!
You will receive an email from our Business Development Manager. Please be sure to check your SPAM/JUNK folder too.