Spectrum Analyzer Market Size and Share Forecast Outlook 2025 to 2035

The Spectrum Analyzer Market is estimated to be valued at USD 1.8 billion in 2025 and is projected to reach USD 4.2 billion by 2035, registering a compound annual growth rate (CAGR) of 9.0% over the forecast period.
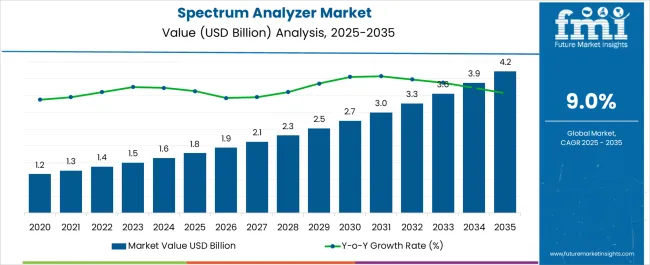
Quick Stats for Spectrum Analyzer Market

  • Spectrum Analyzer Market Value (2025): USD 1.8 billion
  • Spectrum Analyzer Market Forecast Value (2035): USD 4.2 billion
  • Spectrum Analyzer Market Forecast CAGR: 9.0%
  • Leading Segment in Spectrum Analyzer Market in 2025: Wireless (55.4%)
  • Key Growth Regions in Spectrum Analyzer Market: North America, Asia-Pacific, Europe
  • Top Key Players in Spectrum Analyzer Market: Keysight Technologies, Rohde & Schwarz GmbH & Co, Anritsu Corporation, Advantest Corporation, B&K Precision Corporation, Giga-tronics Incorporated, National Instruments Corporation

Spectrum Analyzer Market Market Value Analysis

Spectrum Analyzer Market Key Takeaways

Metric Value
Spectrum Analyzer Market Estimated Value in (2025 E) USD 1.8 billion
Spectrum Analyzer Market Forecast Value in (2035 F) USD 4.2 billion
Forecast CAGR (2025 to 2035) 9.0%

Why is the Spectrum Analyzer Market Growing?

The Spectrum Analyzer market is experiencing robust growth, primarily driven by the rising demand for precise frequency measurement and monitoring across multiple industries. Expanding applications in wireless communications, defense, aerospace, automotive, and industrial electronics are contributing to higher adoption rates. Continuous technological advancements such as integration of 5G testing capabilities, real-time spectrum analysis, and advanced software-driven measurement functions are significantly enhancing market value.

The shift toward compact, portable, and software-defined devices is enabling field engineers and researchers to perform advanced analysis with increased efficiency. Growing complexity in communication networks, alongside heightened demand for electromagnetic interference testing and signal quality assurance, is further shaping the market. Organizations are increasingly prioritizing reliable spectrum monitoring to optimize bandwidth utilization and ensure compliance with stringent regulatory requirements.

Rising investments in R&D and infrastructure expansion, particularly in wireless technologies and IoT ecosystems, are creating sustained growth opportunities As industries expand digital adoption and connectivity intensifies globally, spectrum analyzers are expected to remain a critical tool in advancing innovation, ensuring reliability, and maintaining performance efficiency across diverse sectors.

Segmental Analysis:

The spectrum analyzer market is segmented by network technology, offering, type, end user, form factor, and geographic regions. By network technology, spectrum analyzer market is divided into Wireless and Wired. In terms of offering, spectrum analyzer market is classified into Product and Software. Based on type, spectrum analyzer market is segmented into Swept-Tuned Spectrum Analyzer, Vector Signal Spectrum Analyzer, Real-Time Spectrum Analyzer, Fast Fourier Transform (FFT), and Parallel Filter Analyzer. By end user, spectrum analyzer market is segmented into IT & Telecommunication, Medical & Healthcare, Semiconductors & Electronics, RF Tuning Method, Super Heterodyne, and A&D. By form factor, spectrum analyzer market is segmented into Handheld Spectrum Analyzer, Portable Spectrum Analyzer, and Benchtop Spectrum Analyzer. Regionally, the spectrum analyzer industry is classified into North America, Latin America, Western Europe, Eastern Europe, Balkan & Baltic Countries, Russia & Belarus, Central Asia, East Asia, South Asia & Pacific, and the Middle East & Africa.
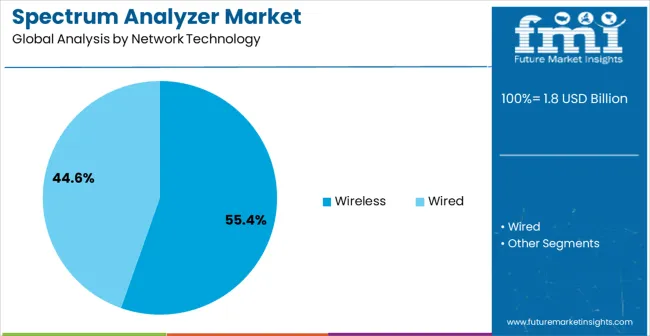
Insights into the Wireless Network Technology Segment

Spectrum Analyzer Market Analysis By Network Technology

The wireless network technology segment is projected to account for 55.4% of the Spectrum Analyzer market revenue in 2025, positioning it as the leading network technology. This dominance is being driven by the expansion of wireless communication systems, including 5G networks, Wi-Fi 6, and IoT ecosystems, which demand precise spectrum monitoring. Spectrum analyzers are being increasingly deployed for identifying interference, testing signal integrity, and ensuring compliance with regulatory standards in wireless environments.

The capability to provide real-time insights into frequency distribution and bandwidth utilization is enhancing efficiency for telecom operators, service providers, and enterprises. The rise in mobile connectivity, alongside increasing adoption of wireless infrastructure in smart cities, defense systems, and industrial automation, is further strengthening the role of wireless spectrum analysis.

Technological advancements such as remote monitoring, cloud-enabled analytics, and AI-assisted diagnostics are improving usability and accuracy, thereby boosting adoption As global wireless traffic continues to grow and networks become more complex, spectrum analyzers are expected to remain indispensable in maintaining performance quality and operational reliability.
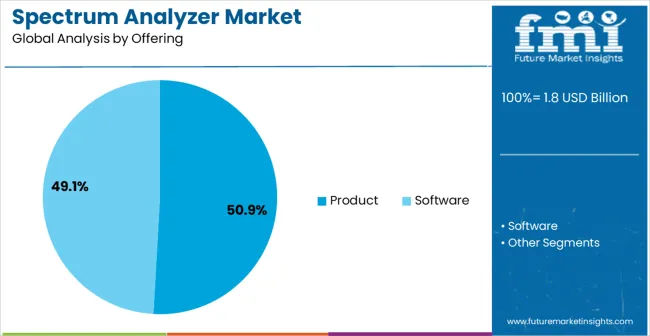
Insights into the Product Offering Segment

Spectrum Analyzer Market Analysis By Offering

The product offering segment is anticipated to hold 50.9% of the Spectrum Analyzer market revenue in 2025, establishing itself as the dominant offering category. Growth is being supported by the increasing demand for hardware-based analyzers capable of delivering high precision and reliability in diverse operational environments. Products in this category include benchtop, portable, and handheld spectrum analyzers, each catering to specific use cases across industries such as aerospace, telecommunications, and automotive.

The widespread preference for physical analyzers stems from their durability, wide measurement range, and ability to function effectively in field and laboratory settings. Integration with advanced software for real-time analytics and data visualization further enhances their functionality, creating greater value for end users.

The scalability of product-based solutions, along with continued innovations in frequency coverage, resolution bandwidth, and measurement speed, is reinforcing demand As industries expand digital operations and face greater challenges in electromagnetic spectrum management, physical products are expected to remain the preferred choice, ensuring reliable performance, accuracy, and long-term usability.
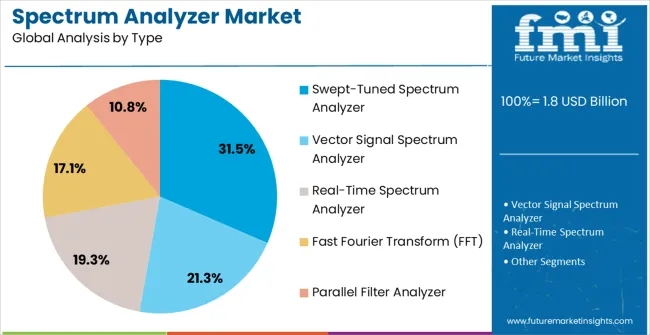
Insights into the Swept-Tuned Spectrum Analyzer Type Segment

Spectrum Analyzer Market Analysis By Type

The swept-tuned spectrum analyzer type is expected to capture 31.5% of the market revenue in 2025, making it the leading type segment. Its leadership is being driven by its established reliability, wide frequency coverage, and cost-effectiveness for both research and commercial applications. Swept-tuned spectrum analyzers are widely used in telecommunications, broadcasting, aerospace, and industrial electronics due to their ability to measure power levels of signals over a defined frequency range with high accuracy.

Their compatibility with diverse testing environments and straightforward operational functionality continues to make them a preferred option for engineers and technicians. Ongoing advancements in bandwidth resolution, sensitivity, and signal processing capabilities are further enhancing their efficiency and scope of applications.

While newer types such as real-time spectrum analyzers are gaining traction, the cost advantages and proven performance of swept-tuned analyzers ensure their continued dominance As industries increasingly require reliable tools for frequency spectrum monitoring and regulatory compliance, the swept-tuned type segment is expected to retain its prominent role in driving market adoption.

Market Overview

Spectrum Analyzer Market Overview

Spectrum analyzers are adopted to analyze signal frequency and amplitude in logarithmic scale when the electric signal pass through the system such as real-time spectrum analyzer. Spectrum analyzers are widely adopted for manufacturing, designing and engaging in the field services and repairs electrical devices and are also used to determine performance, error detection and troubleshooting errors.

Measurement of quality of modulation is carried out for smooth transmission of data and it is crucial in both transmission and receiver end. The important characteristics of spectrum analyzer are signal to noise ratio test and noise figure test which improves overall performance of the system.

With a rising boom in telecommunication industry and increase in wave analysis, spectrum analyzer market has flourished with many new emerging players such as Keysights Technologies and LP Technologies.
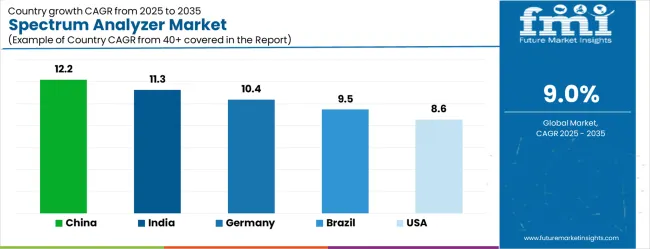
Analysis of Spectrum Analyzer Market By Key Countries

Spectrum Analyzer Market Cagr Analysis By Country

Country CAGR
China 12.2%
India 11.3%
Germany 10.4%
Brazil 9.5%
USA 8.6%
UK 7.7%
Japan 6.8%

Country-wise Analysis

The Spectrum Analyzer Market is expected to register a CAGR of 9.0% during the forecast period, exhibiting varied country level momentum. China leads with the highest CAGR of 12.2%, followed by India at 11.3%. Developed markets such as Germany, France, and the UK continue to expand steadily, while the USA is likely to grow at consistent rates. Japan posts the lowest CAGR at 6.8%, yet still underscores a broadly positive trajectory for the global Spectrum Analyzer Market. In 2024, Germany held a dominant revenue in the Western Europe market and is expected to grow with a CAGR of 10.4%. The USA Spectrum Analyzer Market is estimated to be valued at USD 670.8 million in 2025 and is anticipated to reach a valuation of USD 670.8 million by 2035. Sales are projected to rise at a CAGR of 0.0% over the forecast period between 2025 and 2035. While Japan and South Korea markets are estimated to be valued at USD 93.0 million and USD 62.2 million respectively in 2025.
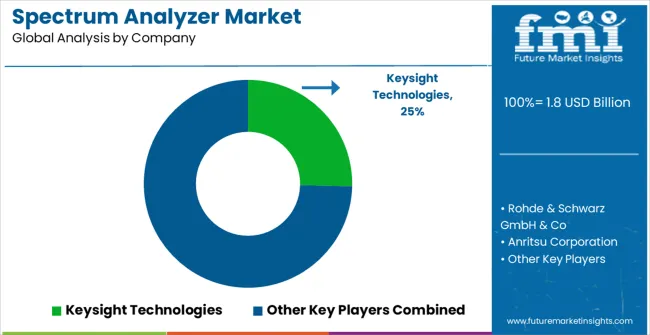
Key Players in the Spectrum Analyzer Market

Spectrum Analyzer Market Analysis By Company

  • Keysight Technologies
  • Rohde & Schwarz GmbH & Co
  • Anritsu Corporation
  • Advantest Corporation
  • B&K Precision Corporation
  • Giga-tronics Incorporated
  • National Instruments Corporation

Scope of the Report

Item Value
Quantitative Units USD 1.8 Billion
Network Technology Wireless and Wired
Offering Product and Software
Type Swept-Tuned Spectrum Analyzer, Vector Signal Spectrum Analyzer, Real-Time Spectrum Analyzer, Fast Fourier Transform (FFT), and Parallel Filter Analyzer
End User IT & Telecommunication, Medical & Healthcare, Semiconductors & Electronics, RF Tuning Method, Super Heterodyne, and A&D
Form Factor Handheld Spectrum Analyzer, Portable Spectrum Analyzer, and Benchtop Spectrum Analyzer
Regions Covered North America, Europe, Asia-Pacific, Latin America, Middle East & Africa
Country Covered United States, Canada, Germany, France, United Kingdom, China, Japan, India, Brazil, South Africa
Key Companies Profiled Keysight Technologies, Rohde & Schwarz GmbH & Co, Anritsu Corporation, Advantest Corporation, B&K Precision Corporation, Giga-tronics Incorporated, and National Instruments Corporation

Spectrum Analyzer Market by Segments

Network Technology:

  • Wireless
  • Wired

Offering:

  • Product
  • Software

Type:

  • Swept-Tuned Spectrum Analyzer
  • Vector Signal Spectrum Analyzer
  • Real-Time Spectrum Analyzer
  • Fast Fourier Transform (FFT)
  • Parallel Filter Analyzer

End User:

  • IT & Telecommunication
  • Medical & Healthcare
  • Semiconductors & Electronics
  • RF Tuning Method
  • Super Heterodyne
  • A&D

Form Factor:

  • Handheld Spectrum Analyzer
  • Portable Spectrum Analyzer
  • Benchtop Spectrum Analyzer

Region:

  • North America
    • USA
    • Canada
    • Mexico
  • Latin America
    • Brazil
    • Chile
    • Rest of Latin America
  • Western Europe
    • Germany
    • UK
    • Italy
    • Spain
    • France
    • Nordic
    • BENELUX
    • Rest of Western Europe
  • Eastern Europe
    • Russia
    • Poland
    • Hungary
    • Balkan & Baltic
    • Rest of Eastern Europe
  • East Asia
    • China
    • Japan
    • South Korea
  • South Asia and Pacific
    • India
    • ASEAN
    • Australia & New Zealand
    • Rest of South Asia and Pacific
  • Middle East & Africa
    • Kingdom of Saudi Arabia
    • Other GCC Countries
    • Turkiye
    • South Africa
    • Other African Union
    • Rest of Middle East & Africa

Table of Content

  1. Executive Summary
    • Global Market Outlook
    • Demand-side Trends
    • Supply-side Trends
    • Technology Roadmap Analysis
    • Analysis and Recommendations
  2. Market Overview
    • Market Coverage / Taxonomy
    • Market Definition / Scope / Limitations
  3. Market Background
    • Market Dynamics
      • Drivers
      • Restraints
      • Opportunity
      • Trends
    • Scenario Forecast
      • Demand in Optimistic Scenario
      • Demand in Likely Scenario
      • Demand in Conservative Scenario
    • Opportunity Map Analysis
    • Product Life Cycle Analysis
    • Supply Chain Analysis
    • Investment Feasibility Matrix
    • Value Chain Analysis
    • PESTLE and Porter’s Analysis
    • Regulatory Landscape
    • Regional Parent Market Outlook
    • Production and Consumption Statistics
    • Import and Export Statistics
  4. Global Market Analysis 2020 to 2024 and Forecast, 2025 to 2035
    • Historical Market Size Value (USD Million) Analysis, 2020 to 2024
    • Current and Future Market Size Value (USD Million) Projections, 2025 to 2035
      • Y-o-Y Growth Trend Analysis
      • Absolute $ Opportunity Analysis
  5. Global Market Pricing Analysis 2020 to 2024 and Forecast 2025 to 2035
  6. Global Market Analysis 2020 to 2024 and Forecast 2025 to 2035, By Network Technology
    • Introduction / Key Findings
    • Historical Market Size Value (USD Million) Analysis By Network Technology , 2020 to 2024
    • Current and Future Market Size Value (USD Million) Analysis and Forecast By Network Technology , 2025 to 2035
      • Wireless
      • Wired
    • Y-o-Y Growth Trend Analysis By Network Technology , 2020 to 2024
    • Absolute $ Opportunity Analysis By Network Technology , 2025 to 2035
  7. Global Market Analysis 2020 to 2024 and Forecast 2025 to 2035, By Offering
    • Introduction / Key Findings
    • Historical Market Size Value (USD Million) Analysis By Offering, 2020 to 2024
    • Current and Future Market Size Value (USD Million) Analysis and Forecast By Offering, 2025 to 2035
      • Product
      • Software
    • Y-o-Y Growth Trend Analysis By Offering, 2020 to 2024
    • Absolute $ Opportunity Analysis By Offering, 2025 to 2035
  8. Global Market Analysis 2020 to 2024 and Forecast 2025 to 2035, By Type
    • Introduction / Key Findings
    • Historical Market Size Value (USD Million) Analysis By Type, 2020 to 2024
    • Current and Future Market Size Value (USD Million) Analysis and Forecast By Type, 2025 to 2035
      • Swept-Tuned Spectrum Analyzer
      • Vector Signal Spectrum Analyzer
      • Real-Time Spectrum Analyzer
      • Fast Fourier Transform (FFT)
      • Parallel Filter Analyzer
    • Y-o-Y Growth Trend Analysis By Type, 2020 to 2024
    • Absolute $ Opportunity Analysis By Type, 2025 to 2035
  9. Global Market Analysis 2020 to 2024 and Forecast 2025 to 2035, By End User
    • Introduction / Key Findings
    • Historical Market Size Value (USD Million) Analysis By End User, 2020 to 2024
    • Current and Future Market Size Value (USD Million) Analysis and Forecast By End User, 2025 to 2035
      • IT & Telecommunication
      • Medical & Healthcare
      • Semiconductors & Electronics
      • RF Tuning Method
      • Super Heterodyne
      • A&D
    • Y-o-Y Growth Trend Analysis By End User, 2020 to 2024
    • Absolute $ Opportunity Analysis By End User, 2025 to 2035
  10. Global Market Analysis 2020 to 2024 and Forecast 2025 to 2035, By Form Factor
    • Introduction / Key Findings
    • Historical Market Size Value (USD Million) Analysis By Form Factor, 2020 to 2024
    • Current and Future Market Size Value (USD Million) Analysis and Forecast By Form Factor, 2025 to 2035
      • Handheld Spectrum Analyzer
      • Portable Spectrum Analyzer
      • Benchtop Spectrum Analyzer
    • Y-o-Y Growth Trend Analysis By Form Factor, 2020 to 2024
    • Absolute $ Opportunity Analysis By Form Factor, 2025 to 2035
  11. Global Market Analysis 2020 to 2024 and Forecast 2025 to 2035, By Region
    • Introduction
    • Historical Market Size Value (USD Million) Analysis By Region, 2020 to 2024
    • Current Market Size Value (USD Million) Analysis and Forecast By Region, 2025 to 2035
      • North America
      • Latin America
      • Western Europe
      • Eastern Europe
      • East Asia
      • South Asia and Pacific
      • Middle East & Africa
    • Market Attractiveness Analysis By Region
  12. North America Market Analysis 2020 to 2024 and Forecast 2025 to 2035, By Country
    • Historical Market Size Value (USD Million) Trend Analysis By Market Taxonomy, 2020 to 2024
    • Market Size Value (USD Million) Forecast By Market Taxonomy, 2025 to 2035
      • By Country
        • USA
        • Canada
        • Mexico
      • By Network Technology
      • By Offering
      • By Type
      • By End User
      • By Form Factor
    • Market Attractiveness Analysis
      • By Country
      • By Network Technology
      • By Offering
      • By Type
      • By End User
      • By Form Factor
    • Key Takeaways
  13. Latin America Market Analysis 2020 to 2024 and Forecast 2025 to 2035, By Country
    • Historical Market Size Value (USD Million) Trend Analysis By Market Taxonomy, 2020 to 2024
    • Market Size Value (USD Million) Forecast By Market Taxonomy, 2025 to 2035
      • By Country
        • Brazil
        • Chile
        • Rest of Latin America
      • By Network Technology
      • By Offering
      • By Type
      • By End User
      • By Form Factor
    • Market Attractiveness Analysis
      • By Country
      • By Network Technology
      • By Offering
      • By Type
      • By End User
      • By Form Factor
    • Key Takeaways
  14. Western Europe Market Analysis 2020 to 2024 and Forecast 2025 to 2035, By Country
    • Historical Market Size Value (USD Million) Trend Analysis By Market Taxonomy, 2020 to 2024
    • Market Size Value (USD Million) Forecast By Market Taxonomy, 2025 to 2035
      • By Country
        • Germany
        • UK
        • Italy
        • Spain
        • France
        • Nordic
        • BENELUX
        • Rest of Western Europe
      • By Network Technology
      • By Offering
      • By Type
      • By End User
      • By Form Factor
    • Market Attractiveness Analysis
      • By Country
      • By Network Technology
      • By Offering
      • By Type
      • By End User
      • By Form Factor
    • Key Takeaways
  15. Eastern Europe Market Analysis 2020 to 2024 and Forecast 2025 to 2035, By Country
    • Historical Market Size Value (USD Million) Trend Analysis By Market Taxonomy, 2020 to 2024
    • Market Size Value (USD Million) Forecast By Market Taxonomy, 2025 to 2035
      • By Country
        • Russia
        • Poland
        • Hungary
        • Balkan & Baltic
        • Rest of Eastern Europe
      • By Network Technology
      • By Offering
      • By Type
      • By End User
      • By Form Factor
    • Market Attractiveness Analysis
      • By Country
      • By Network Technology
      • By Offering
      • By Type
      • By End User
      • By Form Factor
    • Key Takeaways
  16. East Asia Market Analysis 2020 to 2024 and Forecast 2025 to 2035, By Country
    • Historical Market Size Value (USD Million) Trend Analysis By Market Taxonomy, 2020 to 2024
    • Market Size Value (USD Million) Forecast By Market Taxonomy, 2025 to 2035
      • By Country
        • China
        • Japan
        • South Korea
      • By Network Technology
      • By Offering
      • By Type
      • By End User
      • By Form Factor
    • Market Attractiveness Analysis
      • By Country
      • By Network Technology
      • By Offering
      • By Type
      • By End User
      • By Form Factor
    • Key Takeaways
  17. South Asia and Pacific Market Analysis 2020 to 2024 and Forecast 2025 to 2035, By Country
    • Historical Market Size Value (USD Million) Trend Analysis By Market Taxonomy, 2020 to 2024
    • Market Size Value (USD Million) Forecast By Market Taxonomy, 2025 to 2035
      • By Country
        • India
        • ASEAN
        • Australia & New Zealand
        • Rest of South Asia and Pacific
      • By Network Technology
      • By Offering
      • By Type
      • By End User
      • By Form Factor
    • Market Attractiveness Analysis
      • By Country
      • By Network Technology
      • By Offering
      • By Type
      • By End User
      • By Form Factor
    • Key Takeaways
  18. Middle East & Africa Market Analysis 2020 to 2024 and Forecast 2025 to 2035, By Country
    • Historical Market Size Value (USD Million) Trend Analysis By Market Taxonomy, 2020 to 2024
    • Market Size Value (USD Million) Forecast By Market Taxonomy, 2025 to 2035
      • By Country
        • Kingdom of Saudi Arabia
        • Other GCC Countries
        • Turkiye
        • South Africa
        • Other African Union
        • Rest of Middle East & Africa
      • By Network Technology
      • By Offering
      • By Type
      • By End User
      • By Form Factor
    • Market Attractiveness Analysis
      • By Country
      • By Network Technology
      • By Offering
      • By Type
      • By End User
      • By Form Factor
    • Key Takeaways
  19. Key Countries Market Analysis
    • USA
      • Pricing Analysis
      • Market Share Analysis, 2024
        • By Network Technology
        • By Offering
        • By Type
        • By End User
        • By Form Factor
    • Canada
      • Pricing Analysis
      • Market Share Analysis, 2024
        • By Network Technology
        • By Offering
        • By Type
        • By End User
        • By Form Factor
    • Mexico
      • Pricing Analysis
      • Market Share Analysis, 2024
        • By Network Technology
        • By Offering
        • By Type
        • By End User
        • By Form Factor
    • Brazil
      • Pricing Analysis
      • Market Share Analysis, 2024
        • By Network Technology
        • By Offering
        • By Type
        • By End User
        • By Form Factor
    • Chile
      • Pricing Analysis
      • Market Share Analysis, 2024
        • By Network Technology
        • By Offering
        • By Type
        • By End User
        • By Form Factor
    • Germany
      • Pricing Analysis
      • Market Share Analysis, 2024
        • By Network Technology
        • By Offering
        • By Type
        • By End User
        • By Form Factor
    • UK
      • Pricing Analysis
      • Market Share Analysis, 2024
        • By Network Technology
        • By Offering
        • By Type
        • By End User
        • By Form Factor
    • Italy
      • Pricing Analysis
      • Market Share Analysis, 2024
        • By Network Technology
        • By Offering
        • By Type
        • By End User
        • By Form Factor
    • Spain
      • Pricing Analysis
      • Market Share Analysis, 2024
        • By Network Technology
        • By Offering
        • By Type
        • By End User
        • By Form Factor
    • France
      • Pricing Analysis
      • Market Share Analysis, 2024
        • By Network Technology
        • By Offering
        • By Type
        • By End User
        • By Form Factor
    • India
      • Pricing Analysis
      • Market Share Analysis, 2024
        • By Network Technology
        • By Offering
        • By Type
        • By End User
        • By Form Factor
    • ASEAN
      • Pricing Analysis
      • Market Share Analysis, 2024
        • By Network Technology
        • By Offering
        • By Type
        • By End User
        • By Form Factor
    • Australia & New Zealand
      • Pricing Analysis
      • Market Share Analysis, 2024
        • By Network Technology
        • By Offering
        • By Type
        • By End User
        • By Form Factor
    • China
      • Pricing Analysis
      • Market Share Analysis, 2024
        • By Network Technology
        • By Offering
        • By Type
        • By End User
        • By Form Factor
    • Japan
      • Pricing Analysis
      • Market Share Analysis, 2024
        • By Network Technology
        • By Offering
        • By Type
        • By End User
        • By Form Factor
    • South Korea
      • Pricing Analysis
      • Market Share Analysis, 2024
        • By Network Technology
        • By Offering
        • By Type
        • By End User
        • By Form Factor
    • Russia
      • Pricing Analysis
      • Market Share Analysis, 2024
        • By Network Technology
        • By Offering
        • By Type
        • By End User
        • By Form Factor
    • Poland
      • Pricing Analysis
      • Market Share Analysis, 2024
        • By Network Technology
        • By Offering
        • By Type
        • By End User
        • By Form Factor
    • Hungary
      • Pricing Analysis
      • Market Share Analysis, 2024
        • By Network Technology
        • By Offering
        • By Type
        • By End User
        • By Form Factor
    • Kingdom of Saudi Arabia
      • Pricing Analysis
      • Market Share Analysis, 2024
        • By Network Technology
        • By Offering
        • By Type
        • By End User
        • By Form Factor
    • Turkiye
      • Pricing Analysis
      • Market Share Analysis, 2024
        • By Network Technology
        • By Offering
        • By Type
        • By End User
        • By Form Factor
    • South Africa
      • Pricing Analysis
      • Market Share Analysis, 2024
        • By Network Technology
        • By Offering
        • By Type
        • By End User
        • By Form Factor
  20. Market Structure Analysis
    • Competition Dashboard
    • Competition Benchmarking
    • Market Share Analysis of Top Players
      • By Regional
      • By Network Technology
      • By Offering
      • By Type
      • By End User
      • By Form Factor
  21. Competition Analysis
    • Competition Deep Dive
      • Keysight Technologies
        • Overview
        • Product Portfolio
        • Profitability by Market Segments (Product/Age /Sales Channel/Region)
        • Sales Footprint
        • Strategy Overview
          • Marketing Strategy
          • Product Strategy
          • Channel Strategy
      • Rohde & Schwarz GmbH & Co
      • Anritsu Corporation
      • Advantest Corporation
      • B&K Precision Corporation
      • Giga-tronics Incorporated
      • National Instruments Corporation
  22. Assumptions & Acronyms Used
  23. Research Methodology

List of Tables

  • Table 1: Global Market Value (USD Million) Forecast by Region, 2020 to 2035
  • Table 2: Global Market Value (USD Million) Forecast by Network Technology , 2020 to 2035
  • Table 3: Global Market Value (USD Million) Forecast by Offering, 2020 to 2035
  • Table 4: Global Market Value (USD Million) Forecast by Type, 2020 to 2035
  • Table 5: Global Market Value (USD Million) Forecast by End User, 2020 to 2035
  • Table 6: Global Market Value (USD Million) Forecast by Form Factor, 2020 to 2035
  • Table 7: North America Market Value (USD Million) Forecast by Country, 2020 to 2035
  • Table 8: North America Market Value (USD Million) Forecast by Network Technology , 2020 to 2035
  • Table 9: North America Market Value (USD Million) Forecast by Offering, 2020 to 2035
  • Table 10: North America Market Value (USD Million) Forecast by Type, 2020 to 2035
  • Table 11: North America Market Value (USD Million) Forecast by End User, 2020 to 2035
  • Table 12: North America Market Value (USD Million) Forecast by Form Factor, 2020 to 2035
  • Table 13: Latin America Market Value (USD Million) Forecast by Country, 2020 to 2035
  • Table 14: Latin America Market Value (USD Million) Forecast by Network Technology , 2020 to 2035
  • Table 15: Latin America Market Value (USD Million) Forecast by Offering, 2020 to 2035
  • Table 16: Latin America Market Value (USD Million) Forecast by Type, 2020 to 2035
  • Table 17: Latin America Market Value (USD Million) Forecast by End User, 2020 to 2035
  • Table 18: Latin America Market Value (USD Million) Forecast by Form Factor, 2020 to 2035
  • Table 19: Western Europe Market Value (USD Million) Forecast by Country, 2020 to 2035
  • Table 20: Western Europe Market Value (USD Million) Forecast by Network Technology , 2020 to 2035
  • Table 21: Western Europe Market Value (USD Million) Forecast by Offering, 2020 to 2035
  • Table 22: Western Europe Market Value (USD Million) Forecast by Type, 2020 to 2035
  • Table 23: Western Europe Market Value (USD Million) Forecast by End User, 2020 to 2035
  • Table 24: Western Europe Market Value (USD Million) Forecast by Form Factor, 2020 to 2035
  • Table 25: Eastern Europe Market Value (USD Million) Forecast by Country, 2020 to 2035
  • Table 26: Eastern Europe Market Value (USD Million) Forecast by Network Technology , 2020 to 2035
  • Table 27: Eastern Europe Market Value (USD Million) Forecast by Offering, 2020 to 2035
  • Table 28: Eastern Europe Market Value (USD Million) Forecast by Type, 2020 to 2035
  • Table 29: Eastern Europe Market Value (USD Million) Forecast by End User, 2020 to 2035
  • Table 30: Eastern Europe Market Value (USD Million) Forecast by Form Factor, 2020 to 2035
  • Table 31: East Asia Market Value (USD Million) Forecast by Country, 2020 to 2035
  • Table 32: East Asia Market Value (USD Million) Forecast by Network Technology , 2020 to 2035
  • Table 33: East Asia Market Value (USD Million) Forecast by Offering, 2020 to 2035
  • Table 34: East Asia Market Value (USD Million) Forecast by Type, 2020 to 2035
  • Table 35: East Asia Market Value (USD Million) Forecast by End User, 2020 to 2035
  • Table 36: East Asia Market Value (USD Million) Forecast by Form Factor, 2020 to 2035
  • Table 37: South Asia and Pacific Market Value (USD Million) Forecast by Country, 2020 to 2035
  • Table 38: South Asia and Pacific Market Value (USD Million) Forecast by Network Technology , 2020 to 2035
  • Table 39: South Asia and Pacific Market Value (USD Million) Forecast by Offering, 2020 to 2035
  • Table 40: South Asia and Pacific Market Value (USD Million) Forecast by Type, 2020 to 2035
  • Table 41: South Asia and Pacific Market Value (USD Million) Forecast by End User, 2020 to 2035
  • Table 42: South Asia and Pacific Market Value (USD Million) Forecast by Form Factor, 2020 to 2035
  • Table 43: Middle East & Africa Market Value (USD Million) Forecast by Country, 2020 to 2035
  • Table 44: Middle East & Africa Market Value (USD Million) Forecast by Network Technology , 2020 to 2035
  • Table 45: Middle East & Africa Market Value (USD Million) Forecast by Offering, 2020 to 2035
  • Table 46: Middle East & Africa Market Value (USD Million) Forecast by Type, 2020 to 2035
  • Table 47: Middle East & Africa Market Value (USD Million) Forecast by End User, 2020 to 2035
  • Table 48: Middle East & Africa Market Value (USD Million) Forecast by Form Factor, 2020 to 2035

List of Figures

  • Figure 1: Global Market Pricing Analysis
  • Figure 2: Global Market Value (USD Million) Forecast 2020 to 2035
  • Figure 3: Global Market Value Share and BPS Analysis by Network Technology , 2025 and 2035
  • Figure 4: Global Market Y-o-Y Growth Comparison by Network Technology , 2025 to 2035
  • Figure 5: Global Market Attractiveness Analysis by Network Technology
  • Figure 6: Global Market Value Share and BPS Analysis by Offering, 2025 and 2035
  • Figure 7: Global Market Y-o-Y Growth Comparison by Offering, 2025 to 2035
  • Figure 8: Global Market Attractiveness Analysis by Offering
  • Figure 9: Global Market Value Share and BPS Analysis by Type, 2025 and 2035
  • Figure 10: Global Market Y-o-Y Growth Comparison by Type, 2025 to 2035
  • Figure 11: Global Market Attractiveness Analysis by Type
  • Figure 12: Global Market Value Share and BPS Analysis by End User, 2025 and 2035
  • Figure 13: Global Market Y-o-Y Growth Comparison by End User, 2025 to 2035
  • Figure 14: Global Market Attractiveness Analysis by End User
  • Figure 15: Global Market Value Share and BPS Analysis by Form Factor, 2025 and 2035
  • Figure 16: Global Market Y-o-Y Growth Comparison by Form Factor, 2025 to 2035
  • Figure 17: Global Market Attractiveness Analysis by Form Factor
  • Figure 18: Global Market Value (USD Million) Share and BPS Analysis by Region, 2025 and 2035
  • Figure 19: Global Market Y-o-Y Growth Comparison by Region, 2025 to 2035
  • Figure 20: Global Market Attractiveness Analysis by Region
  • Figure 21: North America Market Incremental Dollar Opportunity, 2025 to 2035
  • Figure 22: Latin America Market Incremental Dollar Opportunity, 2025 to 2035
  • Figure 23: Western Europe Market Incremental Dollar Opportunity, 2025 to 2035
  • Figure 24: Eastern Europe Market Incremental Dollar Opportunity, 2025 to 2035
  • Figure 25: East Asia Market Incremental Dollar Opportunity, 2025 to 2035
  • Figure 26: South Asia and Pacific Market Incremental Dollar Opportunity, 2025 to 2035
  • Figure 27: Middle East & Africa Market Incremental Dollar Opportunity, 2025 to 2035
  • Figure 28: North America Market Value Share and BPS Analysis by Country, 2025 and 2035
  • Figure 29: North America Market Value Share and BPS Analysis by Network Technology , 2025 and 2035
  • Figure 30: North America Market Y-o-Y Growth Comparison by Network Technology , 2025 to 2035
  • Figure 31: North America Market Attractiveness Analysis by Network Technology
  • Figure 32: North America Market Value Share and BPS Analysis by Offering, 2025 and 2035
  • Figure 33: North America Market Y-o-Y Growth Comparison by Offering, 2025 to 2035
  • Figure 34: North America Market Attractiveness Analysis by Offering
  • Figure 35: North America Market Value Share and BPS Analysis by Type, 2025 and 2035
  • Figure 36: North America Market Y-o-Y Growth Comparison by Type, 2025 to 2035
  • Figure 37: North America Market Attractiveness Analysis by Type
  • Figure 38: North America Market Value Share and BPS Analysis by End User, 2025 and 2035
  • Figure 39: North America Market Y-o-Y Growth Comparison by End User, 2025 to 2035
  • Figure 40: North America Market Attractiveness Analysis by End User
  • Figure 41: North America Market Value Share and BPS Analysis by Form Factor, 2025 and 2035
  • Figure 42: North America Market Y-o-Y Growth Comparison by Form Factor, 2025 to 2035
  • Figure 43: North America Market Attractiveness Analysis by Form Factor
  • Figure 44: Latin America Market Value Share and BPS Analysis by Country, 2025 and 2035
  • Figure 45: Latin America Market Value Share and BPS Analysis by Network Technology , 2025 and 2035
  • Figure 46: Latin America Market Y-o-Y Growth Comparison by Network Technology , 2025 to 2035
  • Figure 47: Latin America Market Attractiveness Analysis by Network Technology
  • Figure 48: Latin America Market Value Share and BPS Analysis by Offering, 2025 and 2035
  • Figure 49: Latin America Market Y-o-Y Growth Comparison by Offering, 2025 to 2035
  • Figure 50: Latin America Market Attractiveness Analysis by Offering
  • Figure 51: Latin America Market Value Share and BPS Analysis by Type, 2025 and 2035
  • Figure 52: Latin America Market Y-o-Y Growth Comparison by Type, 2025 to 2035
  • Figure 53: Latin America Market Attractiveness Analysis by Type
  • Figure 54: Latin America Market Value Share and BPS Analysis by End User, 2025 and 2035
  • Figure 55: Latin America Market Y-o-Y Growth Comparison by End User, 2025 to 2035
  • Figure 56: Latin America Market Attractiveness Analysis by End User
  • Figure 57: Latin America Market Value Share and BPS Analysis by Form Factor, 2025 and 2035
  • Figure 58: Latin America Market Y-o-Y Growth Comparison by Form Factor, 2025 to 2035
  • Figure 59: Latin America Market Attractiveness Analysis by Form Factor
  • Figure 60: Western Europe Market Value Share and BPS Analysis by Country, 2025 and 2035
  • Figure 61: Western Europe Market Value Share and BPS Analysis by Network Technology , 2025 and 2035
  • Figure 62: Western Europe Market Y-o-Y Growth Comparison by Network Technology , 2025 to 2035
  • Figure 63: Western Europe Market Attractiveness Analysis by Network Technology
  • Figure 64: Western Europe Market Value Share and BPS Analysis by Offering, 2025 and 2035
  • Figure 65: Western Europe Market Y-o-Y Growth Comparison by Offering, 2025 to 2035
  • Figure 66: Western Europe Market Attractiveness Analysis by Offering
  • Figure 67: Western Europe Market Value Share and BPS Analysis by Type, 2025 and 2035
  • Figure 68: Western Europe Market Y-o-Y Growth Comparison by Type, 2025 to 2035
  • Figure 69: Western Europe Market Attractiveness Analysis by Type
  • Figure 70: Western Europe Market Value Share and BPS Analysis by End User, 2025 and 2035
  • Figure 71: Western Europe Market Y-o-Y Growth Comparison by End User, 2025 to 2035
  • Figure 72: Western Europe Market Attractiveness Analysis by End User
  • Figure 73: Western Europe Market Value Share and BPS Analysis by Form Factor, 2025 and 2035
  • Figure 74: Western Europe Market Y-o-Y Growth Comparison by Form Factor, 2025 to 2035
  • Figure 75: Western Europe Market Attractiveness Analysis by Form Factor
  • Figure 76: Eastern Europe Market Value Share and BPS Analysis by Country, 2025 and 2035
  • Figure 77: Eastern Europe Market Value Share and BPS Analysis by Network Technology , 2025 and 2035
  • Figure 78: Eastern Europe Market Y-o-Y Growth Comparison by Network Technology , 2025 to 2035
  • Figure 79: Eastern Europe Market Attractiveness Analysis by Network Technology
  • Figure 80: Eastern Europe Market Value Share and BPS Analysis by Offering, 2025 and 2035
  • Figure 81: Eastern Europe Market Y-o-Y Growth Comparison by Offering, 2025 to 2035
  • Figure 82: Eastern Europe Market Attractiveness Analysis by Offering
  • Figure 83: Eastern Europe Market Value Share and BPS Analysis by Type, 2025 and 2035
  • Figure 84: Eastern Europe Market Y-o-Y Growth Comparison by Type, 2025 to 2035
  • Figure 85: Eastern Europe Market Attractiveness Analysis by Type
  • Figure 86: Eastern Europe Market Value Share and BPS Analysis by End User, 2025 and 2035
  • Figure 87: Eastern Europe Market Y-o-Y Growth Comparison by End User, 2025 to 2035
  • Figure 88: Eastern Europe Market Attractiveness Analysis by End User
  • Figure 89: Eastern Europe Market Value Share and BPS Analysis by Form Factor, 2025 and 2035
  • Figure 90: Eastern Europe Market Y-o-Y Growth Comparison by Form Factor, 2025 to 2035
  • Figure 91: Eastern Europe Market Attractiveness Analysis by Form Factor
  • Figure 92: East Asia Market Value Share and BPS Analysis by Country, 2025 and 2035
  • Figure 93: East Asia Market Value Share and BPS Analysis by Network Technology , 2025 and 2035
  • Figure 94: East Asia Market Y-o-Y Growth Comparison by Network Technology , 2025 to 2035
  • Figure 95: East Asia Market Attractiveness Analysis by Network Technology
  • Figure 96: East Asia Market Value Share and BPS Analysis by Offering, 2025 and 2035
  • Figure 97: East Asia Market Y-o-Y Growth Comparison by Offering, 2025 to 2035
  • Figure 98: East Asia Market Attractiveness Analysis by Offering
  • Figure 99: East Asia Market Value Share and BPS Analysis by Type, 2025 and 2035
  • Figure 100: East Asia Market Y-o-Y Growth Comparison by Type, 2025 to 2035
  • Figure 101: East Asia Market Attractiveness Analysis by Type
  • Figure 102: East Asia Market Value Share and BPS Analysis by End User, 2025 and 2035
  • Figure 103: East Asia Market Y-o-Y Growth Comparison by End User, 2025 to 2035
  • Figure 104: East Asia Market Attractiveness Analysis by End User
  • Figure 105: East Asia Market Value Share and BPS Analysis by Form Factor, 2025 and 2035
  • Figure 106: East Asia Market Y-o-Y Growth Comparison by Form Factor, 2025 to 2035
  • Figure 107: East Asia Market Attractiveness Analysis by Form Factor
  • Figure 108: South Asia and Pacific Market Value Share and BPS Analysis by Country, 2025 and 2035
  • Figure 109: South Asia and Pacific Market Value Share and BPS Analysis by Network Technology , 2025 and 2035
  • Figure 110: South Asia and Pacific Market Y-o-Y Growth Comparison by Network Technology , 2025 to 2035
  • Figure 111: South Asia and Pacific Market Attractiveness Analysis by Network Technology
  • Figure 112: South Asia and Pacific Market Value Share and BPS Analysis by Offering, 2025 and 2035
  • Figure 113: South Asia and Pacific Market Y-o-Y Growth Comparison by Offering, 2025 to 2035
  • Figure 114: South Asia and Pacific Market Attractiveness Analysis by Offering
  • Figure 115: South Asia and Pacific Market Value Share and BPS Analysis by Type, 2025 and 2035
  • Figure 116: South Asia and Pacific Market Y-o-Y Growth Comparison by Type, 2025 to 2035
  • Figure 117: South Asia and Pacific Market Attractiveness Analysis by Type
  • Figure 118: South Asia and Pacific Market Value Share and BPS Analysis by End User, 2025 and 2035
  • Figure 119: South Asia and Pacific Market Y-o-Y Growth Comparison by End User, 2025 to 2035
  • Figure 120: South Asia and Pacific Market Attractiveness Analysis by End User
  • Figure 121: South Asia and Pacific Market Value Share and BPS Analysis by Form Factor, 2025 and 2035
  • Figure 122: South Asia and Pacific Market Y-o-Y Growth Comparison by Form Factor, 2025 to 2035
  • Figure 123: South Asia and Pacific Market Attractiveness Analysis by Form Factor
  • Figure 124: Middle East & Africa Market Value Share and BPS Analysis by Country, 2025 and 2035
  • Figure 125: Middle East & Africa Market Value Share and BPS Analysis by Network Technology , 2025 and 2035
  • Figure 126: Middle East & Africa Market Y-o-Y Growth Comparison by Network Technology , 2025 to 2035
  • Figure 127: Middle East & Africa Market Attractiveness Analysis by Network Technology
  • Figure 128: Middle East & Africa Market Value Share and BPS Analysis by Offering, 2025 and 2035
  • Figure 129: Middle East & Africa Market Y-o-Y Growth Comparison by Offering, 2025 to 2035
  • Figure 130: Middle East & Africa Market Attractiveness Analysis by Offering
  • Figure 131: Middle East & Africa Market Value Share and BPS Analysis by Type, 2025 and 2035
  • Figure 132: Middle East & Africa Market Y-o-Y Growth Comparison by Type, 2025 to 2035
  • Figure 133: Middle East & Africa Market Attractiveness Analysis by Type
  • Figure 134: Middle East & Africa Market Value Share and BPS Analysis by End User, 2025 and 2035
  • Figure 135: Middle East & Africa Market Y-o-Y Growth Comparison by End User, 2025 to 2035
  • Figure 136: Middle East & Africa Market Attractiveness Analysis by End User
  • Figure 137: Middle East & Africa Market Value Share and BPS Analysis by Form Factor, 2025 and 2035
  • Figure 138: Middle East & Africa Market Y-o-Y Growth Comparison by Form Factor, 2025 to 2035
  • Figure 139: Middle East & Africa Market Attractiveness Analysis by Form Factor
  • Figure 140: Global Market – Tier Structure Analysis
  • Figure 141: Global Market – Company Share Analysis

Frequently Asked Questions

How big is the spectrum analyzer market in 2025?

The global spectrum analyzer market is estimated to be valued at USD 1.8 billion in 2025.

What will be the size of spectrum analyzer market in 2035?

The market size for the spectrum analyzer market is projected to reach USD 4.2 billion by 2035.

How much will be the spectrum analyzer market growth between 2025 and 2035?

The spectrum analyzer market is expected to grow at a 9.0% CAGR between 2025 and 2035.

What are the key product types in the spectrum analyzer market?

The key product types in spectrum analyzer market are wireless and wired.

Which offering segment to contribute significant share in the spectrum analyzer market in 2025?

In terms of offering, product segment to command 50.9% share in the spectrum analyzer market in 2025.

Explore Similar Insights

Future Market Insights

Spectrum Analyzer Market

Chat With MaRIA

Chat With

MaRIA

Hi There, I am MaRIA, Your Market Research Intelligence Assistant. How may I help you?