Reports
- Global Locations -
Headquarters
Future Market Insights, Inc.
Christiana Corporate, 200
Continental Drive, Suite 401,
Newark, Delaware - 19713,
United States
Americas
Future Market Insights, Inc.
616 Corporate Way, Suite 2-9018,
Valley Cottage, NY 10989, United States
MEA
Future Market Insights
1602-6 Jumeirah Bay X2 Tower, Plot No: JLT-PH2-X2A,
Jumeirah Lakes Towers, Dubai,
United Arab Emirates
Europe
Future Market Insights
3rd Floor, 207 Regent Street,
W1B 3HH London
United Kingdom
Asia Pacific
Future Market Insights
Office No. 401-A, 4th Floor,
VANTAGE 9, S.No. 36/1/1,
Baner, Pune 411045, India
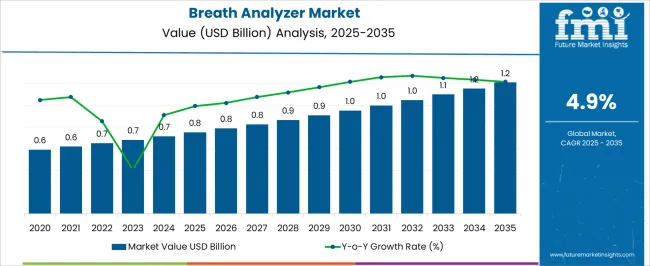
[250 Pages Report] The breath analyzers market is projected likely to register a CAGR of 17% during the forecast period, up from US$ 613 Mn in 2021 to reach a valuation of US$ 3.40 Bn by 2032.
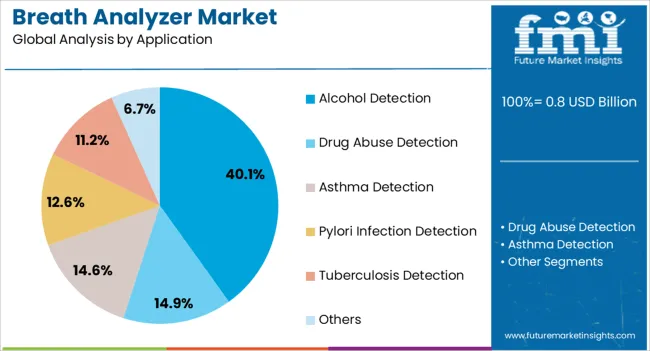
The breath analysis market is anticipated to show promising growth prospects during the forecast period, owing to alcohol and drug abuse, stringent government regulations, and the increasing use of breathalyzers in the identification of various diseases.
Attributes | Details |
---|---|
Breath Analyzers Market Value (2021) | US$ 613 Million |
Breath Analyzers Market Value (2032) | US$ 3.40 Billion |
CAGR (2022-2032) | 17% |
Sales of breath analyzers are expected to rise as a large number of road accident cases are noticed owing to the overconsumption of alcohol while driving. In addition to this, demand for breath analyzers is rising as they are recognized as major equipment in enforcing drink and drive laws.
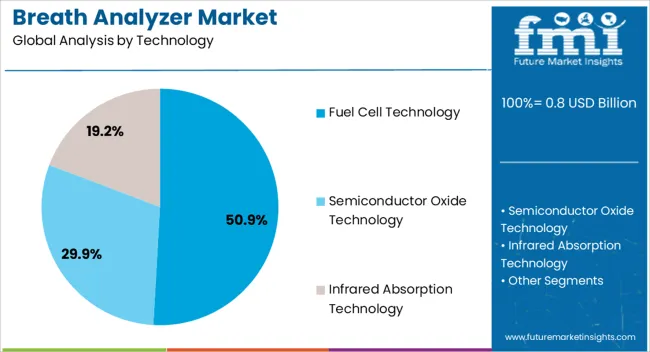
The development in fuel cell technology has been enhanced by a number of factors such as accuracy, portability and reliability of the breath analyzers devices. Fuel cell technology is followed by infrared absorption technology which is commonly used for desktop machines for evidential breath analyzers. This is projected to contribute to the growth of the breath analyzers market share.
The report sheds light on the factors improving the sales of breath analyzers, and, in turn, the opportunities for the market players. However, the breath analyzers market also faces some challenges, which might limit the breath analyzers market share from reaching its potential.
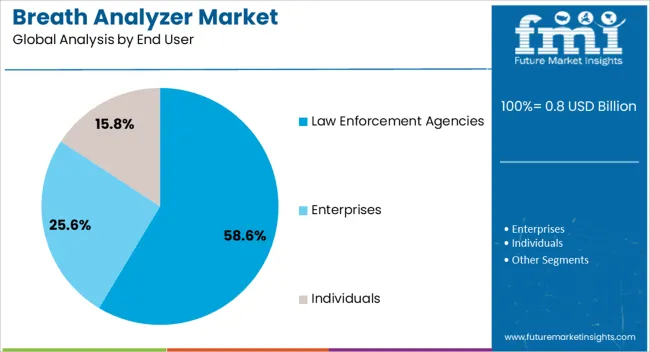
Some of the key breath analyzers market trends promoting the demand for breath analyzers use by personnel as well as by professionals to restrict drunken individuals from entering the company premises and other social places.
The breath analyzers market is driven by technology and is expected to develop rapidly in future years. Due to the breath analysis market’s profitable potential, many manufacturers are focused on developing unique technologies and introducing accurate and simple-to-use breath analyzers on a regular basis.
Don't pay for what you don't need
Customize your report by selecting specific countries or regions and save 30%!
Steadily increasing the adoption rate of breath analyzers is supposed to create lucrative growth opportunities for the global breath analyzers market.
In addition, increasing focus on initiatives from the private and public organizations for developing nanotechnology products that can be integrated with medical devices is presumed to be offering growth opportunities for the breath analyzers market.
Rapid technological innovation, diverse applications, and enhanced portability of breath analyzer devices are some of the other important factors expected to fuel the worldwide growth of the breath analyzer market and propel the sales of breath analyzers over the forecast period.
Since blood sample analysis is required, breath analyzer systems cannot directly measure blood alcohol concentration or content. They do, however, indirectly measure blood alcohol content by calculating the quantity of alcohol in one's exhaled breath.
The blood alcohol concentration test is based on the link between the amount of alcohol in the blood and the amount of alcohol in the breath as it circulates through the lungs. This proves the importance of breath analyzers and reason why demand for breath analyzers is anticipated to increase at rapid pace.
North America accounted for the largest share of the global market for breath analyzers, followed by Europe, Japan, and the Asia Pacific, owing to the high prevalence of various diseases and the increasing number of road accidents, as well as significant advancements in the field of breath analyzer devices and developed healthcare infrastructure.
Due to their low pricing and tight government regulations, emerging countries in the Asia Pacific, the Middle East, and Africa have tremendous demand for breath analyzers and potential for development in the global breath analyzers market.
Asia Pacific holds the second-largest market share for breath analysis and is expected to expand the fastest. Increasing alcohol consumption, greater research on the medical applications of breathalysers, and the development of improved breath analyzers are among the primary drivers driving Asia Pacific breath analyzers market growth.
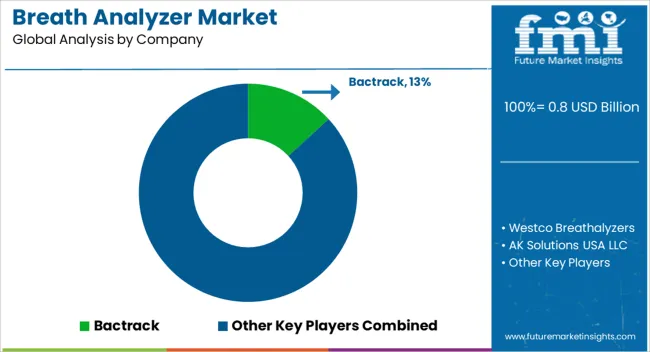
Drägerwerk AG & Co. KGaA, EnviteC-Wismar GmbH, Lifeloc Technologies, BACtrack, Inc., Quest Products, Inc., Akers Biosciences, Inc., Intoximeter, Inc., AK GlobalTech Corporation, and Alcohol Countermeasure Systems Corporation are some of the prominent worldwide companies in the breath analyzers global market. The market for breath analyzers is fragmented, with a few worldwide competitors and several local, domestic businesses, notably in Europe and Asia Pacific.
The report consists of key players contributing to the breath analyzers market share. It also consists of organic and inorganic growth strategies adopted by market players to improve their market positions. This exclusive report analysis the competitive landscape and breath analyzers market share acquired by players to strengthen their market position.
Get the data you need at a Fraction of the cost
Personalize your report by choosing insights you need
and save 40%!
Report Attribute | Details |
---|---|
Growth rate | CAGR of 17% from 2022 to 2032 |
Base year for estimation | 2021 |
Historical data | 2015 to 2020 |
Forecast period | 2022 to 2032 |
Quantitative units | Revenue in USD million, volume in kilotons, and CAGR from 2022 to 2032 |
Report coverage | Revenue forecast, volume forecast, company ranking, competitive landscape, growth factors, and trends, Pricing Analysis, |
Segments covered | Technology, application, end user, region |
Regional scope | North America; Western Europe, Eastern Europe, Middle East, Africa, ASEAN, South Asia, Rest of Asia, Australia and New Zealand |
Country scope | USA; Canada; Mexico; Germany; UK; France; Italy; Spain; Russia; Belgium; Poland; Czech Republic; China; India; Japan; Australia; Brazil; Argentina; Colombia; Saudi Arabia; UAE; Iran; South Africa |
Key companies profiled | Drägerwerk AG & Co. KGaA, EnviteC-Wismar GmbH, Lifeloc Technologies, BACtrack, Inc., Quest Products, Inc., Akers Biosciences, Inc., Intoximeter, Inc., AK GlobalTech Corporation, and Alcohol Countermeasure Systems Corporation |
Customization scope | Free report customization (equivalent to up to 8 analysts working days) with purchase. Addition or alteration to country, regional & segment scope. |
Pricing and purchase options | Avail customized purchase options to meet your exact research needs. |
1. Executive Summary 1.1. Global Market Outlook 1.2. Demand-side Trends 1.3. Supply-side Trends 1.4. Technology Roadmap Analysis 1.5. Analysis and Recommendations 2. Market Overview 2.1. Market Coverage / Taxonomy 2.2. Market Definition / Scope / Limitations 3. Market Background 3.1. Market Dynamics 3.1.1. Drivers 3.1.2. Restraints 3.1.3. Opportunity 3.1.4. Trends 3.2. Scenario Forecast 3.2.1. Demand in Optimistic Scenario 3.2.2. Demand in Likely Scenario 3.2.3. Demand in Conservative Scenario 3.3. Opportunity Map Analysis 3.4. Product Life Cycle Analysis 3.5. Supply Chain Analysis 3.5.1. Supply Side Participants and their Roles 3.5.1.1. Producers 3.5.1.2. Mid-Level Participants (Traders/ Agents/ Brokers) 3.5.1.3. Wholesalers and Distributors 3.5.2. Value Added and Value Created at Node in the Supply Chain 3.5.3. List of Raw Material Suppliers 3.5.4. List of Existing and Potential Buyer’s 3.6. Investment Feasibility Matrix 3.7. Value Chain Analysis 3.7.1. Profit Margin Analysis 3.7.2. Wholesalers and Distributors 3.7.3. Retailers 3.8. PESTLE and Porter’s Analysis 3.9. Regulatory Landscape 3.9.1. By Key Regions 3.9.2. By Key Countries 3.10. Regional Parent Market Outlook 3.11. Production and Consumption Statistics 3.12. Import and Export Statistics 4. Global Market Analysis 2017-2021 and Forecast, 2022-2032 4.1. Historical Market Size Value (US$ Mn) & Volume (Units) Analysis, 2017-2021 4.2. Current and Future Market Size Value (US$ Mn) & Volume (Units) Projections, 2022-2032 4.2.1. Y-o-Y Growth Trend Analysis 4.2.2. Absolute $ Opportunity Analysis 5. Global Market Analysis 2017-2021 and Forecast 2022-2032, By Products 5.1. Introduction / Key Findings 5.2. Historical Market Size Value (US$ Mn) & Volume (Units) Analysis By Products, 2017-2021 5.3. Current and Future Market Size Value (US$ Mn) & Volume (Units) Analysis and Forecast By Products, 2022-2032 5.3.1. Professional Grade Breathalyzers 5.3.2. Personal Breathalyzers 5.3.3. Smartphone Based Breathalyzers 5.4. Y-o-Y Growth Trend Analysis By Products, 2017-2021 5.5. Absolute $ Opportunity Analysis By Products, 2022-2032 Deep-dive segmentation will be available in the sample on request 6. Global Market Analysis 2017-2021 and Forecast 2022-2032, By Technology 6.1. Introduction / Key Findings 6.2. Historical Market Size Value (US$ Mn) & Volume (Units) Analysis By Technology, 2017-2021 6.3. Current and Future Market Size Value (US$ Mn) & Volume (Units) Analysis and Forecast By Technology, 2022-2032 6.3.1. Fuel Cell Technology 6.3.2. Semiconductor Sensors 6.3.3. Near Infrared Absorption 6.3.4. Liquid Crystal Display 6.3.5. Gas Chromatography 6.4. Y-o-Y Growth Trend Analysis By Technology, 2017-2021 6.5. Absolute $ Opportunity Analysis By Technology, 2022-2032 Deep-dive segmentation will be available in the sample on request 7. Global Market Analysis 2017-2021 and Forecast 2022-2032, By End User 7.1. Introduction / Key Findings 7.2. Historical Market Size Value (US$ Mn) & Volume (Units) Analysis By End User, 2017-2021 7.3. Current and Future Market Size Value (US$ Mn) & Volume (Units) Analysis and Forecast By End User, 2022-2032 7.3.1. Federal Agencies 7.3.2. Enterprises 7.3.3. Home Care Setting 7.3.4. Healthcare Settings 7.3.5. Diagnostic Laboratories 7.4. Y-o-Y Growth Trend Analysis By End User, 2017-2021 7.5. Absolute $ Opportunity Analysis By End User, 2022-2032 Deep-dive segmentation will be available in the sample on request 8. Global Market Analysis 2017-2021 and Forecast 2022-2032, By Region 8.1. Introduction 8.2. Historical Market Size Value (US$ Mn) & Volume (Units) Analysis By Region, 2017-2021 8.3. Current Market Size Value (US$ Mn) & Volume (Units) Analysis and Forecast By Region, 2022-2032 8.3.1. North America 8.3.2. Latin America 8.3.3. Europe 8.3.4. East Asia 8.3.5. South Asia & Pacific 8.3.6. MEA 8.4. Market Attractiveness Analysis By Region 9. North America Market Analysis 2017-2021 and Forecast 2022-2032, By Country 9.1. Historical Market Size Value (US$ Mn) & Volume (Units) Trend Analysis By Market Taxonomy, 2017-2021 9.2. Market Size Value (US$ Mn) & Volume (Units) Forecast By Market Taxonomy, 2022-2032 9.2.1. By Country 9.2.1.1. U.S. 9.2.1.2. Canada 9.2.2. By Products 9.2.3. By Technology 9.2.4. By End User 9.3. Market Attractiveness Analysis 9.3.1. By Country 9.3.2. By Products 9.3.3. By Technology 9.3.4. By End User 9.4. Key Takeaways 10. Latin America Market Analysis 2017-2021 and Forecast 2022-2032, By Country 10.1. Historical Market Size Value (US$ Mn) & Volume (Units) Trend Analysis By Market Taxonomy, 2017-2021 10.2. Market Size Value (US$ Mn) & Volume (Units) Forecast By Market Taxonomy, 2022-2032 10.2.1. By Country 10.2.1.1. Brazil 10.2.1.2. Mexico 10.2.1.3. Rest of Latin America 10.2.2. By Products 10.2.3. By Technology 10.2.4. By End User 10.3. Market Attractiveness Analysis 10.3.1. By Country 10.3.2. By Products 10.3.3. By Technology 10.3.4. By End User 10.4. Key Takeaways 11. Europe Market Analysis 2017-2021 and Forecast 2022-2032, By Country 11.1. Historical Market Size Value (US$ Mn) & Volume (Units) Trend Analysis By Market Taxonomy, 2017-2021 11.2. Market Size Value (US$ Mn) & Volume (Units) Forecast By Market Taxonomy, 2022-2032 11.2.1. By Country 11.2.1.1. Germany 11.2.1.2. U.K. 11.2.1.3. France 11.2.1.4. Spain 11.2.1.5. Italy 11.2.1.6. Rest of Europe 11.2.2. By Products 11.2.3. By Technology 11.2.4. By End User 11.3. Market Attractiveness Analysis 11.3.1. By Country 11.3.2. By Products 11.3.3. By Technology 11.3.4. By End User 11.4. Key Takeaways 12. East Asia Market Analysis 2017-2021 and Forecast 2022-2032, By Country 12.1. Historical Market Size Value (US$ Mn) & Volume (Units) Trend Analysis By Market Taxonomy, 2017-2021 12.2. Market Size Value (US$ Mn) & Volume (Units) Forecast By Market Taxonomy, 2022-2032 12.2.1. By Country 12.2.1.1. China 12.2.1.2. Japan 12.2.1.3. South Korea 12.2.2. By Products 12.2.3. By Technology 12.2.4. By End User 12.3. Market Attractiveness Analysis 12.3.1. By Country 12.3.2. By Products 12.3.3. By Technology 12.3.4. By End User 12.4. Key Takeaways 13. South Asia & Pacific Market Analysis 2017-2021 and Forecast 2022-2032, By Country 13.1. Historical Market Size Value (US$ Mn) & Volume (Units) Trend Analysis By Market Taxonomy, 2017-2021 13.2. Market Size Value (US$ Mn) & Volume (Units) Forecast By Market Taxonomy, 2022-2032 13.2.1. By Country 13.2.1.1. India 13.2.1.2. Thailand 13.2.1.3. Indonesia 13.2.1.4. Malaysia 13.2.1.5. Singapore 13.2.1.6. Australia 13.2.1.7. New Zealand 13.2.1.8. Rest of South Asia & Pacific 13.2.2. By Products 13.2.3. By Technology 13.2.4. By End User 13.3. Market Attractiveness Analysis 13.3.1. By Country 13.3.2. By Products 13.3.3. By Technology 13.3.4. By End User 13.4. Key Takeaways 14. MEA Market Analysis 2017-2021 and Forecast 2022-2032, By Country 14.1. Historical Market Size Value (US$ Mn) & Volume (Units) Trend Analysis By Market Taxonomy, 2017-2021 14.2. Market Size Value (US$ Mn) & Volume (Units) Forecast By Market Taxonomy, 2022-2032 14.2.1. By Country 14.2.1.1. GCC Countries 14.2.1.2. South Africa 14.2.1.3. Israel 14.2.1.4. Rest of MEA 14.2.2. By Products 14.2.3. By Technology 14.2.4. By End User 14.3. Market Attractiveness Analysis 14.3.1. By Country 14.3.2. By Products 14.3.3. By Technology 14.3.4. By End User 14.4. Key Takeaways 15. Key Countries Market Analysis 15.1. U.S. 15.1.1. Pricing Analysis 15.1.2. Market Share Analysis, 2021 15.1.2.1. By Products 15.1.2.2. By Technology 15.1.2.3. By End User 15.2. Canada 15.2.1. Pricing Analysis 15.2.2. Market Share Analysis, 2021 15.2.2.1. By Products 15.2.2.2. By Technology 15.2.2.3. By End User 15.3. Brazil 15.3.1. Pricing Analysis 15.3.2. Market Share Analysis, 2021 15.3.2.1. By Products 15.3.2.2. By Technology 15.3.2.3. By End User 15.4. Mexico 15.4.1. Pricing Analysis 15.4.2. Market Share Analysis, 2021 15.4.2.1. By Products 15.4.2.2. By Technology 15.4.2.3. By End User 15.5. Germany 15.5.1. Pricing Analysis 15.5.2. Market Share Analysis, 2021 15.5.2.1. By Products 15.5.2.2. By Technology 15.5.2.3. By End User 15.6. U.K. 15.6.1. Pricing Analysis 15.6.2. Market Share Analysis, 2021 15.6.2.1. By Products 15.6.2.2. By Technology 15.6.2.3. By End User 15.7. France 15.7.1. Pricing Analysis 15.7.2. Market Share Analysis, 2021 15.7.2.1. By Products 15.7.2.2. By Technology 15.7.2.3. By End User 15.8. Spain 15.8.1. Pricing Analysis 15.8.2. Market Share Analysis, 2021 15.8.2.1. By Products 15.8.2.2. By Technology 15.8.2.3. By End User 15.9. Italy 15.9.1. Pricing Analysis 15.9.2. Market Share Analysis, 2021 15.9.2.1. By Products 15.9.2.2. By Technology 15.9.2.3. By End User 15.10. China 15.10.1. Pricing Analysis 15.10.2. Market Share Analysis, 2021 15.10.2.1. By Products 15.10.2.2. By Technology 15.10.2.3. By End User 15.11. Japan 15.11.1. Pricing Analysis 15.11.2. Market Share Analysis, 2021 15.11.2.1. By Products 15.11.2.2. By Technology 15.11.2.3. By End User 15.12. South Korea 15.12.1. Pricing Analysis 15.12.2. Market Share Analysis, 2021 15.12.2.1. By Products 15.12.2.2. By Technology 15.12.2.3. By End User 15.13. India 15.13.1. Pricing Analysis 15.13.2. Market Share Analysis, 2021 15.13.2.1. By Products 15.13.2.2. By Technology 15.13.2.3. By End User 15.14. Thailand 15.14.1. Pricing Analysis 15.14.2. Market Share Analysis, 2021 15.14.2.1. By Products 15.14.2.2. By Technology 15.14.2.3. By End User 15.15. Indonesia 15.15.1. Pricing Analysis 15.15.2. Market Share Analysis, 2021 15.15.2.1. By Products 15.15.2.2. By Technology 15.15.2.3. By End User 15.16. Malaysia 15.16.1. Pricing Analysis 15.16.2. Market Share Analysis, 2021 15.16.2.1. By Products 15.16.2.2. By Technology 15.16.2.3. By End User 15.17. Singapore 15.17.1. Pricing Analysis 15.17.2. Market Share Analysis, 2021 15.17.2.1. By Products 15.17.2.2. By Technology 15.17.2.3. By End User 15.18. Australia 15.18.1. Pricing Analysis 15.18.2. Market Share Analysis, 2021 15.18.2.1. By Products 15.18.2.2. By Technology 15.18.2.3. By End User 15.19. New Zealand 15.19.1. Pricing Analysis 15.19.2. Market Share Analysis, 2021 15.19.2.1. By Products 15.19.2.2. By Technology 15.19.2.3. By End User 15.20. GCC Countries 15.20.1. Pricing Analysis 15.20.2. Market Share Analysis, 2021 15.20.2.1. By Products 15.20.2.2. By Technology 15.20.2.3. By End User 15.21. South Africa 15.21.1. Pricing Analysis 15.21.2. Market Share Analysis, 2021 15.21.2.1. By Products 15.21.2.2. By Technology 15.21.2.3. By End User 15.22. Israel 15.22.1. Pricing Analysis 15.22.2. Market Share Analysis, 2021 15.22.2.1. By Products 15.22.2.2. By Technology 15.22.2.3. By End User 16. Market Structure Analysis 16.1. Competition Dashboard 16.2. Competition Benchmarking 16.3. Market Share Analysis of Top Players 16.3.1. By Regional 16.3.2. By Products 16.3.3. By Technology 16.3.4. By End User 17. Competition Analysis 17.1. Competition Deep Dive 17.1.1. Bactrack 17.1.1.1. Overview 17.1.1.2. Product Portfolio 17.1.1.3. Profitability by Market Segments 17.1.1.4. Sales Footprint 17.1.1.5. Strategy Overview 17.1.1.5.1. Marketing Strategy 17.1.1.5.2. Product Strategy 17.1.1.5.3. Channel Strategy 17.1.2. Westco Breathalyzers 17.1.2.1. Overview 17.1.2.2. Product Portfolio 17.1.2.3. Profitability by Market Segments 17.1.2.4. Sales Footprint 17.1.2.5. Strategy Overview 17.1.2.5.1. Marketing Strategy 17.1.2.5.2. Product Strategy 17.1.2.5.3. Channel Strategy 17.1.3. AK Solutions, USA, LLC 17.1.3.1. Overview 17.1.3.2. Product Portfolio 17.1.3.3. Profitability by Market Segments 17.1.3.4. Sales Footprint 17.1.3.5. Strategy Overview 17.1.3.5.1. Marketing Strategy 17.1.3.5.2. Product Strategy 17.1.3.5.3. Channel Strategy 17.1.4. Alco Check International 17.1.4.1. Overview 17.1.4.2. Product Portfolio 17.1.4.3. Profitability by Market Segments 17.1.4.4. Sales Footprint 17.1.4.5. Strategy Overview 17.1.4.5.1. Marketing Strategy 17.1.4.5.2. Product Strategy 17.1.4.5.3. Channel Strategy 17.1.5. Lifeloc Technologies 17.1.5.1. Overview 17.1.5.2. Product Portfolio 17.1.5.3. Profitability by Market Segments 17.1.5.4. Sales Footprint 17.1.5.5. Strategy Overview 17.1.5.5.1. Marketing Strategy 17.1.5.5.2. Product Strategy 17.1.5.5.3. Channel Strategy 17.1.6. Quest products, Inc. 17.1.6.1. Overview 17.1.6.2. Product Portfolio 17.1.6.3. Profitability by Market Segments 17.1.6.4. Sales Footprint 17.1.6.5. Strategy Overview 17.1.6.5.1. Marketing Strategy 17.1.6.5.2. Product Strategy 17.1.6.5.3. Channel Strategy 17.1.7. Akers Biosciences, Inc. 17.1.7.1. Overview 17.1.7.2. Product Portfolio 17.1.7.3. Profitability by Market Segments 17.1.7.4. Sales Footprint 17.1.7.5. Strategy Overview 17.1.7.5.1. Marketing Strategy 17.1.7.5.2. Product Strategy 17.1.7.5.3. Channel Strategy 17.1.8. Intoximeter, Inc. 17.1.8.1. Overview 17.1.8.2. Product Portfolio 17.1.8.3. Profitability by Market Segments 17.1.8.4. Sales Footprint 17.1.8.5. Strategy Overview 17.1.8.5.1. Marketing Strategy 17.1.8.5.2. Product Strategy 17.1.8.5.3. Channel Strategy 17.1.9. Alcohol Countermeasure Systems Corp. 17.1.9.1. Overview 17.1.9.2. Product Portfolio 17.1.9.3. Profitability by Market Segments 17.1.9.4. Sales Footprint 17.1.9.5. Strategy Overview 17.1.9.5.1. Marketing Strategy 17.1.9.5.2. Product Strategy 17.1.9.5.3. Channel Strategy 17.1.10. MPD, Inc. 17.1.10.1. Overview 17.1.10.2. Product Portfolio 17.1.10.3. Profitability by Market Segments 17.1.10.4. Sales Footprint 17.1.10.5. Strategy Overview 17.1.10.5.1. Marketing Strategy 17.1.10.5.2. Product Strategy 17.1.10.5.3. Channel Strategy 17.1.11. AK GlobalTech Corp. 17.1.11.1. Overview 17.1.11.2. Product Portfolio 17.1.11.3. Profitability by Market Segments 17.1.11.4. Sales Footprint 17.1.11.5. Strategy Overview 17.1.11.5.1. Marketing Strategy 17.1.11.5.2. Product Strategy 17.1.11.5.3. Channel Strategy 17.1.12. Envitec Wismar GmbH 17.1.12.1. Overview 17.1.12.2. Product Portfolio 17.1.12.3. Profitability by Market Segments 17.1.12.4. Sales Footprint 17.1.12.5. Strategy Overview 17.1.12.5.1. Marketing Strategy 17.1.12.5.2. Product Strategy 17.1.12.5.3. Channel Strategy 17.1.13. Alcovisor 17.1.13.1. Overview 17.1.13.2. Product Portfolio 17.1.13.3. Profitability by Market Segments 17.1.13.4. Sales Footprint 17.1.13.5. Strategy Overview 17.1.13.5.1. Marketing Strategy 17.1.13.5.2. Product Strategy 17.1.13.5.3. Channel Strategy 17.1.14. Soberlink 17.1.14.1. Overview 17.1.14.2. Product Portfolio 17.1.14.3. Profitability by Market Segments 17.1.14.4. Sales Footprint 17.1.14.5. Strategy Overview 17.1.14.5.1. Marketing Strategy 17.1.14.5.2. Product Strategy 17.1.14.5.3. Channel Strategy 17.1.15. Intoximeters 17.1.15.1. Overview 17.1.15.2. Product Portfolio 17.1.15.3. Profitability by Market Segments 17.1.15.4. Sales Footprint 17.1.15.5. Strategy Overview 17.1.15.5.1. Marketing Strategy 17.1.15.5.2. Product Strategy 17.1.15.5.3. Channel Strategy 18. Assumptions & Acronyms Used 19. Research Methodology
Don't pay for what you don't need
Customize your report by selecting specific countries or regions and save 30%!
Table 1: Global Market Value (US$ Mn) Forecast by Region, 2017-2032 Table 2: Global Market Volume (Units) Forecast by Region, 2017-2032 Table 3: Global Market Value (US$ Mn) Forecast by Products, 2017-2032 Table 4: Global Market Volume (Units) Forecast by Products, 2017-2032 Table 5: Global Market Value (US$ Mn) Forecast by Technology, 2017-2032 Table 6: Global Market Volume (Units) Forecast by Technology, 2017-2032 Table 7: Global Market Value (US$ Mn) Forecast by End User, 2017-2032 Table 8: Global Market Volume (Units) Forecast by End User, 2017-2032 Table 9: North America Market Value (US$ Mn) Forecast by Country, 2017-2032 Table 10: North America Market Volume (Units) Forecast by Country, 2017-2032 Table 11: North America Market Value (US$ Mn) Forecast by Products, 2017-2032 Table 12: North America Market Volume (Units) Forecast by Products, 2017-2032 Table 13: North America Market Value (US$ Mn) Forecast by Technology, 2017-2032 Table 14: North America Market Volume (Units) Forecast by Technology, 2017-2032 Table 15: North America Market Value (US$ Mn) Forecast by End User, 2017-2032 Table 16: North America Market Volume (Units) Forecast by End User, 2017-2032 Table 17: Latin America Market Value (US$ Mn) Forecast by Country, 2017-2032 Table 18: Latin America Market Volume (Units) Forecast by Country, 2017-2032 Table 19: Latin America Market Value (US$ Mn) Forecast by Products, 2017-2032 Table 20: Latin America Market Volume (Units) Forecast by Products, 2017-2032 Table 21: Latin America Market Value (US$ Mn) Forecast by Technology, 2017-2032 Table 22: Latin America Market Volume (Units) Forecast by Technology, 2017-2032 Table 23: Latin America Market Value (US$ Mn) Forecast by End User, 2017-2032 Table 24: Latin America Market Volume (Units) Forecast by End User, 2017-2032 Table 25: Europe Market Value (US$ Mn) Forecast by Country, 2017-2032 Table 26: Europe Market Volume (Units) Forecast by Country, 2017-2032 Table 27: Europe Market Value (US$ Mn) Forecast by Products, 2017-2032 Table 28: Europe Market Volume (Units) Forecast by Products, 2017-2032 Table 29: Europe Market Value (US$ Mn) Forecast by Technology, 2017-2032 Table 30: Europe Market Volume (Units) Forecast by Technology, 2017-2032 Table 31: Europe Market Value (US$ Mn) Forecast by End User, 2017-2032 Table 32: Europe Market Volume (Units) Forecast by End User, 2017-2032 Table 33: East Asia Market Value (US$ Mn) Forecast by Country, 2017-2032 Table 34: East Asia Market Volume (Units) Forecast by Country, 2017-2032 Table 35: East Asia Market Value (US$ Mn) Forecast by Products, 2017-2032 Table 36: East Asia Market Volume (Units) Forecast by Products, 2017-2032 Table 37: East Asia Market Value (US$ Mn) Forecast by Technology, 2017-2032 Table 38: East Asia Market Volume (Units) Forecast by Technology, 2017-2032 Table 39: East Asia Market Value (US$ Mn) Forecast by End User, 2017-2032 Table 40: East Asia Market Volume (Units) Forecast by End User, 2017-2032 Table 41: South Asia & Pacific Market Value (US$ Mn) Forecast by Country, 2017-2032 Table 42: South Asia & Pacific Market Volume (Units) Forecast by Country, 2017-2032 Table 43: South Asia & Pacific Market Value (US$ Mn) Forecast by Products, 2017-2032 Table 44: South Asia & Pacific Market Volume (Units) Forecast by Products, 2017-2032 Table 45: South Asia & Pacific Market Value (US$ Mn) Forecast by Technology, 2017-2032 Table 46: South Asia & Pacific Market Volume (Units) Forecast by Technology, 2017-2032 Table 47: South Asia & Pacific Market Value (US$ Mn) Forecast by End User, 2017-2032 Table 48: South Asia & Pacific Market Volume (Units) Forecast by End User, 2017-2032 Table 49: MEA Market Value (US$ Mn) Forecast by Country, 2017-2032 Table 50: MEA Market Volume (Units) Forecast by Country, 2017-2032 Table 51: MEA Market Value (US$ Mn) Forecast by Products, 2017-2032 Table 52: MEA Market Volume (Units) Forecast by Products, 2017-2032 Table 53: MEA Market Value (US$ Mn) Forecast by Technology, 2017-2032 Table 54: MEA Market Volume (Units) Forecast by Technology, 2017-2032 Table 55: MEA Market Value (US$ Mn) Forecast by End User, 2017-2032 Table 56: MEA Market Volume (Units) Forecast by End User, 2017-2032
Figure 1: Global Market Value (US$ Mn) by Products, 2022-2032 Figure 2: Global Market Value (US$ Mn) by Technology, 2022-2032 Figure 3: Global Market Value (US$ Mn) by End User, 2022-2032 Figure 4: Global Market Value (US$ Mn) by Region, 2022-2032 Figure 5: Global Market Value (US$ Mn) Analysis by Region, 2017-2032 Figure 6: Global Market Volume (Units) Analysis by Region, 2017-2032 Figure 7: Global Market Value Share (%) and BPS Analysis by Region, 2022-2032 Figure 8: Global Market Y-o-Y Growth (%) Projections by Region, 2022-2032 Figure 9: Global Market Value (US$ Mn) Analysis by Products, 2017-2032 Figure 10: Global Market Volume (Units) Analysis by Products, 2017-2032 Figure 11: Global Market Value Share (%) and BPS Analysis by Products, 2022-2032 Figure 12: Global Market Y-o-Y Growth (%) Projections by Products, 2022-2032 Figure 13: Global Market Value (US$ Mn) Analysis by Technology, 2017-2032 Figure 14: Global Market Volume (Units) Analysis by Technology, 2017-2032 Figure 15: Global Market Value Share (%) and BPS Analysis by Technology, 2022-2032 Figure 16: Global Market Y-o-Y Growth (%) Projections by Technology, 2022-2032 Figure 17: Global Market Value (US$ Mn) Analysis by End User, 2017-2032 Figure 18: Global Market Volume (Units) Analysis by End User, 2017-2032 Figure 19: Global Market Value Share (%) and BPS Analysis by End User, 2022-2032 Figure 20: Global Market Y-o-Y Growth (%) Projections by End User, 2022-2032 Figure 21: Global Market Attractiveness by Products, 2022-2032 Figure 22: Global Market Attractiveness by Technology, 2022-2032 Figure 23: Global Market Attractiveness by End User, 2022-2032 Figure 24: Global Market Attractiveness by Region, 2022-2032 Figure 25: North America Market Value (US$ Mn) by Products, 2022-2032 Figure 26: North America Market Value (US$ Mn) by Technology, 2022-2032 Figure 27: North America Market Value (US$ Mn) by End User, 2022-2032 Figure 28: North America Market Value (US$ Mn) by Country, 2022-2032 Figure 29: North America Market Value (US$ Mn) Analysis by Country, 2017-2032 Figure 30: North America Market Volume (Units) Analysis by Country, 2017-2032 Figure 31: North America Market Value Share (%) and BPS Analysis by Country, 2022-2032 Figure 32: North America Market Y-o-Y Growth (%) Projections by Country, 2022-2032 Figure 33: North America Market Value (US$ Mn) Analysis by Products, 2017-2032 Figure 34: North America Market Volume (Units) Analysis by Products, 2017-2032 Figure 35: North America Market Value Share (%) and BPS Analysis by Products, 2022-2032 Figure 36: North America Market Y-o-Y Growth (%) Projections by Products, 2022-2032 Figure 37: North America Market Value (US$ Mn) Analysis by Technology, 2017-2032 Figure 38: North America Market Volume (Units) Analysis by Technology, 2017-2032 Figure 39: North America Market Value Share (%) and BPS Analysis by Technology, 2022-2032 Figure 40: North America Market Y-o-Y Growth (%) Projections by Technology, 2022-2032 Figure 41: North America Market Value (US$ Mn) Analysis by End User, 2017-2032 Figure 42: North America Market Volume (Units) Analysis by End User, 2017-2032 Figure 43: North America Market Value Share (%) and BPS Analysis by End User, 2022-2032 Figure 44: North America Market Y-o-Y Growth (%) Projections by End User, 2022-2032 Figure 45: North America Market Attractiveness by Products, 2022-2032 Figure 46: North America Market Attractiveness by Technology, 2022-2032 Figure 47: North America Market Attractiveness by End User, 2022-2032 Figure 48: North America Market Attractiveness by Country, 2022-2032 Figure 49: Latin America Market Value (US$ Mn) by Products, 2022-2032 Figure 50: Latin America Market Value (US$ Mn) by Technology, 2022-2032 Figure 51: Latin America Market Value (US$ Mn) by End User, 2022-2032 Figure 52: Latin America Market Value (US$ Mn) by Country, 2022-2032 Figure 53: Latin America Market Value (US$ Mn) Analysis by Country, 2017-2032 Figure 54: Latin America Market Volume (Units) Analysis by Country, 2017-2032 Figure 55: Latin America Market Value Share (%) and BPS Analysis by Country, 2022-2032 Figure 56: Latin America Market Y-o-Y Growth (%) Projections by Country, 2022-2032 Figure 57: Latin America Market Value (US$ Mn) Analysis by Products, 2017-2032 Figure 58: Latin America Market Volume (Units) Analysis by Products, 2017-2032 Figure 59: Latin America Market Value Share (%) and BPS Analysis by Products, 2022-2032 Figure 60: Latin America Market Y-o-Y Growth (%) Projections by Products, 2022-2032 Figure 61: Latin America Market Value (US$ Mn) Analysis by Technology, 2017-2032 Figure 62: Latin America Market Volume (Units) Analysis by Technology, 2017-2032 Figure 63: Latin America Market Value Share (%) and BPS Analysis by Technology, 2022-2032 Figure 64: Latin America Market Y-o-Y Growth (%) Projections by Technology, 2022-2032 Figure 65: Latin America Market Value (US$ Mn) Analysis by End User, 2017-2032 Figure 66: Latin America Market Volume (Units) Analysis by End User, 2017-2032 Figure 67: Latin America Market Value Share (%) and BPS Analysis by End User, 2022-2032 Figure 68: Latin America Market Y-o-Y Growth (%) Projections by End User, 2022-2032 Figure 69: Latin America Market Attractiveness by Products, 2022-2032 Figure 70: Latin America Market Attractiveness by Technology, 2022-2032 Figure 71: Latin America Market Attractiveness by End User, 2022-2032 Figure 72: Latin America Market Attractiveness by Country, 2022-2032 Figure 73: Europe Market Value (US$ Mn) by Products, 2022-2032 Figure 74: Europe Market Value (US$ Mn) by Technology, 2022-2032 Figure 75: Europe Market Value (US$ Mn) by End User, 2022-2032 Figure 76: Europe Market Value (US$ Mn) by Country, 2022-2032 Figure 77: Europe Market Value (US$ Mn) Analysis by Country, 2017-2032 Figure 78: Europe Market Volume (Units) Analysis by Country, 2017-2032 Figure 79: Europe Market Value Share (%) and BPS Analysis by Country, 2022-2032 Figure 80: Europe Market Y-o-Y Growth (%) Projections by Country, 2022-2032 Figure 81: Europe Market Value (US$ Mn) Analysis by Products, 2017-2032 Figure 82: Europe Market Volume (Units) Analysis by Products, 2017-2032 Figure 83: Europe Market Value Share (%) and BPS Analysis by Products, 2022-2032 Figure 84: Europe Market Y-o-Y Growth (%) Projections by Products, 2022-2032 Figure 85: Europe Market Value (US$ Mn) Analysis by Technology, 2017-2032 Figure 86: Europe Market Volume (Units) Analysis by Technology, 2017-2032 Figure 87: Europe Market Value Share (%) and BPS Analysis by Technology, 2022-2032 Figure 88: Europe Market Y-o-Y Growth (%) Projections by Technology, 2022-2032 Figure 89: Europe Market Value (US$ Mn) Analysis by End User, 2017-2032 Figure 90: Europe Market Volume (Units) Analysis by End User, 2017-2032 Figure 91: Europe Market Value Share (%) and BPS Analysis by End User, 2022-2032 Figure 92: Europe Market Y-o-Y Growth (%) Projections by End User, 2022-2032 Figure 93: Europe Market Attractiveness by Products, 2022-2032 Figure 94: Europe Market Attractiveness by Technology, 2022-2032 Figure 95: Europe Market Attractiveness by End User, 2022-2032 Figure 96: Europe Market Attractiveness by Country, 2022-2032 Figure 97: East Asia Market Value (US$ Mn) by Products, 2022-2032 Figure 98: East Asia Market Value (US$ Mn) by Technology, 2022-2032 Figure 99: East Asia Market Value (US$ Mn) by End User, 2022-2032 Figure 100: East Asia Market Value (US$ Mn) by Country, 2022-2032 Figure 101: East Asia Market Value (US$ Mn) Analysis by Country, 2017-2032 Figure 102: East Asia Market Volume (Units) Analysis by Country, 2017-2032 Figure 103: East Asia Market Value Share (%) and BPS Analysis by Country, 2022-2032 Figure 104: East Asia Market Y-o-Y Growth (%) Projections by Country, 2022-2032 Figure 105: East Asia Market Value (US$ Mn) Analysis by Products, 2017-2032 Figure 106: East Asia Market Volume (Units) Analysis by Products, 2017-2032 Figure 107: East Asia Market Value Share (%) and BPS Analysis by Products, 2022-2032 Figure 108: East Asia Market Y-o-Y Growth (%) Projections by Products, 2022-2032 Figure 109: East Asia Market Value (US$ Mn) Analysis by Technology, 2017-2032 Figure 110: East Asia Market Volume (Units) Analysis by Technology, 2017-2032 Figure 111: East Asia Market Value Share (%) and BPS Analysis by Technology, 2022-2032 Figure 112: East Asia Market Y-o-Y Growth (%) Projections by Technology, 2022-2032 Figure 113: East Asia Market Value (US$ Mn) Analysis by End User, 2017-2032 Figure 114: East Asia Market Volume (Units) Analysis by End User, 2017-2032 Figure 115: East Asia Market Value Share (%) and BPS Analysis by End User, 2022-2032 Figure 116: East Asia Market Y-o-Y Growth (%) Projections by End User, 2022-2032 Figure 117: East Asia Market Attractiveness by Products, 2022-2032 Figure 118: East Asia Market Attractiveness by Technology, 2022-2032 Figure 119: East Asia Market Attractiveness by End User, 2022-2032 Figure 120: East Asia Market Attractiveness by Country, 2022-2032 Figure 121: South Asia & Pacific Market Value (US$ Mn) by Products, 2022-2032 Figure 122: South Asia & Pacific Market Value (US$ Mn) by Technology, 2022-2032 Figure 123: South Asia & Pacific Market Value (US$ Mn) by End User, 2022-2032 Figure 124: South Asia & Pacific Market Value (US$ Mn) by Country, 2022-2032 Figure 125: South Asia & Pacific Market Value (US$ Mn) Analysis by Country, 2017-2032 Figure 126: South Asia & Pacific Market Volume (Units) Analysis by Country, 2017-2032 Figure 127: South Asia & Pacific Market Value Share (%) and BPS Analysis by Country, 2022-2032 Figure 128: South Asia & Pacific Market Y-o-Y Growth (%) Projections by Country, 2022-2032 Figure 129: South Asia & Pacific Market Value (US$ Mn) Analysis by Products, 2017-2032 Figure 130: South Asia & Pacific Market Volume (Units) Analysis by Products, 2017-2032 Figure 131: South Asia & Pacific Market Value Share (%) and BPS Analysis by Products, 2022-2032 Figure 132: South Asia & Pacific Market Y-o-Y Growth (%) Projections by Products, 2022-2032 Figure 133: South Asia & Pacific Market Value (US$ Mn) Analysis by Technology, 2017-2032 Figure 134: South Asia & Pacific Market Volume (Units) Analysis by Technology, 2017-2032 Figure 135: South Asia & Pacific Market Value Share (%) and BPS Analysis by Technology, 2022-2032 Figure 136: South Asia & Pacific Market Y-o-Y Growth (%) Projections by Technology, 2022-2032 Figure 137: South Asia & Pacific Market Value (US$ Mn) Analysis by End User, 2017-2032 Figure 138: South Asia & Pacific Market Volume (Units) Analysis by End User, 2017-2032 Figure 139: South Asia & Pacific Market Value Share (%) and BPS Analysis by End User, 2022-2032 Figure 140: South Asia & Pacific Market Y-o-Y Growth (%) Projections by End User, 2022-2032 Figure 141: South Asia & Pacific Market Attractiveness by Products, 2022-2032 Figure 142: South Asia & Pacific Market Attractiveness by Technology, 2022-2032 Figure 143: South Asia & Pacific Market Attractiveness by End User, 2022-2032 Figure 144: South Asia & Pacific Market Attractiveness by Country, 2022-2032 Figure 145: MEA Market Value (US$ Mn) by Products, 2022-2032 Figure 146: MEA Market Value (US$ Mn) by Technology, 2022-2032 Figure 147: MEA Market Value (US$ Mn) by End User, 2022-2032 Figure 148: MEA Market Value (US$ Mn) by Country, 2022-2032 Figure 149: MEA Market Value (US$ Mn) Analysis by Country, 2017-2032 Figure 150: MEA Market Volume (Units) Analysis by Country, 2017-2032 Figure 151: MEA Market Value Share (%) and BPS Analysis by Country, 2022-2032 Figure 152: MEA Market Y-o-Y Growth (%) Projections by Country, 2022-2032 Figure 153: MEA Market Value (US$ Mn) Analysis by Products, 2017-2032 Figure 154: MEA Market Volume (Units) Analysis by Products, 2017-2032 Figure 155: MEA Market Value Share (%) and BPS Analysis by Products, 2022-2032 Figure 156: MEA Market Y-o-Y Growth (%) Projections by Products, 2022-2032 Figure 157: MEA Market Value (US$ Mn) Analysis by Technology, 2017-2032 Figure 158: MEA Market Volume (Units) Analysis by Technology, 2017-2032 Figure 159: MEA Market Value Share (%) and BPS Analysis by Technology, 2022-2032 Figure 160: MEA Market Y-o-Y Growth (%) Projections by Technology, 2022-2032 Figure 161: MEA Market Value (US$ Mn) Analysis by End User, 2017-2032 Figure 162: MEA Market Volume (Units) Analysis by End User, 2017-2032 Figure 163: MEA Market Value Share (%) and BPS Analysis by End User, 2022-2032 Figure 164: MEA Market Y-o-Y Growth (%) Projections by End User, 2022-2032 Figure 165: MEA Market Attractiveness by Products, 2022-2032 Figure 166: MEA Market Attractiveness by Technology, 2022-2032 Figure 167: MEA Market Attractiveness by End User, 2022-2032 Figure 168: MEA Market Attractiveness by Country, 2022-2032
Recommendations
Explore Healthcare Insights
View Reports