Breathable Tape Market Outlook (2022-2032)

[250 Pages Report] The global breathable tape market size is expected to reach US$ 8 Billion in 2032. Growing clinical awareness and increase in incidence of injuries accelerate the demand for breathable tape in the future.

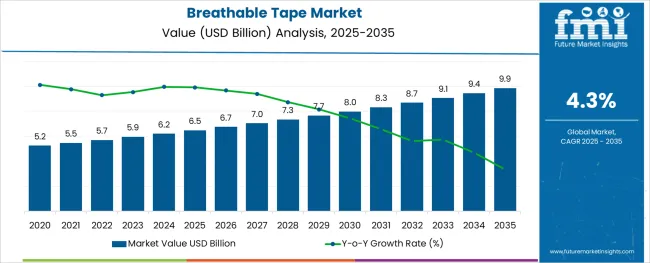
As per FMI, the global breathable tape market stood at US$ 5.7 billion in 2022 and is set to exhibit growth at a CAGR of 4.3% in the forecast period from 2022 to 2032.

Attributes Details
Breathable tapes Market Estimated Size (2022) US$ 5.7 billion
Breathable tapes Market Estimated Size (2032) US$ 8 billion
Breathable tapes Market Estimated Size (2021) US$ 5.4 billion
Breathable tapes Market Estimated CAGR (2022) 4.3%

Due to their use in medical fields, demand for breathable tape is high. It is used by doctors for dressing and injury prevention. Breathable tape is easy to tear and leaves no residue, making sales of breathable tape profitable.

It is waterproof and has a strong adhesion to the skin. It's also used to keep dirt off screen doors and to secure air fresheners to wall paper, which promotes the demand for breathable tapes. Sales of breathable tape are expected to be significant during the forecast period, due to its use in the packaging industry for packaging processes such as bundling products, pallet unitizing, closing corrugated fiberboard boxes, strengthening packages, and so on.

It aids in the sealing of corrugated boxes for export and transportation, which further extends the sales of breathable tape

Don't pay for what you don't need

Customize your report by selecting specific countries or regions and save 30%!

What Drives the Breathable Tape Market?

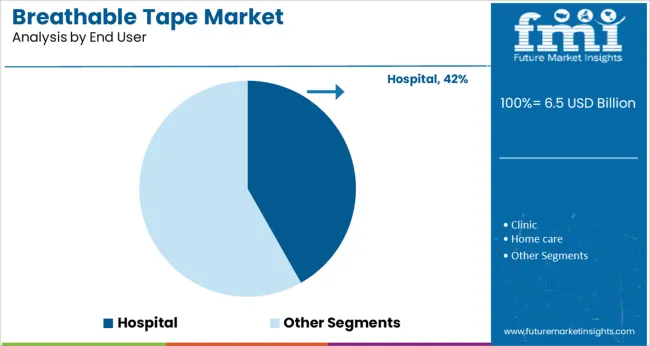
During the projection period, global demand for breathable tape is expected to expand at a good rate. During the predicted period, the sales of breathable tape are mostly influenced by hospitals and clinics. As it is used to cover wounds and injuries during surgery or first aid.
Increased sales of breathable tape are predicted to be aided by an increase in the global accident ratio. Breathable tape is also employed in household applications, which allows breathable tape makers to capture a different market segment and presents an opportunity.

Increased adoption of breathable tape is influenced by the increased development of tape and diversity of tape for medical treatment or surgery. The global demand for breathable tape is likely to be driven by increasing clinical awareness, an increase in the number of injuries, and increased awareness of medical tape for skin injuries.

Over the projection period, rising healthcare spending in developed economies will create more opportunities for breathable tape makers. As a result, the demand for breathable tape is predicted to grow at a strong CAGR of 4.3% over the next several years.
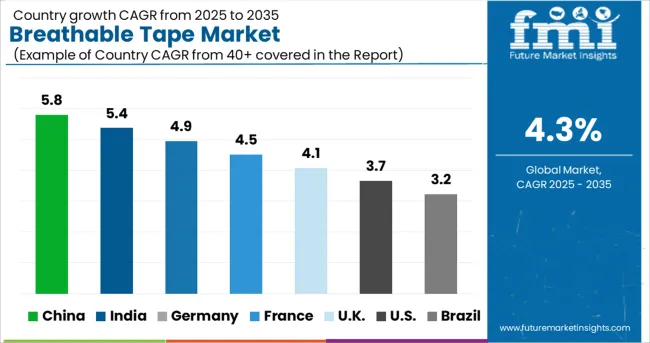
Which Region Dominates the Breathable Tape Market?

North America dominates the breathable tape market share due to the presence of major key players surging awareness about minor injuries and rising prevalence of standardized healthcare facilities in this region.

Asia-Pacific region is the fastest growing region of breathable tape market during the forecast period of 2022-2029, with higher demand for breathable tape. Sales of breathable tape are growing due to the growing clinical awareness and upsurge in the demand of medical tape for injuries associated with skin.

Due to the presence of significant breathable tape manufacturers, sales of breathable tape, Europe is predicted to develop faster than the rest of the world throughout the projection period.
Ismail Sutaria
Ismail Sutaria

Principal Consultant

Talk to Analyst

Find your sweet spots for generating winning opportunities in this market.

What is the Competitive Outlook of the Breathable Tape Market?

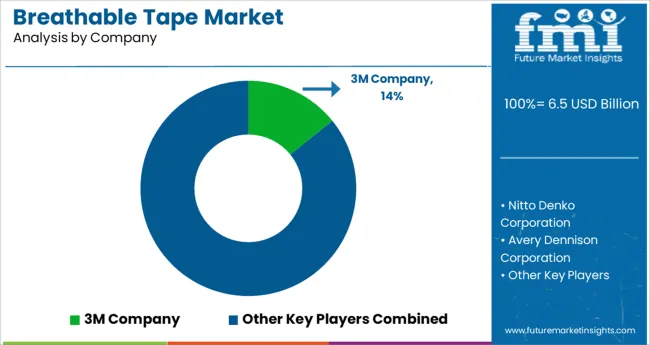
Some of the leading key players in the breathable tape market are 3M Company, Smith & Nephew Inc, Medline Industries Inc, Hartmann Inc, Dynarex Corp, Cardinal Health Inc, Nitto Medical Corp, Godson Tapes Pvt., Johnson & Johnson Consumer Inc, and Beiersdorf Inc, contributing to the substantial breathable tape market share.

  • With some mergers and acquisitions, breathable tape manufacturers are focusing on expanding their global footprint and improving the quality of their tapes. The new and revolutionary product is intended to improve convenience in the healthcare industry, propelling the sales of breathable tape.
  • The 3M Company finalized its acquisition in 2019. Acelity Inc. is a medical technology firm that specializes in improved wound care and specialty surgical procedures. The acquisition will help 3M Company's Medical Solutions division grow.

Report Scope

Report Attribute Details
Growth rate CAGR of 4.3% from 2022 to 2032
Base year for estimation 2021
Historical data 2015 - 2020
Forecast period 2022 - 2032
Quantitative units Revenue in USD Million and CAGR from 2022 to 2032
Report coverage Revenue forecast, volume forecast, company ranking, competitive landscape, growth factors, and trends, Pricing Analysis
Segments covered
  • Material type
  • Product type
  • End user
  • Region
Regional scope
  • North America
  • Latin America
  • Europe
  • Middle East and Africa (MEA)
  • East Asia
  • South Asia
  • Oceania
Country scope
  • U.S
  • Canada
  • Mexico
  • Germany
  • U.K.
  • France
  • Italy
  • Spain
  • Russia
  • Belgium
  • Poland
  • Czech Republic
  • China
  • India
  • Japan
  • Australia
  • Brazil
  • Argentina
  • Colombia
  • Saudi Arabia
  • UAE
  • Iran
  • South Africa
Key companies profiled
  • 3M Company
  • Smith & Nephew Inc
  • Medline Industries Inc
  • Hartmann Inc
  • Dynarex Corp
  • Cardinal Health Inc
  • Nitto Medical Corp
  • Godson Tapes Pvt.
  • Johnson & Johnson Consumer Inc
  • Beiersdorf Inc
Customization scope Free report customization (equivalent to up to 8 analysts working days) with purchase. Addition or alteration to country, regional & segment scope.
Pricing and purchase options Avail customized purchase options to meet your exact research needs.

Get the data you need at a Fraction of the cost

Personalize your report by choosing insights you need
and save 40%!

Key Segments Profiled in the Breathable Tapes Market Survey

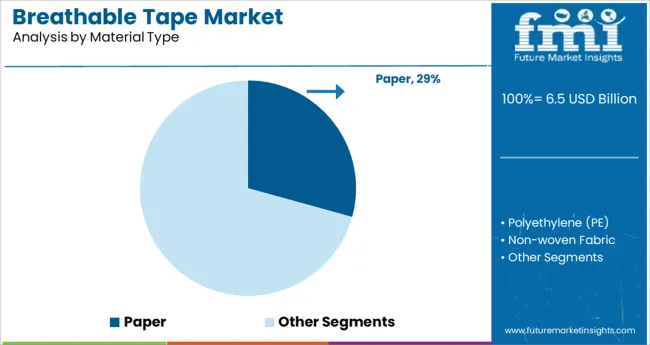
By Material Type:

  • Paper
  • Polyethylene (PE)
  • Non-woven Fabric
  • Others

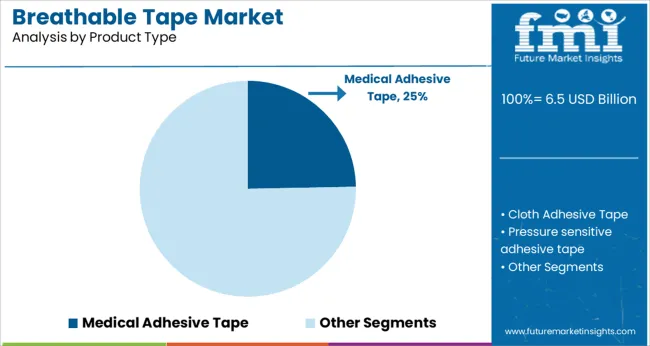
By Product Type:

  • Medical Adhesive Tape
  • Cloth Adhesive Tape
  • Pressure sensitive adhesive tape
  • Waterproof tape
  • Micro pore tape

By End user:

  • Hospital
  • Clinic
  • Home care
  • Others

Frequently Asked Questions

What is the Growth Outlook for the Breathable Tape Market?

The breathable tape market is anticipated to register a CAGR of 4.3% during the forecast period.

What is the Share of the Breathable Tape Market?

The breathable tape market share is anticipated to reach US$ 8 Bn in 2032.

Which is the Key Driver in the Breathable Tape Market?

Demand for the breathable tape market is likely to rise, owing to the growing clinical awareness and increase in incidence of injuries.

Table of Content
1. Executive Summary

    1.1. Global Market Outlook

    1.2. Demand-side Trends

    1.3. Supply-side Trends

    1.4. Material Roadmap Analysis

    1.5. Analysis and Recommendations

2. Market Overview

    2.1. Market Coverage / Taxonomy

    2.2. Market Definition / Scope / Limitations

3. Market Background

    3.1. Market Dynamics

        3.1.1. Drivers

        3.1.2. Restraints

        3.1.3. Opportunity

        3.1.4. Trends

    3.2. Impact of Covid-19

        3.2.1. Demand in Optimistic Scenario

        3.2.2. Demand in Likely Scenario

        3.2.3. Demand in Conservative Scenario

    3.3. Macro Factors and Forecast Factors

    3.4. Value Chain Analysis

        3.4.1. Profit Margin Analysis

        3.4.2. Raw Material Suppliers

        3.4.3. Manufacturers, Wholesalers and Distributors

        3.4.4. End-users/ Customers

    3.5. Regional Parent Market Outlook

    3.6. Production and Consumption Statistics

    3.7. Global Average Pricing Analysis Benchmark

4. Global Breathable Tape Market Analysis 2015-2021 and Forecast, 2022-2032

    4.1. Historical Market Size Value (US$ Mn) & Volume (Sq. Meter) Analysis, 2015-2021

    4.2. Current and Future Market Size Value (US$ Mn) & Volume (Sq. Meter) Projections, 2022-2032

        4.2.1. Y-o-Y Growth Trend Analysis

        4.2.2. Absolute $ Opportunity Analysis

5. Global Breathable Tape Market Analysis 2015–2021 and Forecast 2022–2032, By Material

    5.1. Introduction / Key Findings

    5.2. Historical Market Size Value (US$ Mn) & Volume (Sq. Meter) Analysis by Material, 2015-2021

    5.3. Current and Future Market Size Value (US$ Mn) & Volume (Sq. Meter) Analysis and Forecast by Material, 2022-2032

        5.3.1. Paper

        5.3.2. Plastic

        5.3.3. Fabric

    5.4. Y-o-Y Growth Trend Analysis by Material, 2015-2021

    5.5. Absolute $ Opportunity Analysis by Material, 2022-2032

6. Global Breathable Tape Market Analysis 2015–2021 and Forecast 2022–2032, By Adhesive Type

    6.1. Introduction / Key Findings

    6.2. Historical Market Size Value (US$ Mn) & Volume (Sq. Meter) Analysis by Adhesive Type, 2015-2021

    6.3. Current and Future Market Size Value (US$ Mn) & Volume (Sq. Meter) Analysis and Forecast by Adhesive Type, 2022-2032

        6.3.1. Rubber

        6.3.2. Acrylic

    6.4. Y-o-Y Growth Trend Analysis by Adhesive Type, 2015-2021

    6.5. Absolute $ Opportunity Analysis by Adhesive Type, 2022-2032

7. Global Breathable Tape Market Analysis 2015–2021 and Forecast 2022–2032, By End Use

    7.1. Introduction / Key Findings

    7.2. Historical Market Size Value (US$ Mn) & Volume (Sq. Meter) Analysis by End Use, 2015-2021

    7.3. Current and Future Market Size Value (US$ Mn) & Volume (Sq. Meter) Analysis and Forecast by End Use, 2022-2032

        7.3.1. Pharmaceutical

        7.3.2. Building & Construction

        7.3.3. Electrical & Electronics

    7.4. Y-o-Y Growth Trend Analysis by End Use, 2015-2021

    7.5. Absolute $ Opportunity Analysis by End Use, 2022-2032

8. Global Breathable Tape Market Analysis 2015–2021 and Forecast 2022–2032, By Region

    8.1. Introduction / Key Findings

    8.2. Historical Market Size Value (US$ Mn) & Volume (Sq. Meter) Analysis by Region, 2015-2021

    8.3. Current and Future Market Size Value (US$ Mn) & Volume (Sq. Meter) Analysis and Forecast by Region, 2022-2032

        8.3.1. North America

        8.3.2. Latin America

        8.3.3. Europe

        8.3.4. East Asia

        8.3.5. South Asia

        8.3.6. Oceania

        8.3.7. Middle East and Africa (MEA)

    8.4. Market Attractiveness Analysis, by Region

9. North America Breathable Tape Market Analysis 2015–2021 and Forecast 2022–2032, By Country

    9.1. Historical Market Size Value (US$ Mn) & Volume (Sq. Meter) Trend Analysis by Market Taxonomy, 2015-2021

    9.2. Market Size Value (US$ Mn) & Volume (Sq. Meter) Forecast by Market Taxonomy, 2022-2032

        9.2.1. By Country

            9.2.1.1. U.S.

            9.2.1.2. Canada

        9.2.2. By Material

        9.2.3. By Adhesive Type

        9.2.4. By End Use

    9.3. Market Attractiveness Analysis

        9.3.1. By Country

        9.3.2. By Material

        9.3.3. By Adhesive Type

        9.3.4. By End Use

    9.4. Key Takeaways

10. Latin America Breathable Tape Market Analysis 2015–2021 and Forecast 2022–2032, By Country

    10.1. Historical Market Size Value (US$ Mn) & Volume (Sq. Meter) Trend Analysis by Market Taxonomy, 2015-2021

    10.2. Market Size Value (US$ Mn) & Volume (Sq. Meter) Forecast by Market Taxonomy, 2022-2032

        10.2.1. By Country

            10.2.1.1. Brazil

            10.2.1.2. Mexico

            10.2.1.3. Argentina

            10.2.1.4. Chile

            10.2.1.5. Peru

            10.2.1.6. Rest of Latin America

        10.2.2. By Material

        10.2.3. By Adhesive Type

        10.2.4. By End Use

    10.3. Market Attractiveness Analysis

        10.3.1. By Country

        10.3.2. By Material

        10.3.3. By Adhesive Type

        10.3.4. By End Use

    10.4. Key Takeaways

11. Europe Breathable Tape Market Analysis 2015–2021 and Forecast 2022–2032, By Country

    11.1. Historical Market Size Value (US$ Mn) & Volume (Sq. Meter) Trend Analysis by Market Taxonomy, 2015-2021

    11.2. Market Size Value (US$ Mn) & Volume (Sq. Meter) Forecast by Market Taxonomy, 2022-2032

        11.2.1. By Country

            11.2.1.1. Germany

            11.2.1.2. Italy

            11.2.1.3. France

            11.2.1.4. U.K.

            11.2.1.5. Spain

            11.2.1.6. BENELUX

            11.2.1.7. Nordic

            11.2.1.8. Russia

            11.2.1.9. Poland

            11.2.1.10. Rest of Europe

        11.2.2. By Material

        11.2.3. By Adhesive Type

        11.2.4. By End Use

    11.3. Market Attractiveness Analysis

        11.3.1. By Country

        11.3.2. By Material

        11.3.3. By Adhesive Type

        11.3.4. By End Use

    11.4. Key Takeaways

12. East Asia Breathable Tape Market Analysis 2015–2021 and Forecast 2022–2032, By Country

    12.1. Historical Market Size Value (US$ Mn) & Volume (Sq. Meter) Trend Analysis by Market Taxonomy, 2015-2021

    12.2. Market Size Value (US$ Mn) & Volume (Sq. Meter) Forecast by Market Taxonomy, 2022-2032

        12.2.1. By Country

            12.2.1.1. China

            12.2.1.2. Japan

            12.2.1.3. South Korea

        12.2.2. By Material

        12.2.3. By Adhesive Type

        12.2.4. By End Use

    12.3. Market Attractiveness Analysis

        12.3.1. By Country

        12.3.2. By Material

        12.3.3. By Adhesive Type

        12.3.4. By End Use

    12.4. Key Takeaways

13. South Asia Breathable Tape Market Analysis 2015–2021 and Forecast 2022–2032, By Country

    13.1. Historical Market Size Value (US$ Mn) & Volume (Sq. Meter) Trend Analysis by Market Taxonomy, 2015-2021

    13.2. Market Size Value (US$ Mn) & Volume (Sq. Meter) Forecast by Market Taxonomy, 2022-2032

        13.2.1. By Country

            13.2.1.1. India

            13.2.1.2. Thailand

            13.2.1.3. Malaysia

            13.2.1.4. Indonesia

            13.2.1.5. Rest of South Asia

        13.2.2. By Material

        13.2.3. By Adhesive Type

        13.2.4. By End Use

    13.3. Market Attractiveness Analysis

        13.3.1. By Country

        13.3.2. By Material

        13.3.3. By Adhesive Type

        13.3.4. By End Use

    13.4. Key Takeaways

14. Oceania Breathable Tape Market Analysis 2015–2021 and Forecast 2022–2032, By Country

    14.1. Historical Market Size Value (US$ Mn) & Volume (Sq. Meter) Trend Analysis by Market Taxonomy, 2015-2021

    14.2. Market Size Value (US$ Mn) & Volume (Sq. Meter) Forecast by Market Taxonomy, 2022-2032

        14.2.1. By Country

            14.2.1.1. Australia

            14.2.1.2. New Zealand

        14.2.2. By Material

        14.2.3. By Adhesive Type

        14.2.4. By End Use

    14.3. Market Attractiveness Analysis

        14.3.1. By Country

        14.3.2. By Material

        14.3.3. By Adhesive Type

        14.3.4. By End Use

    14.4. Key Takeaways

15. Middle East & Africa Breathable Tape Market Analysis 2015–2021 and Forecast 2022–2032, By Country

    15.1. Historical Market Size Value (US$ Mn) & Volume (Sq. Meter) Trend Analysis by Market Taxonomy, 2015-2021

    15.2. Market Size Value (US$ Mn) & Volume (Sq. Meter) Forecast by Market Taxonomy, 2022-2032

        15.2.1. By Country

            15.2.1.1. GCC Countries

            15.2.1.2. Turkey

            15.2.1.3. Northern Africa

            15.2.1.4. South Africa

            15.2.1.5. Rest of MEA

        15.2.2. By Material

        15.2.3. By Adhesive Type

        15.2.4. By End Use

    15.3. Market Attractiveness Analysis

        15.3.1. By Country

        15.3.2. By Material

        15.3.3. By Adhesive Type

        15.3.4. By End Use

    15.4. Key Takeaways

16. Country wise Breathable Tape Market Analysis 

    16.1. United States (U.S.)

        16.1.1. Market Share Analysis, 2022

        16.1.2. By Material

        16.1.3. By Adhesive Type

        16.1.4. By End Use

    16.2. Canada

        16.2.1. Market Share Analysis, 2022

        16.2.2. By Material

        16.2.3. By Adhesive Type

        16.2.4. By End Use

    16.3. Brazil

        16.3.1. Market Share Analysis, 2022

        16.3.2. By Material

        16.3.3. By Adhesive Type

        16.3.4. By End Use

    16.4. Mexico

        16.4.1. Market Share Analysis, 2022

        16.4.2. By Material

        16.4.3. By Adhesive Type

        16.4.4. By End Use

    16.5. Germany

        16.5.1. Market Share Analysis, 2022

        16.5.2. By Material

        16.5.3. By Adhesive Type

        16.5.4. By End Use

    16.6. Italy

        16.6.1. Market Share Analysis, 2022

        16.6.2. By Material

        16.6.3. By Adhesive Type

        16.6.4. By End Use

    16.7. France

        16.7.1. Market Share Analysis, 2022

        16.7.2. By Material

        16.7.3. By Adhesive Type

        16.7.4. By End Use

    16.8. Spain

        16.8.1. Market Share Analysis, 2022

        16.8.2. By Material

        16.8.3. By Adhesive Type

        16.8.4. By End Use

    16.9. U.K.

        16.9.1. Market Share Analysis, 2022

        16.9.2. By Material

        16.9.3. By Adhesive Type

        16.9.4. By End Use

    16.10. Russia

        16.10.1. Market Share Analysis, 2022

        16.10.2. By Material

        16.10.3. By Adhesive Type

        16.10.4. By End Use

    16.11. China

        16.11.1. Market Share Analysis, 2022

        16.11.2. By Material

        16.11.3. By Adhesive Type

        16.11.4. By End Use

    16.12. Japan

        16.12.1. Market Share Analysis, 2022

        16.12.2. By Material

        16.12.3. By Adhesive Type

        16.12.4. By End Use

    16.13. India

        16.13.1. Market Share Analysis, 2022

        16.13.2. By Material

        16.13.3. By Adhesive Type

        16.13.4. By End Use

    16.14. GCC Countries

        16.14.1. Market Share Analysis, 2022

        16.14.2. By Material

        16.14.3. By Adhesive Type

        16.14.4. By End Use

    16.15. Australia

        16.15.1. Market Share Analysis, 2022

        16.15.2. By Material

        16.15.3. By Adhesive Type

        16.15.4. By End Use

17. Market Structure Analysis

    17.1. Competition Dashboard

    17.2. Competition Benchmarking

    17.3. Market Share Analysis of Top Players

        17.3.1. By Region

        17.3.2. By Product Portfolio

18. Competition Analysis

    18.1. Competition Deep Dive

        18.1.1. 3M Company

            18.1.1.1. Overview

            18.1.1.2. Product Portfolio

            18.1.1.3. Profitability by Market Segments (Product/Channel/Region)

            18.1.1.4. Sales Footprint

            18.1.1.5. Strategy Overview

                18.1.1.5.1. Marketing Strategy

                18.1.1.5.2. Product Strategy

                18.1.1.5.3. Channel Strategy

        18.1.2. Nitto Denko Corporation

            18.1.2.1. Overview

            18.1.2.2. Product Portfolio

            18.1.2.3. Profitability by Market Segments (Product/Channel/Region)

            18.1.2.4. Sales Footprint

            18.1.2.5. Strategy Overview

                18.1.2.5.1. Marketing Strategy

                18.1.2.5.2. Product Strategy

                18.1.2.5.3. Channel Strategy

        18.1.3. Avery Dennison Corporation

            18.1.3.1. Overview

            18.1.3.2. Product Portfolio

            18.1.3.3. Profitability by Market Segments (Product/Channel/Region)

            18.1.3.4. Sales Footprint

            18.1.3.5. Strategy Overview

                18.1.3.5.1. Marketing Strategy

                18.1.3.5.2. Product Strategy

                18.1.3.5.3. Channel Strategy

        18.1.4. Berry Global Group Inc.

            18.1.4.1. Overview

            18.1.4.2. Product Portfolio

            18.1.4.3. Profitability by Market Segments (Product/Channel/Region)

            18.1.4.4. Sales Footprint

            18.1.4.5. Strategy Overview

                18.1.4.5.1. Marketing Strategy

                18.1.4.5.2. Product Strategy

                18.1.4.5.3. Channel Strategy

        18.1.5. NITTO DENKO CORPORATION

            18.1.5.1. Overview

            18.1.5.2. Product Portfolio

            18.1.5.3. Profitability by Market Segments (Product/Channel/Region)

            18.1.5.4. Sales Footprint

            18.1.5.5. Strategy Overview

                18.1.5.5.1. Marketing Strategy

                18.1.5.5.2. Product Strategy

                18.1.5.5.3. Channel Strategy

        18.1.6. Thermo Scientific™ Capitol

            18.1.6.1. Overview

            18.1.6.2. Product Portfolio

            18.1.6.3. Profitability by Market Segments (Product/Channel/Region)

            18.1.6.4. Sales Footprint

            18.1.6.5. Strategy Overview

                18.1.6.5.1. Marketing Strategy

                18.1.6.5.2. Product Strategy

                18.1.6.5.3. Channel Strategy

        18.1.7. Essity North America Inc.

            18.1.7.1. Overview

            18.1.7.2. Product Portfolio

            18.1.7.3. Profitability by Market Segments (Product/Channel/Region)

            18.1.7.4. Sales Footprint

            18.1.7.5. Strategy Overview

                18.1.7.5.1. Marketing Strategy

                18.1.7.5.2. Product Strategy

                18.1.7.5.3. Channel Strategy

        18.1.8. Henkel Corporation

            18.1.8.1. Overview

            18.1.8.2. Product Portfolio

            18.1.8.3. Profitability by Market Segments (Product/Channel/Region)

            18.1.8.4. Sales Footprint

            18.1.8.5. Strategy Overview

                18.1.8.5.1. Marketing Strategy

                18.1.8.5.2. Product Strategy

                18.1.8.5.3. Channel Strategy

        18.1.9. Dolphin Sutures

            18.1.9.1. Overview

            18.1.9.2. Product Portfolio

            18.1.9.3. Profitability by Market Segments (Product/Channel/Region)

            18.1.9.4. Sales Footprint

            18.1.9.5. Strategy Overview

                18.1.9.5.1. Marketing Strategy

                18.1.9.5.2. Product Strategy

                18.1.9.5.3. Channel Strategy

        18.1.10. Advin Health Care

            18.1.10.1. Overview

            18.1.10.2. Product Portfolio

            18.1.10.3. Profitability by Market Segments (Product/Channel/Region)

            18.1.10.4. Sales Footprint

            18.1.10.5. Strategy Overview

                18.1.10.5.1. Marketing Strategy

                18.1.10.5.2. Product Strategy

                18.1.10.5.3. Channel Strategy

19. Assumptions and Acronyms Used

20. Research Methodology
Recommendations

Packaging

Gaffers Tape Market

September 2024

REP-GB-2593

Upcoming

Packaging

Single-Coated Medical Tape Market

September 2024

REP-GB-7601

Upcoming

Explore Packaging Insights

View Reports