Sunburn Relief Products Market Size and Share Forecast Outlook 2025 to 2035

The Sunburn Relief Products Market is expected to record a valuation of USD 2,803.4 million in 2025 and USD 6,905.6 million in 2035, with an increase of USD 4,102.2 million, which equals a growth of 146% over the decade. The overall expansion represents a CAGR of 9.4% and more than a 2X increase in market size.
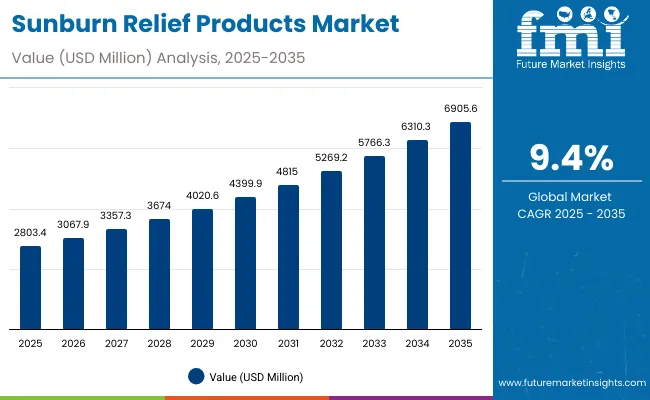
Quick Stats for Sunburn Relief Products Market

  • Sunburn Relief Products Market Value (2025): USD 2,803.4 million
  • Sunburn Relief Products Market Forecast Value (2035): USD 6,905.6 million
  • Sunburn Relief Products Market Forecast CAGR (2025 to 2035): 9.4%
  • Leading Segment in Sunburn Relief Products Market in 2025: Cooling/soothing function (51.5% share)
  • Key Growth Regions in the Sunburn Relief Products Market: North America, Asia-Pacific, Europe
  • Top Key Players in Sunburn Relief Products Market: Banana Boat, Hawaiian Tropic, Nivea Sun, Coppertone, Neutrogena, La Roche-Posay, Aveeno, Bioderma, Solarcaine, Eucerin

Sunburn Relief Products Market

Sunburn Relief Products Market Key Takeaways

Metric Value
Sunburn Relief Products Market Estimated Value in 2025E USD 2,803.4 million
Sunburn Relief Products Market Forecast Value in 2035F USD 6,905.6 million
Forecast CAGR (2025 to 2035) 9.4%

During the first five-year period from 2025 to 2030, the market increases from USD 2,803.4 million to USD 4,399.9 million, adding USD 1,596.5 million, which accounts for 39% of the total decade growth. This phase records steady adoption of OTC after-sun gels, sprays, and lotions, driven by consumer demand for quick relief and hydration. Cooling/soothing products dominate this period as they cater to over 51% of applications, with aloe vera emerging as the leading active ingredient.

The second half from 2030 to 2035 contributes USD 2,505.7 million, equal to 61% of total growth, as the market jumps from USD 4,399.9 million to USD 6,905.6 million. This acceleration is powered by rising consumer preference for fragrance-free and dermatologist-tested claims, premium hydrogel patches, and the penetration of e-commerce channels across emerging markets. Natural actives like panthenol and vitamin E also gain share, while Asia-Pacific markets such as China and India outpace mature regions with CAGRs of 18.8% and 20.8%, respectively.

From 2020 to 2024, the Sunburn Relief Products Market grew steadily as OTC after-sun products gained traction, particularly in North America and Europe. Growth during this period was driven by aloe-based gels and moisturizing lotions, which became household staples for mild to moderate sunburn treatment.

The competitive landscape was dominated by multinational consumer health and skincare brands such as Beiersdorf (Nivea Sun, Eucerin), Johnson & Johnson (Aveeno, Neutrogena), and Edgewell (Banana Boat, Hawaiian Tropic). Differentiation relied on ingredient credibility (aloe vera, panthenol, hydrocortisone), dermatologist-tested claims, and wide retail distribution. E-commerce was emerging but still secondary, contributing less than 15% of market value.

Demand for Sunburn Relief Products is projected to reach USD 2,803.4 million in 2025, with a forecast value of USD 6,905.6 million by 2035. The revenue mix will shift as fragrance-free and sensitive-skin formulations grow to nearly 50% share, while e-commerce and specialty retail accelerate channel penetration.

Traditional mass-market leaders face rising competition from dermocosmetic players (La Roche-Posay, Bioderma) and lifestyle sun-care brands (Sun Bum, Solarcaine) offering premium, clean-label, and reef-friendly positioning. The competitive advantage is moving away from basic after-sun moisturization toward ecosystem strength built on ingredient innovation, multi-claim positioning (cooling + soothing + repair), and recurring seasonal bundles through digital platforms.

Why the Sunburn Relief Products Market is growing?

One strong reason for market growth is the intensification of global UV exposure levels caused by climate change and extreme heat events. Rising frequency of heatwaves in regions like North America, Southern Europe, and Asia-Pacific has increased the incidence of sunburns, driving higher seasonal demand for quick-relief products. Consumers are no longer restricting purchases to summer months; they are stocking products year-round, especially in regions where sun intensity remains high across multiple seasons.

Another key growth driver is the shift toward multifunctional after-sun formulations that combine cooling, soothing, and repair properties in one product. Manufacturers are integrating active ingredients like aloe vera, panthenol, and vitamin E into fragrance-free and sensitive-skin safe lines.

This appeals to consumers seeking targeted efficacy for inflamed skin without harsh additives. The innovation pipeline, particularly in hydrogel patches and spray-based formats, is expanding the premium product base and attracting dermatology-oriented buyers.

Segmental Analysis

Function, product type, active ingredient, claim, end user, channel, and region segment the market. Functions include cooling/soothing, moisturizing, and repair, highlighting key areas of consumer need. Product types cover aloe vera gels, after-sun lotions, sprays or mists, and balms for varied applications. Based on active ingredient, segmentation includes aloe vera, panthenol, menthol/cooling actives, vitamin E, and botanical blends. In terms of claim, categories encompass fragrance-free, natural/organic, dermatologist-tested, and vegan.

End users include households, clinics, spas, and travel kits. Sales channels span pharmacies/drugstores, mass retail, e-commerce, and specialty beauty retail. Regionally, the scope covers North America, Europe, Asia-Pacific, Latin America, and the Middle East and Africa, with country-level analysis for the USA, China, India, Japan, Germany, the UK, Brazil, and South Africa.
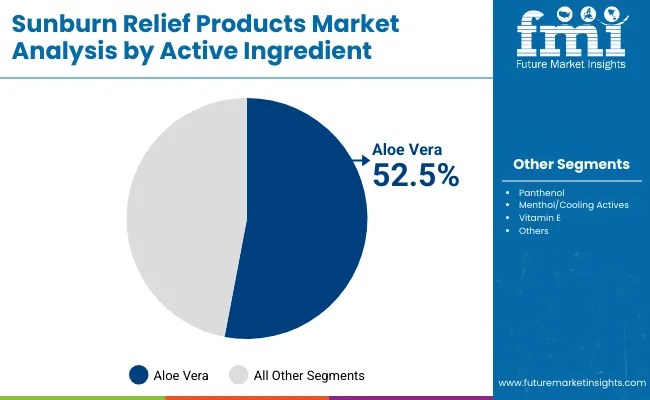
Insights into the Active Ingredient Segment with Aloe Vera Leading in Market Share

Sunburn Relief Products Market By Active Ingredient

Active Ingredient Value Share % 2025
Aloe vera 52.5%
Others 47.5%

The aloe vera segment is projected to contribute 52.5% of the Sunburn Relief Products Market revenue in 2025, maintaining its lead as the dominant active ingredient category. This leadership is driven by aloe’s strong consumer recognition, trusted soothing effect, and cultural acceptance across both mature and emerging markets.

Aloe-based gels and creams have become the first-choice product for mild to moderate burns, supported by high OTC availability in pharmacies and mass retail. Innovation in stabilized aloe formulations and clean-label, preservative-free variants further strengthens its dominance. Aloe vera is expected to remain the cornerstone of after-sun care over the forecast period.
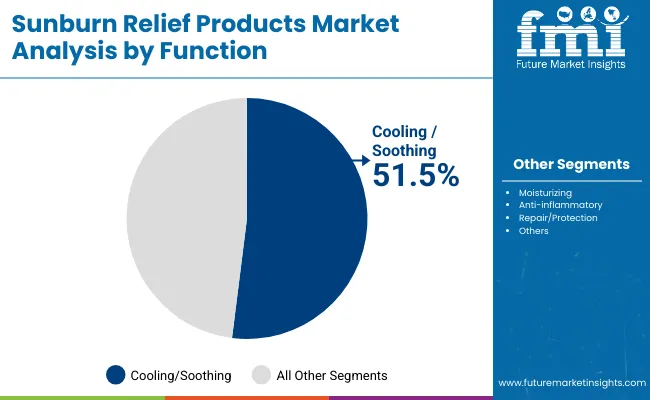
Insights into the Function Segment with Cooling/Soothing Dominating Demand

Sunburn Relief Products Market By Function

Function Value Share % 2025
Cooling/soothing 51.5%
Others 48.5%

The cooling/soothing segment is forecasted to hold 51.5% of the market share in 2025, led by its role in providing instant relief from burning, redness, and discomfort. Consumers favor cooling gels, sprays, and mists for their fast-acting benefits, particularly after outdoor activities, beach exposure, and sports events.

The growth of this segment is supported by the incorporation of menthol, panthenol, and hydrogel technologies that enhance the cooling sensation and extend hydration. With seasonal heatwaves and rising UV indexes increasing the incidence of acute sunburns, cooling/soothing products are expected to retain their leading position across global markets.
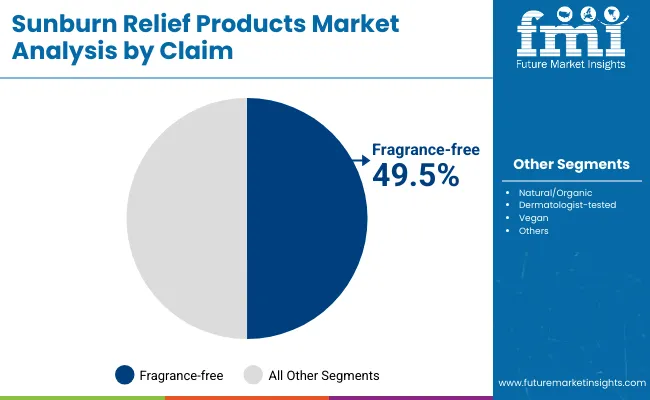
Insights into the Claim Segment with Fragrance-Free Products Gaining Traction

Sunburn Relief Products Market By Claim

Claim Value Share % 2025
Fragrance-free 49.5%
Others 50.5%

The fragrance-free segment is projected to account for 49.5% of the Sunburn Relief Products Market revenue in 2025, establishing it as one of the most influential claim categories. This preference stems from consumer sensitivity toward irritants, with post-burn skin requiring gentle, hypoallergenic care. Brands leveraging fragrance-free claims are gaining stronger traction in dermatology channels and among parents seeking safe after-sun care for children.

Product development is increasingly aligning with this trend, combining fragrance-free positioning with vegan, reef-friendly, and dermatologist-tested assurances. As sensitive-skin demand continues to grow, fragrance-free sunburn relief products are expected to expand their share across both premium and mass-market price tiers.

What are the Drivers, Restraints, and Key Trends of the Sunburn Relief Products Market?

Rising Heatwaves and UV Exposure

The increasing frequency of heatwaves and higher UV index levels are directly driving demand for sunburn relief products. Regions such as North America, Europe, and Asia-Pacific are experiencing longer summers with more extreme temperatures, which heightens the risk of sunburn among outdoor workers, travelers, and beachgoers.

This shift is expanding sales beyond traditional summer months, encouraging year-round stocking. As awareness of UV-related skin damage grows, consumers are prioritizing immediate-relief products like aloe gels, sprays, and hydrogel patches.

Premiumization through Clean-Label and Sensitive-Skin Claims

Consumer preference is shifting toward formulations that combine safety, efficacy, and sustainability, fueling growth in fragrance-free, dermatologist-tested, and reef-friendly products. Sensitive-skin safe positioning is especially appealing in sunburn care, where irritated skin requires non-irritating, gentle solutions.

This trend is encouraging manufacturers to launch premium SKUs with transparent labeling, vegan claims, and natural ingredients such as aloe vera, panthenol, and vitamin E. Premiumization enables higher margins while capturing the rising middle-class segment in Asia-Pacific and affluent buyers in Western markets.

Regulatory Scrutiny of Active Ingredients

Strict regulations on the use of certain topical anesthetics, preservatives, and corticosteroids act as a restraint for the market. Products containing lidocaine or hydrocortisone often require clear labeling, usage restrictions, and in some regions, pharmacist guidance for safe dispensing.

This limits product positioning flexibility and slows innovation cycles. Moreover, heightened consumer awareness of potentially harmful additives has pushed brands to reformulate, raising production costs. Such regulatory and compliance pressures restrict rapid expansion in certain markets and can delay product launches.

Expansion of E-commerce and Seasonal Bundling

A defining trend is the rapid rise of e-commerce as a distribution channel, with brands increasingly offering seasonal bundles that combine sunscreens with after-sun products. Subscription models for summer months, quick delivery options, and online-exclusive SKUs are expanding consumer reach.

Social media campaigns highlight travel kits, hydrogel patches, and multipacks, creating cross-selling opportunities. In emerging markets like China and India, online platforms are accelerating penetration, while in mature regions, digital channels allow premium brands to differentiate with personalized routines and refill programs.
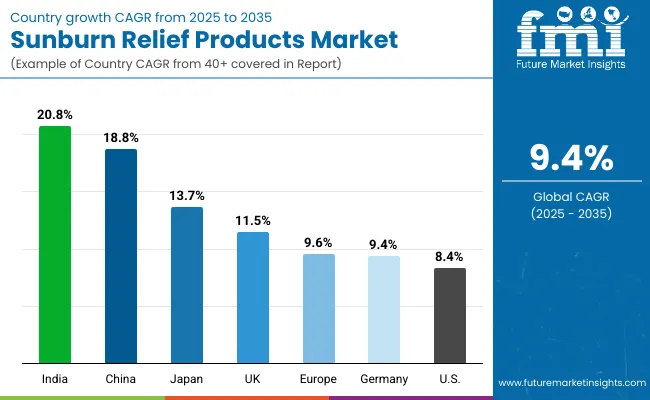
Analysis of Sunburn Relief Products Market By Key Countries

Sunburn Relief Products Market By Country

Country Estimated CAGR (2025 to 2035)
China 18.8%
USA 8.4%
India 20.8%
UK 11.5%
Germany 9.4%
Japan 13.7%

The global Sunburn Relief Products Market shows a clear regional disparity in growth, strongly influenced by climate severity, consumer skincare preferences, and retail expansion.

Asia-Pacific emerges as the fastest-growing region, anchored by India at 20.8% CAGR and China at 18.8% CAGR. India’s rapid acceleration is fueled by rising disposable incomes, growing outdoor leisure activities, and widening pharmacy penetration. Clean-label, aloe-based gels and sprays are gaining traction among urban consumers. China’s surge reflects heightened skincare awareness, premiumization of OTC after-sun lines, and explosive growth of e-commerce platforms that drive seasonal bundling and subscription sales.

Europe maintains strong momentum, led by the UK at 11.5% CAGR and Germany at 9.4% CAGR. Warmer summers, stricter cosmetic regulations, and demand for dermatologist-tested, fragrance-free products underpin growth. Premium dermocosmetic players such as La Roche-Posay, Bioderma, and Eucerin capitalize on consumer trust and pharmacy dominance in distribution. Japan records a CAGR of 13.7%, supported by innovation in hydrogel patches, sensitive-skin formulations, and strong consumer preference for biotech-enhanced actives like panthenol and vitamin E.

North America shows moderate expansion, with the USA at 8.4% CAGR. The market is relatively mature, but steady growth is driven by lifestyle-focused brands (Banana Boat, Coppertone, Neutrogena) and innovation in spray-based delivery formats. Growth is also linked to rising awareness of sun-related skin damage among children and seniors, pushing higher household stocking rates during peak summer.
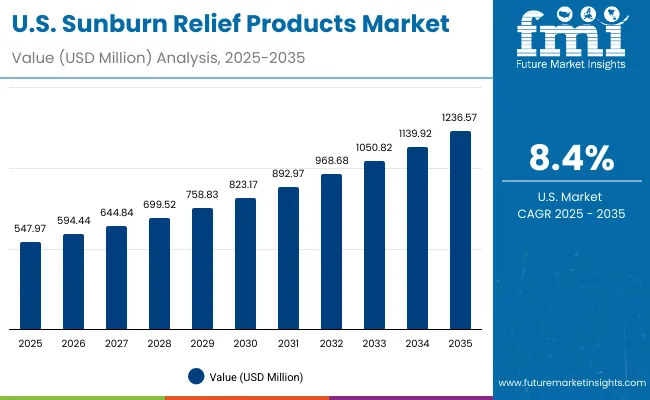
Sales Outlook for Sunburn Relief Products in the United States

United States Sunburn Relief Products Market

Year USA Sunburn Relief Products Market (USD Million)
2025 547.97
2026 594.44
2027 644.84
2028 699.52
2029 758.83
2030 823.17
2031 892.97
2032 968.68
2033 1,050.82
2034 1,139.92
2035 1,236.57

The Sunburn Relief Products Market in the United States is projected to grow at a CAGR of 8.4% from 2025 to 2035, with total value rising from USD 547.97 million in 2025 to USD 1,236.57 million in 2035. Growth is led by the increasing incidence of heatwaves, heightened consumer awareness of UV damage, and the shift toward dermatologist-tested, fragrance-free, and sensitive-skin formulations.

Pharmacies and drugstores remain the dominant distribution channel, though e-commerce is accelerating, especially through multipacks and seasonal bundles. Premium dermocosmetic players are gaining share, leveraging consumer trust in safety and efficacy.

  • Heatwave frequency and UV awareness fueling higher year-round household stocking.
  • Dermatologist-tested and fragrance-free positioning gaining traction among sensitive-skin consumers.
  • E-commerce growth, with online-exclusive bundles and refill packs driving recurring sales.

Growth and Expansion Outlook for Sunburn Relief Products Market in the United Kingdom

The Sunburn Relief Products Market in the United Kingdom is expected to grow at a CAGR of 11.5% from 2025 to 2035, supported by rising awareness of UV-related skin damage, hotter summer conditions, and premium skincare adoption. Consumers are increasingly shifting toward dermatologist-tested and fragrance-free formulations, with aloe-based gels and after-sun lotions leading adoption.

Pharmacies and supermarkets dominate retail distribution, but e-commerce is expanding through multipacks, seasonal kits, and loyalty-driven online platforms. Premium dermocosmetic players such as La Roche-Posay, Bioderma, and Eucerin are gaining share due to strong pharmacist endorsement and consumer trust.

  • Hotter summers and rising UV intensity leading to higher seasonal demand.
  • Dermatologist-tested and fragrance-free claims boosting uptake among sensitive-skin consumers.
  • E-commerce expansion via online pharmacies and premium beauty platforms offering travel kits and subscription models.

Growth and Expansion Outlook for Sunburn Relief Products Market in India

India is witnessing rapid growth in the Sunburn Relief Products Market, which is forecast to expand at a CAGR of 20.8% through 2035, the highest among major global markets. Rising disposable incomes, expanding middle-class lifestyles, and increased outdoor leisure are fueling demand for affordable aloe vera gels, sprays, and after-sun lotions.

Penetration is no longer limited to metros; pharmacies and mass retail in tier-2 and tier-3 cities are reporting double-digit sales growth. Educational campaigns highlighting the dangers of UV exposure, coupled with seasonal peaks during vacations and festivals, are strengthening market adoption. E-commerce platforms are accelerating expansion through low-cost bundles and subscription models.

  • Rising affordability and retail penetration in tier-2 and tier-3 cities boosting nationwide demand.
  • Strong consumer preference for aloe vera and natural ingredients, reflecting India’s herbal heritage.
  • Digital-first sales growth, with online platforms offering low-cost multipacks and seasonal promotions.

Sales Outlook for Sunburn Relief Products in China

The Sunburn Relief Products Market in China is expected to grow at a CAGR of 18.8% from 2025 to 2035, making it one of the fastest-expanding markets globally. Growth is fueled by rising awareness of UV-related skin conditions, increased outdoor leisure activities, and rapid expansion of e-commerce platforms.

Aloe vera gels and cooling sprays dominate demand, with strong traction among younger consumers seeking quick relief and sensitive-skin safe solutions. Premiumization is evident as dermocosmetic players introduce fragrance-free and dermatologist-tested lines, while domestic brands compete aggressively on price through online marketplaces.
  • E-commerce platforms (JD.com, Tmall, Douyin) accelerating access to after-sun kits and seasonal bundles.
  • Strong consumer preference for aloe vera and cooling actives, particularly among millennials and Gen Z.
  • Premium dermocosmetic brands gaining share through sensitive-skin, clean-label, and fragrance-free positioning.

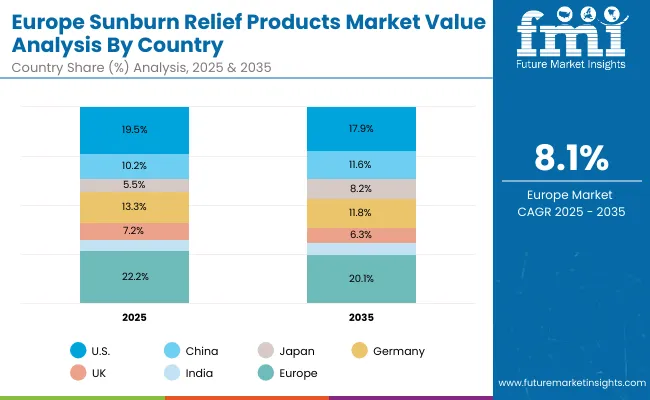
In-depth Analysis of Sunburn Relief Products in Germany

Germany Sunburn Relief Products Market

Country 2025 Share (%)
USA 19.5%
China 10.2%
Japan 5.5%
Germany 13.3%
UK 7.2%
India 4.5%
Country 2035 Share (%)
USA 17.9%
China 11.6%
Japan 8.2%
Germany 11.8%
UK 6.3%
India 5.1%

The Sunburn Relief Products Market in Germany is projected to grow at a CAGR of 8.1% from 2025 to 2035, increasing from USD 372.9 million in 2025 to USD 814.9 million in 2035. Germany’s growth is supported by strong consumer trust in pharmacy-driven distribution, where brands like Eucerin, La Roche-Posay, and Bioderma dominate.

Stricter EU cosmetic regulations reinforce demand for fragrance-free, dermatologist-tested, and sensitive-skin formulations. Rising incidence of heatwaves, combined with increased travel and leisure, is boosting year-round adoption of aloe vera gels, cooling sprays, and moisturizing lotions.
  • Pharmacy dominance ensuring premium dermocosmetic brand penetration.
  • Strict EU compliance standards driving clean-label and fragrance-free products.
  • Seasonal heatwaves and leisure travel raising demand for cooling and soothing after-sun care.

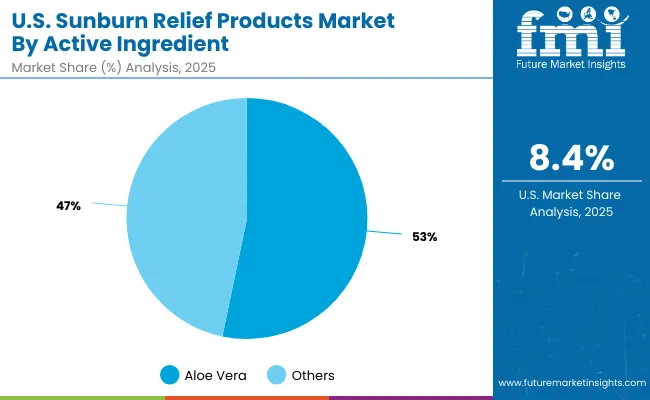
Growth Outlook for Sunburn Relief Products Market in USA

Usa Sunburn Relief Products Market

USA by Active Ingredient Value Share % 2025
Aloe vera 53.3%
Others 46.7%

The Sunburn Relief Products Market in Germany is projected to grow at a CAGR of 8.1% between 2025 and 2035, expanding from USD 372.9 million in 2025 to USD 814.9 million in 2035. Germany’s strong pharmacy-led distribution network and a consumer base that prioritizes dermatologist-tested, fragrance-free, and sensitive-skin formulations support growth.

Leading brands such as Eucerin, Bioderma, and La Roche-Posay benefit from pharmacist endorsements and compliance with EU cosmetic standards, which emphasize clean-label, hypoallergenic, and safe ingredient use. Seasonal heatwaves and increased outdoor leisure activities further amplify demand for aloe vera gels, cooling sprays, and repair lotions.
  • Pharmacy dominance giving premium dermocosmetic brands a competitive edge.
  • Strict EU compliance standards accelerating clean-label and fragrance-free adoption.
  • Hotter summers boosting demand for cooling and soothing after-sun products.

Opportunity Analysis of China Sunburn Relief Products Market

China Sunburn Relief Products Market

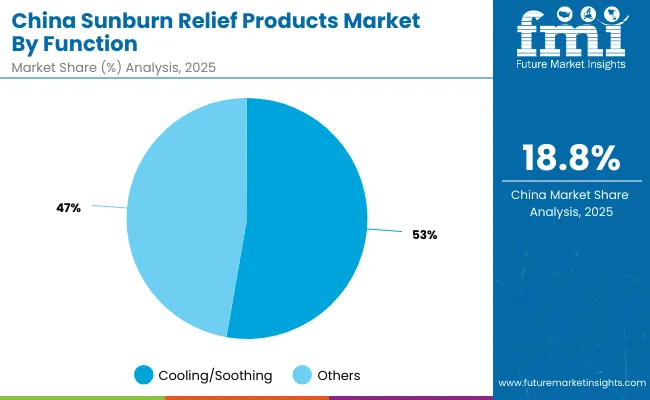
China by Function Value Share % 2025
Cooling/soothing 52.5%
Others 47.5%

The Sunburn Relief Products Market in China is projected to expand at a strong CAGR of 18.8% from 2025 to 2035, one of the highest among global markets. Cooling/soothing products dominate with 52.5% share in 2025, reflecting consumer preference for fast relief through aloe vera gels, cooling sprays, and menthol-based formulations. Demand is being fueled by higher UV exposure during summers, growing middle-class spending power, and strong adoption among younger consumers in coastal and urban areas.

E-commerce platforms such as Tmall, JD.com, and Douyin are transforming access, offering bundled after-sun kits and exclusive travel packs. Domestic players are competing aggressively on price while international dermocosmetic brands build share through dermatologist-tested and fragrance-free positioning. The market’s premiumization path is supported by innovation in hydrogel patches, spray formats, and sensitive-skin safe solutions, catering to rising health-conscious consumers.
  • Expansion of cooling/soothing gels and sprays, the largest functional category.
  • E-commerce bundling and subscription models creating recurring sales cycles.
  • Rising traction for premium dermocosmetic formulations with sensitive-skin claims.

Competitive Landscape of Sunburn Relief Products Market

Sunburn Relief Products Market By Company

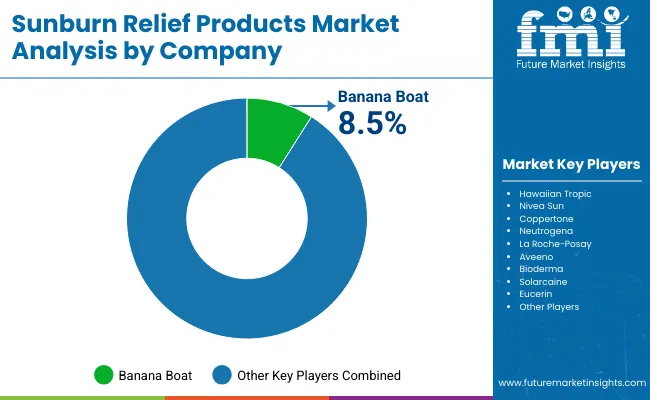
Company Global Value Share 2025
Banana Boat 8.5%
Others 91.5%

The Sunburn Relief Products Market is moderately fragmented, with global FMCG leaders, dermocosmetic specialists, and lifestyle-focused brands competing across multiple price tiers and channels. Banana Boat, with 8.5% share in 2025, leads globally through strong brand recall, mass-market affordability, and broad distribution in supermarkets, pharmacies, and travel retail.

Mass-market leaders such as Hawaiian Tropic, Coppertone, and Neutrogena leverage established sun-care portfolios, pairing prevention and after-sun care to capture seasonal demand. These players rely on multi-channel availability and aggressive summer marketing campaigns.

Dermocosmetic specialists including La Roche-Posay, Bioderma, Aveeno, and Eucerin are gaining traction through fragrance-free, dermatologist-tested, and sensitive-skin safe claims, making them the preferred choice in pharmacies and among health-conscious consumers. Their clinical positioning and regulatory compliance support steady premiumization. Lifestyle and niche brands such as Solarcaine and Sun Bum differentiate through spray-based formats, hydrogel innovations, and reef-friendly or vegan formulations, resonating strongly with younger, eco-conscious demographics and online shoppers.

Competitive differentiation is shifting from basic after-sun moisturization toward multi-functional formulations, premium ingredient integration, and e-commerce exclusivity. Subscription models, bundled seasonal kits, and clean-label certifications are becoming key levers for sustained growth.

Key Developments in Sunburn Relief Products Market

  • In January, 2025, Beiersdorf (Nivea Sun, Eucerin) launched a new line of fragrance-free and sensitive-skin safe after-sun lotions in Germany, expanding its dermocosmetic portfolio across EU pharmacies. The products emphasize clean-label claims and use stabilized aloe and panthenol for multi-day recovery.
  • In June, 2025, Edgewell’s Banana Boat introduced hydrogel patch formats in the USA and Canada, targeting quick cooling relief for active consumers. The launch was paired with travel-size kits for summer vacationers, reinforcing Banana Boat’s position as the global leader with 8.5% market share in 2025.

Scope of the Report

Item Value
Quantitative Units USD 2,803.4 Million
Function Cooling/soothing, Moisturizing, Anti-inflammatory, Repair/protection
Product Type Aloe vera gels, After-sun lotions, Sprays/mists, Balms
Active Ingredient Aloe vera , Panthenol , Menthol/cooling actives, Vitamin E
Channel Pharmacies/drugstores, Mass retail, E-commerce, Specialty beauty retail
Claim Natural/organic, Fragrance-free, Dermatologist-tested, Vegan
Regions Covered North America, Europe, Asia-Pacific, Latin America, Middle East & Africa
Country Covered United States, Canada, Germany, France, United Kingdom, China, Japan, India, Brazil, South Africa
Key Companies Profiled Banana Boat, Hawaiian Tropic, Nivea Sun, Coppertone, Neutrogena, La Roche- Posay , Aveeno, Bioderma , Solarcaine , Eucerin
Additional Attributes Dollar sales by function and active ingredient, adoption trends in cooling/soothing and fragrance-free formulations, rising demand for aloe vera -based gels and spray formats, sector-specific growth in pharmacies, e-commerce, and specialty beauty retail, premiumization through dermatologist-tested and sensitive-skin safe claims, regional trends shaped by heatwaves and UV exposure, and innovations in hydrogel patches, panthenol blends, and clean-label formulations.

Key Segments

By Product Type:

  • Aloe vera gels
  • After-sun lotions
  • Sprays/mists
  • Balms

By Active Ingredient:

  • Aloe vera
  • Panthenol
  • Menthol/cooling actives
  • Vitamin E

By Channel:

  • Pharmacies/drugstores
  • Mass retail
  • E-commerce
  • Specialty beauty retail

By Claim:

  • Natural/organic
  • Fragrance-free
  • Dermatologist-tested
  • Vegan

By Region:

  • North America
  • Latin America
  • Europe
  • East Asia
  • South Asia & Pacific
  • Middle East and Africa

Table of Content

  1. Executive Summary
    • Global Market Outlook
    • Demand-side Trends
    • Supply-side Trends
    • Technology Roadmap Analysis
    • Analysis and Recommendations
  2. Market Overview
    • Market Coverage / Taxonomy
    • Market Definition / Scope / Limitations
  3. Market Background
    • Market Dynamics
      • Drivers
      • Restraints
      • Opportunity
      • Trends
    • Scenario Forecast
      • Demand in Optimistic Scenario
      • Demand in Likely Scenario
      • Demand in Conservative Scenario
    • Opportunity Map Analysis
    • Product Life Cycle Analysis
    • Supply Chain Analysis
      • Supply Side Participants and their Roles
        • Producers
        • Mid-Level Participants (Traders/ Agents/ Brokers)
        • Wholesalers and Distributors
      • Value Added and Value Created at Node in the Supply Chain
      • List of Raw Material Suppliers
      • List of Existing and Potential Buyer’s
    • Investment Feasibility Matrix
    • Value Chain Analysis
      • Profit Margin Analysis
      • Wholesalers and Distributors
      • Retailers
    • PESTLE and Porter’s Analysis
    • Regulatory Landscape
      • By Key Regions
      • By Key Countries
    • Regional Parent Market Outlook
    • Production and Consumption Statistics
    • Import and Export Statistics
  4. Global Market Analysis 2020 to 2024 and Forecast, 2025 to 2035
    • Historical Market Size Value (USD Million) & Volume (Units) Analysis, 2020 to 2024
    • Current and Future Market Size Value (USD Million) & Volume (Units) Projections, 2025 to 2035
      • Y-o-Y Growth Trend Analysis
      • Absolute $ Opportunity Analysis
  5. Global Market Analysis 2020 to 2024 and Forecast 2025 to 2035, By Function
    • Introduction / Key Findings
    • Historical Market Size Value (USD Million) & Volume (Units) Analysis By Function, 2020 to 2024
    • Current and Future Market Size Value (USD Million) & Volume (Units) Analysis and Forecast By Function, 2025 to 2035
      • Cooling/soothing
      • Moisturizing
      • Anti-inflammatory
      • Repair/protection
    • Y-o-Y Growth Trend Analysis By Function, 2020 to 2024
    • Absolute $ Opportunity Analysis By Function, 2025 to 2035
  6. Global Market Analysis 2020 to 2024 and Forecast 2025 to 2035, By Product Type
    • Introduction / Key Findings
    • Historical Market Size Value (USD Million) & Volume (Units) Analysis By Product Type, 2020 to 2024
    • Current and Future Market Size Value (USD Million) & Volume (Units) Analysis and Forecast By Product Type, 2025 to 2035
      • Aloe vera gels
      • After-sun lotions
      • Sprays/mists
      • Balms
    • Y-o-Y Growth Trend Analysis By Product Type, 2020 to 2024
    • Absolute $ Opportunity Analysis By Product Type, 2025 to 2035
  7. Global Market Analysis 2020 to 2024 and Forecast 2025 to 2035, By Active Ingredient
    • Introduction / Key Findings
    • Historical Market Size Value (USD Million) & Volume (Units) Analysis By Active Ingredient, 2020 to 2024
    • Current and Future Market Size Value (USD Million) & Volume (Units) Analysis and Forecast By Active Ingredient, 2025 to 2035
      • Aloe vera
      • Panthenol
      • Menthol/cooling actives
      • Vitamin E
    • Y-o-Y Growth Trend Analysis By Active Ingredient, 2020 to 2024
    • Absolute $ Opportunity Analysis By Active Ingredient, 2025 to 2035
  8. Global Market Analysis 2020 to 2024 and Forecast 2025 to 2035, By Channel
    • Introduction / Key Findings
    • Historical Market Size Value (USD Million) & Volume (Units) Analysis By Channel, 2020 to 2024
    • Current and Future Market Size Value (USD Million) & Volume (Units) Analysis and Forecast By Channel, 2025 to 2035
      • Pharmacies/drugstores
      • Mass retail
      • E-commerce
      • Specialty beauty retail
    • Y-o-Y Growth Trend Analysis By Channel, 2020 to 2024
    • Absolute $ Opportunity Analysis By Channel, 2025 to 2035
  9. Global Market Analysis 2020 to 2024 and Forecast 2025 to 2035, By Claim
    • Introduction / Key Findings
    • Historical Market Size Value (USD Million) & Volume (Units) Analysis By Claim, 2020 to 2024
    • Current and Future Market Size Value (USD Million) & Volume (Units) Analysis and Forecast By Claim, 2025 to 2035
      • Natural/organic
      • Fragrance-free
      • Dermatologist-tested
      • Vegan
    • Y-o-Y Growth Trend Analysis By Claim, 2020 to 2024
    • Absolute $ Opportunity Analysis By Claim, 2025 to 2035
  10. Global Market Analysis 2020 to 2024 and Forecast 2025 to 2035, By Region
    • Introduction
    • Historical Market Size Value (USD Million) & Volume (Units) Analysis By Region, 2020 to 2024
    • Current Market Size Value (USD Million) & Volume (Units) Analysis and Forecast By Region, 2025 to 2035
      • North America
      • Latin America
      • Europe
      • East Asia
      • South Asia & Pacific
      • Middle East and Africa
    • Market Attractiveness Analysis By Region
  11. North America Market Analysis 2020 to 2024 and Forecast 2025 to 2035, By Country
    • Historical Market Size Value (USD Million) & Volume (Units) Trend Analysis By Market Taxonomy, 2020 to 2024
    • Market Size Value (USD Million) & Volume (Units) Forecast By Market Taxonomy, 2025 to 2035
      • By Country
        • USA
        • Canada
      • By Function
      • By Product Type
      • By Active Ingredient
      • By Channel
      • By Claim
    • Market Attractiveness Analysis
      • By Country
      • By Function
      • By Product Type
      • By Active Ingredient
      • By Channel
      • By Claim
    • Key Takeaways
  12. Latin America Market Analysis 2020 to 2024 and Forecast 2025 to 2035, By Country
    • Historical Market Size Value (USD Million) & Volume (Units) Trend Analysis By Market Taxonomy, 2020 to 2024
    • Market Size Value (USD Million) & Volume (Units) Forecast By Market Taxonomy, 2025 to 2035
      • By Country
        • Brazil
        • Mexico
        • Colombia
        • Rest of Latin America
      • By Function
      • By Product Type
      • By Active Ingredient
      • By Channel
      • By Claim
    • Market Attractiveness Analysis
      • By Country
      • By Function
      • By Product Type
      • By Active Ingredient
      • By Channel
      • By Claim
    • Key Takeaways
  13. Europe Market Analysis 2020 to 2024 and Forecast 2025 to 2035, By Country
    • Historical Market Size Value (USD Million) & Volume (Units) Trend Analysis By Market Taxonomy, 2020 to 2024
    • Market Size Value (USD Million) & Volume (Units) Forecast By Market Taxonomy, 2025 to 2035
      • By Country
        • Germany
        • UK
        • France
        • Italy
        • Spain
        • Belgium
        • Netherlands
        • Nordic
        • Switzerland
        • Russia
        • Poland
        • Rest of Europe
      • By Function
      • By Product Type
      • By Active Ingredient
      • By Channel
      • By Claim
    • Market Attractiveness Analysis
      • By Country
      • By Function
      • By Product Type
      • By Active Ingredient
      • By Channel
      • By Claim
    • Key Takeaways
  14. East Asia Market Analysis 2020 to 2024 and Forecast 2025 to 2035, By Country
    • Historical Market Size Value (USD Million) & Volume (Units) Trend Analysis By Market Taxonomy, 2020 to 2024
    • Market Size Value (USD Million) & Volume (Units) Forecast By Market Taxonomy, 2025 to 2035
      • By Country
        • China
        • Japan
        • South Korea
      • By Function
      • By Product Type
      • By Active Ingredient
      • By Channel
      • By Claim
    • Market Attractiveness Analysis
      • By Country
      • By Function
      • By Product Type
      • By Active Ingredient
      • By Channel
      • By Claim
    • Key Takeaways
  15. South Asia & Pacific Market Analysis 2020 to 2024 and Forecast 2025 to 2035, By Country
    • Historical Market Size Value (USD Million) & Volume (Units) Trend Analysis By Market Taxonomy, 2020 to 2024
    • Market Size Value (USD Million) & Volume (Units) Forecast By Market Taxonomy, 2025 to 2035
      • By Country
        • India
        • Thailand
        • Malaysia
        • Indonesia
        • Singapore
        • Vietnam
        • Australia
        • New Zealand
        • Rest of South Asia
      • By Function
      • By Product Type
      • By Active Ingredient
      • By Channel
      • By Claim
    • Market Attractiveness Analysis
      • By Country
      • By Function
      • By Product Type
      • By Active Ingredient
      • By Channel
      • By Claim
    • Key Takeaways
  16. Middle East and Africa Market Analysis 2020 to 2024 and Forecast 2025 to 2035, By Country
    • Historical Market Size Value (USD Million) & Volume (Units) Trend Analysis By Market Taxonomy, 2020 to 2024
    • Market Size Value (USD Million) & Volume (Units) Forecast By Market Taxonomy, 2025 to 2035
      • By Country
        • Turkey
        • UAE
        • Saudi Arabia
        • Israel
        • Other GCC Countries
        • North Africa
        • South Africa
      • By Function
      • By Product Type
      • By Active Ingredient
      • By Channel
      • By Claim
    • Market Attractiveness Analysis
      • By Country
      • By Function
      • By Product Type
      • By Active Ingredient
      • By Channel
      • By Claim
    • Key Takeaways
  17. Key Countries Market Analysis
    • USA
      • Pricing Analysis
      • Market Share Analysis, 2024
        • By Function
        • By Product Type
        • By Active Ingredient
        • By Channel
        • By Claim
    • Canada
      • Pricing Analysis
      • Market Share Analysis, 2024
        • By Function
        • By Product Type
        • By Active Ingredient
        • By Channel
        • By Claim
    • Brazil
      • Pricing Analysis
      • Market Share Analysis, 2024
        • By Function
        • By Product Type
        • By Active Ingredient
        • By Channel
        • By Claim
    • Mexico
      • Pricing Analysis
      • Market Share Analysis, 2024
        • By Function
        • By Product Type
        • By Active Ingredient
        • By Channel
        • By Claim
    • Colombia
      • Pricing Analysis
      • Market Share Analysis, 2024
        • By Function
        • By Product Type
        • By Active Ingredient
        • By Channel
        • By Claim
    • Germany
      • Pricing Analysis
      • Market Share Analysis, 2024
        • By Function
        • By Product Type
        • By Active Ingredient
        • By Channel
        • By Claim
    • UK
      • Pricing Analysis
      • Market Share Analysis, 2024
        • By Function
        • By Product Type
        • By Active Ingredient
        • By Channel
        • By Claim
    • France
      • Pricing Analysis
      • Market Share Analysis, 2024
        • By Function
        • By Product Type
        • By Active Ingredient
        • By Channel
        • By Claim
    • Italy
      • Pricing Analysis
      • Market Share Analysis, 2024
        • By Function
        • By Product Type
        • By Active Ingredient
        • By Channel
        • By Claim
    • Spain
      • Pricing Analysis
      • Market Share Analysis, 2024
        • By Function
        • By Product Type
        • By Active Ingredient
        • By Channel
        • By Claim
    • Belgium
      • Pricing Analysis
      • Market Share Analysis, 2024
        • By Function
        • By Product Type
        • By Active Ingredient
        • By Channel
        • By Claim
    • Netherlands
      • Pricing Analysis
      • Market Share Analysis, 2024
        • By Function
        • By Product Type
        • By Active Ingredient
        • By Channel
        • By Claim
    • Nordic
      • Pricing Analysis
      • Market Share Analysis, 2024
        • By Function
        • By Product Type
        • By Active Ingredient
        • By Channel
        • By Claim
    • Switzerland
      • Pricing Analysis
      • Market Share Analysis, 2024
        • By Function
        • By Product Type
        • By Active Ingredient
        • By Channel
        • By Claim
    • Russia
      • Pricing Analysis
      • Market Share Analysis, 2024
        • By Function
        • By Product Type
        • By Active Ingredient
        • By Channel
        • By Claim
    • Poland
      • Pricing Analysis
      • Market Share Analysis, 2024
        • By Function
        • By Product Type
        • By Active Ingredient
        • By Channel
        • By Claim
    • China
      • Pricing Analysis
      • Market Share Analysis, 2024
        • By Function
        • By Product Type
        • By Active Ingredient
        • By Channel
        • By Claim
    • Japan
      • Pricing Analysis
      • Market Share Analysis, 2024
        • By Function
        • By Product Type
        • By Active Ingredient
        • By Channel
        • By Claim
    • South Korea
      • Pricing Analysis
      • Market Share Analysis, 2024
        • By Function
        • By Product Type
        • By Active Ingredient
        • By Channel
        • By Claim
    • India
      • Pricing Analysis
      • Market Share Analysis, 2024
        • By Function
        • By Product Type
        • By Active Ingredient
        • By Channel
        • By Claim
    • Thailand
      • Pricing Analysis
      • Market Share Analysis, 2024
        • By Function
        • By Product Type
        • By Active Ingredient
        • By Channel
        • By Claim
    • Indonesia
      • Pricing Analysis
      • Market Share Analysis, 2024
        • By Function
        • By Product Type
        • By Active Ingredient
        • By Channel
        • By Claim
    • Australia
      • Pricing Analysis
      • Market Share Analysis, 2024
        • By Function
        • By Product Type
        • By Active Ingredient
        • By Channel
        • By Claim
    • New Zealand
      • Pricing Analysis
      • Market Share Analysis, 2024
        • By Function
        • By Product Type
        • By Active Ingredient
        • By Channel
        • By Claim
    • Turkey
      • Pricing Analysis
      • Market Share Analysis, 2024
        • By Function
        • By Product Type
        • By Active Ingredient
        • By Channel
        • By Claim
    • UAE
      • Pricing Analysis
      • Market Share Analysis, 2024
        • By Function
        • By Product Type
        • By Active Ingredient
        • By Channel
        • By Claim
    • Saudi Arabia
      • Pricing Analysis
      • Market Share Analysis, 2024
        • By Function
        • By Product Type
        • By Active Ingredient
        • By Channel
        • By Claim
    • Israel
      • Pricing Analysis
      • Market Share Analysis, 2024
        • By Function
        • By Product Type
        • By Active Ingredient
        • By Channel
        • By Claim
    • North Africa
      • Pricing Analysis
      • Market Share Analysis, 2024
        • By Function
        • By Product Type
        • By Active Ingredient
        • By Channel
        • By Claim
    • South Africa
      • Pricing Analysis
      • Market Share Analysis, 2024
        • By Function
        • By Product Type
        • By Active Ingredient
        • By Channel
        • By Claim
  18. Market Structure Analysis
    • Competition Dashboard
    • Competition Benchmarking
    • Market Share Analysis of Top Players
      • By Regional
      • By Function
      • By Product Type
      • By Active Ingredient
      • By Channel
      • By Claim
  19. Competition Analysis
    • Competition Deep Dive
      • Banana Boat
        • Overview
        • Product Portfolio
        • Profitability by Market Segments (Product/Age /Sales Channel/Region)
        • Sales Footprint
        • Strategy Overview
          • Marketing Strategy
          • Product Strategy
          • Channel Strategy
      • Hawaiian Tropic
        • Overview
        • Product Portfolio
        • Profitability by Market Segments (Product/Age /Sales Channel/Region)
        • Sales Footprint
        • Strategy Overview
          • Marketing Strategy
          • Product Strategy
          • Channel Strategy
      • Nivea Sun
        • Overview
        • Product Portfolio
        • Profitability by Market Segments (Product/Age /Sales Channel/Region)
        • Sales Footprint
        • Strategy Overview
          • Marketing Strategy
          • Product Strategy
          • Channel Strategy
      • Coppertone
        • Overview
        • Product Portfolio
        • Profitability by Market Segments (Product/Age /Sales Channel/Region)
        • Sales Footprint
        • Strategy Overview
          • Marketing Strategy
          • Product Strategy
          • Channel Strategy
      • Neutrogena
        • Overview
        • Product Portfolio
        • Profitability by Market Segments (Product/Age /Sales Channel/Region)
        • Sales Footprint
        • Strategy Overview
          • Marketing Strategy
          • Product Strategy
          • Channel Strategy
      • La Roche-Posay
        • Overview
        • Product Portfolio
        • Profitability by Market Segments (Product/Age /Sales Channel/Region)
        • Sales Footprint
        • Strategy Overview
          • Marketing Strategy
          • Product Strategy
          • Channel Strategy
      • Aveeno
        • Overview
        • Product Portfolio
        • Profitability by Market Segments (Product/Age /Sales Channel/Region)
        • Sales Footprint
        • Strategy Overview
          • Marketing Strategy
          • Product Strategy
          • Channel Strategy
      • Bioderma
        • Overview
        • Product Portfolio
        • Profitability by Market Segments (Product/Age /Sales Channel/Region)
        • Sales Footprint
        • Strategy Overview
          • Marketing Strategy
          • Product Strategy
          • Channel Strategy
      • Solarcaine
        • Overview
        • Product Portfolio
        • Profitability by Market Segments (Product/Age /Sales Channel/Region)
        • Sales Footprint
        • Strategy Overview
          • Marketing Strategy
          • Product Strategy
          • Channel Strategy
      • Eucerin
        • Overview
        • Product Portfolio
        • Profitability by Market Segments (Product/Age /Sales Channel/Region)
        • Sales Footprint
        • Strategy Overview
          • Marketing Strategy
          • Product Strategy
          • Channel Strategy
      • Others
        • Overview
        • Product Portfolio
        • Profitability by Market Segments (Product/Age /Sales Channel/Region)
        • Sales Footprint
        • Strategy Overview
          • Marketing Strategy
          • Product Strategy
          • Channel Strategy
  20. Assumptions & Acronyms Used
  21. Research Methodology

List of Tables

  • Table 1: Global Market Value (USD Million) Forecast by Region, 2020-2035
  • Table 2: Global Market Volume (Units) Forecast by Region, 2020-2035
  • Table 3: Global Market Value (USD Million) Forecast by Function, 2020-2035
  • Table 4: Global Market Volume (Units) Forecast by Function, 2020-2035
  • Table 5: Global Market Value (USD Million) Forecast by Product Type, 2020-2035
  • Table 6: Global Market Volume (Units) Forecast by Product Type, 2020-2035
  • Table 7: Global Market Value (USD Million) Forecast by Active Ingredient, 2020-2035
  • Table 8: Global Market Volume (Units) Forecast by Active Ingredient, 2020-2035
  • Table 9: Global Market Value (USD Million) Forecast by Channel, 2020-2035
  • Table 10: Global Market Volume (Units) Forecast by Channel, 2020-2035
  • Table 11: Global Market Value (USD Million) Forecast by Claim, 2020-2035
  • Table 12: Global Market Volume (Units) Forecast by Claim, 2020-2035
  • Table 13: North America Market Value (USD Million) Forecast by Country, 2020-2035
  • Table 14: North America Market Volume (Units) Forecast by Country, 2020-2035
  • Table 15: North America Market Value (USD Million) Forecast by Function, 2020-2035
  • Table 16: North America Market Volume (Units) Forecast by Function, 2020-2035
  • Table 17: North America Market Value (USD Million) Forecast by Product Type, 2020-2035
  • Table 18: North America Market Volume (Units) Forecast by Product Type, 2020-2035
  • Table 19: North America Market Value (USD Million) Forecast by Active Ingredient, 2020-2035
  • Table 20: North America Market Volume (Units) Forecast by Active Ingredient, 2020-2035
  • Table 21: North America Market Value (USD Million) Forecast by Channel, 2020-2035
  • Table 22: North America Market Volume (Units) Forecast by Channel, 2020-2035
  • Table 23: North America Market Value (USD Million) Forecast by Claim, 2020-2035
  • Table 24: North America Market Volume (Units) Forecast by Claim, 2020-2035
  • Table 25: Latin America Market Value (USD Million) Forecast by Country, 2020-2035
  • Table 26: Latin America Market Volume (Units) Forecast by Country, 2020-2035
  • Table 27: Latin America Market Value (USD Million) Forecast by Function, 2020-2035
  • Table 28: Latin America Market Volume (Units) Forecast by Function, 2020-2035
  • Table 29: Latin America Market Value (USD Million) Forecast by Product Type, 2020-2035
  • Table 30: Latin America Market Volume (Units) Forecast by Product Type, 2020-2035
  • Table 31: Latin America Market Value (USD Million) Forecast by Active Ingredient, 2020-2035
  • Table 32: Latin America Market Volume (Units) Forecast by Active Ingredient, 2020-2035
  • Table 33: Latin America Market Value (USD Million) Forecast by Channel, 2020-2035
  • Table 34: Latin America Market Volume (Units) Forecast by Channel, 2020-2035
  • Table 35: Latin America Market Value (USD Million) Forecast by Claim, 2020-2035
  • Table 36: Latin America Market Volume (Units) Forecast by Claim, 2020-2035
  • Table 37: Europe Market Value (USD Million) Forecast by Country, 2020-2035
  • Table 38: Europe Market Volume (Units) Forecast by Country, 2020-2035
  • Table 39: Europe Market Value (USD Million) Forecast by Function, 2020-2035
  • Table 40: Europe Market Volume (Units) Forecast by Function, 2020-2035
  • Table 41: Europe Market Value (USD Million) Forecast by Product Type, 2020-2035
  • Table 42: Europe Market Volume (Units) Forecast by Product Type, 2020-2035
  • Table 43: Europe Market Value (USD Million) Forecast by Active Ingredient, 2020-2035
  • Table 44: Europe Market Volume (Units) Forecast by Active Ingredient, 2020-2035
  • Table 45: Europe Market Value (USD Million) Forecast by Channel, 2020-2035
  • Table 46: Europe Market Volume (Units) Forecast by Channel, 2020-2035
  • Table 47: Europe Market Value (USD Million) Forecast by Claim, 2020-2035
  • Table 48: Europe Market Volume (Units) Forecast by Claim, 2020-2035
  • Table 49: East Asia Market Value (USD Million) Forecast by Country, 2020-2035
  • Table 50: East Asia Market Volume (Units) Forecast by Country, 2020-2035
  • Table 51: East Asia Market Value (USD Million) Forecast by Function, 2020-2035
  • Table 52: East Asia Market Volume (Units) Forecast by Function, 2020-2035
  • Table 53: East Asia Market Value (USD Million) Forecast by Product Type, 2020-2035
  • Table 54: East Asia Market Volume (Units) Forecast by Product Type, 2020-2035
  • Table 55: East Asia Market Value (USD Million) Forecast by Active Ingredient, 2020-2035
  • Table 56: East Asia Market Volume (Units) Forecast by Active Ingredient, 2020-2035
  • Table 57: East Asia Market Value (USD Million) Forecast by Channel, 2020-2035
  • Table 58: East Asia Market Volume (Units) Forecast by Channel, 2020-2035
  • Table 59: East Asia Market Value (USD Million) Forecast by Claim, 2020-2035
  • Table 60: East Asia Market Volume (Units) Forecast by Claim, 2020-2035
  • Table 61: South Asia & Pacific Market Value (USD Million) Forecast by Country, 2020-2035
  • Table 62: South Asia & Pacific Market Volume (Units) Forecast by Country, 2020-2035
  • Table 63: South Asia & Pacific Market Value (USD Million) Forecast by Function, 2020-2035
  • Table 64: South Asia & Pacific Market Volume (Units) Forecast by Function, 2020-2035
  • Table 65: South Asia & Pacific Market Value (USD Million) Forecast by Product Type, 2020-2035
  • Table 66: South Asia & Pacific Market Volume (Units) Forecast by Product Type, 2020-2035
  • Table 67: South Asia & Pacific Market Value (USD Million) Forecast by Active Ingredient, 2020-2035
  • Table 68: South Asia & Pacific Market Volume (Units) Forecast by Active Ingredient, 2020-2035
  • Table 69: South Asia & Pacific Market Value (USD Million) Forecast by Channel, 2020-2035
  • Table 70: South Asia & Pacific Market Volume (Units) Forecast by Channel, 2020-2035
  • Table 71: South Asia & Pacific Market Value (USD Million) Forecast by Claim, 2020-2035
  • Table 72: South Asia & Pacific Market Volume (Units) Forecast by Claim, 2020-2035
  • Table 73: Middle East and Africa Market Value (USD Million) Forecast by Country, 2020-2035
  • Table 74: Middle East and Africa Market Volume (Units) Forecast by Country, 2020-2035
  • Table 75: Middle East and Africa Market Value (USD Million) Forecast by Function, 2020-2035
  • Table 76: Middle East and Africa Market Volume (Units) Forecast by Function, 2020-2035
  • Table 77: Middle East and Africa Market Value (USD Million) Forecast by Product Type, 2020-2035
  • Table 78: Middle East and Africa Market Volume (Units) Forecast by Product Type, 2020-2035
  • Table 79: Middle East and Africa Market Value (USD Million) Forecast by Active Ingredient, 2020-2035
  • Table 80: Middle East and Africa Market Volume (Units) Forecast by Active Ingredient, 2020-2035
  • Table 81: Middle East and Africa Market Value (USD Million) Forecast by Channel, 2020-2035
  • Table 82: Middle East and Africa Market Volume (Units) Forecast by Channel, 2020-2035
  • Table 83: Middle East and Africa Market Value (USD Million) Forecast by Claim, 2020-2035
  • Table 84: Middle East and Africa Market Volume (Units) Forecast by Claim, 2020-2035

List of Figures

  • Figure 1: Global Market Value (USD Million) by Function, 2025-2035
  • Figure 2: Global Market Value (USD Million) by Product Type, 2025-2035
  • Figure 3: Global Market Value (USD Million) by Active Ingredient, 2025-2035
  • Figure 4: Global Market Value (USD Million) by Channel, 2025-2035
  • Figure 5: Global Market Value (USD Million) by Claim, 2025-2035
  • Figure 6: Global Market Value (USD Million) by Region, 2025-2035
  • Figure 7: Global Market Value (USD Million) Analysis by Region, 2020-2035
  • Figure 8: Global Market Volume (Units) Analysis by Region, 2020-2035
  • Figure 9: Global Market Value Share (%) and BPS Analysis by Region, 2025-2035
  • Figure 10: Global Market Y-o-Y Growth (%) Projections by Region, 2025-2035
  • Figure 11: Global Market Value (USD Million) Analysis by Function, 2020-2035
  • Figure 12: Global Market Volume (Units) Analysis by Function, 2020-2035
  • Figure 13: Global Market Value Share (%) and BPS Analysis by Function, 2025-2035
  • Figure 14: Global Market Y-o-Y Growth (%) Projections by Function, 2025-2035
  • Figure 15: Global Market Value (USD Million) Analysis by Product Type, 2020-2035
  • Figure 16: Global Market Volume (Units) Analysis by Product Type, 2020-2035
  • Figure 17: Global Market Value Share (%) and BPS Analysis by Product Type, 2025-2035
  • Figure 18: Global Market Y-o-Y Growth (%) Projections by Product Type, 2025-2035
  • Figure 19: Global Market Value (USD Million) Analysis by Active Ingredient, 2020-2035
  • Figure 20: Global Market Volume (Units) Analysis by Active Ingredient, 2020-2035
  • Figure 21: Global Market Value Share (%) and BPS Analysis by Active Ingredient, 2025-2035
  • Figure 22: Global Market Y-o-Y Growth (%) Projections by Active Ingredient, 2025-2035
  • Figure 23: Global Market Value (USD Million) Analysis by Channel, 2020-2035
  • Figure 24: Global Market Volume (Units) Analysis by Channel, 2020-2035
  • Figure 25: Global Market Value Share (%) and BPS Analysis by Channel, 2025-2035
  • Figure 26: Global Market Y-o-Y Growth (%) Projections by Channel, 2025-2035
  • Figure 27: Global Market Value (USD Million) Analysis by Claim, 2020-2035
  • Figure 28: Global Market Volume (Units) Analysis by Claim, 2020-2035
  • Figure 29: Global Market Value Share (%) and BPS Analysis by Claim, 2025-2035
  • Figure 30: Global Market Y-o-Y Growth (%) Projections by Claim, 2025-2035
  • Figure 31: Global Market Attractiveness by Function, 2025-2035
  • Figure 32: Global Market Attractiveness by Product Type, 2025-2035
  • Figure 33: Global Market Attractiveness by Active Ingredient, 2025-2035
  • Figure 34: Global Market Attractiveness by Channel, 2025-2035
  • Figure 35: Global Market Attractiveness by Claim, 2025-2035
  • Figure 36: Global Market Attractiveness by Region, 2025-2035
  • Figure 37: North America Market Value (USD Million) by Function, 2025-2035
  • Figure 38: North America Market Value (USD Million) by Product Type, 2025-2035
  • Figure 39: North America Market Value (USD Million) by Active Ingredient, 2025-2035
  • Figure 40: North America Market Value (USD Million) by Channel, 2025-2035
  • Figure 41: North America Market Value (USD Million) by Claim, 2025-2035
  • Figure 42: North America Market Value (USD Million) by Country, 2025-2035
  • Figure 43: North America Market Value (USD Million) Analysis by Country, 2020-2035
  • Figure 44: North America Market Volume (Units) Analysis by Country, 2020-2035
  • Figure 45: North America Market Value Share (%) and BPS Analysis by Country, 2025-2035
  • Figure 46: North America Market Y-o-Y Growth (%) Projections by Country, 2025-2035
  • Figure 47: North America Market Value (USD Million) Analysis by Function, 2020-2035
  • Figure 48: North America Market Volume (Units) Analysis by Function, 2020-2035
  • Figure 49: North America Market Value Share (%) and BPS Analysis by Function, 2025-2035
  • Figure 50: North America Market Y-o-Y Growth (%) Projections by Function, 2025-2035
  • Figure 51: North America Market Value (USD Million) Analysis by Product Type, 2020-2035
  • Figure 52: North America Market Volume (Units) Analysis by Product Type, 2020-2035
  • Figure 53: North America Market Value Share (%) and BPS Analysis by Product Type, 2025-2035
  • Figure 54: North America Market Y-o-Y Growth (%) Projections by Product Type, 2025-2035
  • Figure 55: North America Market Value (USD Million) Analysis by Active Ingredient, 2020-2035
  • Figure 56: North America Market Volume (Units) Analysis by Active Ingredient, 2020-2035
  • Figure 57: North America Market Value Share (%) and BPS Analysis by Active Ingredient, 2025-2035
  • Figure 58: North America Market Y-o-Y Growth (%) Projections by Active Ingredient, 2025-2035
  • Figure 59: North America Market Value (USD Million) Analysis by Channel, 2020-2035
  • Figure 60: North America Market Volume (Units) Analysis by Channel, 2020-2035
  • Figure 61: North America Market Value Share (%) and BPS Analysis by Channel, 2025-2035
  • Figure 62: North America Market Y-o-Y Growth (%) Projections by Channel, 2025-2035
  • Figure 63: North America Market Value (USD Million) Analysis by Claim, 2020-2035
  • Figure 64: North America Market Volume (Units) Analysis by Claim, 2020-2035
  • Figure 65: North America Market Value Share (%) and BPS Analysis by Claim, 2025-2035
  • Figure 66: North America Market Y-o-Y Growth (%) Projections by Claim, 2025-2035
  • Figure 67: North America Market Attractiveness by Function, 2025-2035
  • Figure 68: North America Market Attractiveness by Product Type, 2025-2035
  • Figure 69: North America Market Attractiveness by Active Ingredient, 2025-2035
  • Figure 70: North America Market Attractiveness by Channel, 2025-2035
  • Figure 71: North America Market Attractiveness by Claim, 2025-2035
  • Figure 72: North America Market Attractiveness by Country, 2025-2035
  • Figure 73: Latin America Market Value (USD Million) by Function, 2025-2035
  • Figure 74: Latin America Market Value (USD Million) by Product Type, 2025-2035
  • Figure 75: Latin America Market Value (USD Million) by Active Ingredient, 2025-2035
  • Figure 76: Latin America Market Value (USD Million) by Channel, 2025-2035
  • Figure 77: Latin America Market Value (USD Million) by Claim, 2025-2035
  • Figure 78: Latin America Market Value (USD Million) by Country, 2025-2035
  • Figure 79: Latin America Market Value (USD Million) Analysis by Country, 2020-2035
  • Figure 80: Latin America Market Volume (Units) Analysis by Country, 2020-2035
  • Figure 81: Latin America Market Value Share (%) and BPS Analysis by Country, 2025-2035
  • Figure 82: Latin America Market Y-o-Y Growth (%) Projections by Country, 2025-2035
  • Figure 83: Latin America Market Value (USD Million) Analysis by Function, 2020-2035
  • Figure 84: Latin America Market Volume (Units) Analysis by Function, 2020-2035
  • Figure 85: Latin America Market Value Share (%) and BPS Analysis by Function, 2025-2035
  • Figure 86: Latin America Market Y-o-Y Growth (%) Projections by Function, 2025-2035
  • Figure 87: Latin America Market Value (USD Million) Analysis by Product Type, 2020-2035
  • Figure 88: Latin America Market Volume (Units) Analysis by Product Type, 2020-2035
  • Figure 89: Latin America Market Value Share (%) and BPS Analysis by Product Type, 2025-2035
  • Figure 90: Latin America Market Y-o-Y Growth (%) Projections by Product Type, 2025-2035
  • Figure 91: Latin America Market Value (USD Million) Analysis by Active Ingredient, 2020-2035
  • Figure 92: Latin America Market Volume (Units) Analysis by Active Ingredient, 2020-2035
  • Figure 93: Latin America Market Value Share (%) and BPS Analysis by Active Ingredient, 2025-2035
  • Figure 94: Latin America Market Y-o-Y Growth (%) Projections by Active Ingredient, 2025-2035
  • Figure 95: Latin America Market Value (USD Million) Analysis by Channel, 2020-2035
  • Figure 96: Latin America Market Volume (Units) Analysis by Channel, 2020-2035
  • Figure 97: Latin America Market Value Share (%) and BPS Analysis by Channel, 2025-2035
  • Figure 98: Latin America Market Y-o-Y Growth (%) Projections by Channel, 2025-2035
  • Figure 99: Latin America Market Value (USD Million) Analysis by Claim, 2020-2035
  • Figure 100: Latin America Market Volume (Units) Analysis by Claim, 2020-2035
  • Figure 101: Latin America Market Value Share (%) and BPS Analysis by Claim, 2025-2035
  • Figure 102: Latin America Market Y-o-Y Growth (%) Projections by Claim, 2025-2035
  • Figure 103: Latin America Market Attractiveness by Function, 2025-2035
  • Figure 104: Latin America Market Attractiveness by Product Type, 2025-2035
  • Figure 105: Latin America Market Attractiveness by Active Ingredient, 2025-2035
  • Figure 106: Latin America Market Attractiveness by Channel, 2025-2035
  • Figure 107: Latin America Market Attractiveness by Claim, 2025-2035
  • Figure 108: Latin America Market Attractiveness by Country, 2025-2035
  • Figure 109: Europe Market Value (USD Million) by Function, 2025-2035
  • Figure 110: Europe Market Value (USD Million) by Product Type, 2025-2035
  • Figure 111: Europe Market Value (USD Million) by Active Ingredient, 2025-2035
  • Figure 112: Europe Market Value (USD Million) by Channel, 2025-2035
  • Figure 113: Europe Market Value (USD Million) by Claim, 2025-2035
  • Figure 114: Europe Market Value (USD Million) by Country, 2025-2035
  • Figure 115: Europe Market Value (USD Million) Analysis by Country, 2020-2035
  • Figure 116: Europe Market Volume (Units) Analysis by Country, 2020-2035
  • Figure 117: Europe Market Value Share (%) and BPS Analysis by Country, 2025-2035
  • Figure 118: Europe Market Y-o-Y Growth (%) Projections by Country, 2025-2035
  • Figure 119: Europe Market Value (USD Million) Analysis by Function, 2020-2035
  • Figure 120: Europe Market Volume (Units) Analysis by Function, 2020-2035
  • Figure 121: Europe Market Value Share (%) and BPS Analysis by Function, 2025-2035
  • Figure 122: Europe Market Y-o-Y Growth (%) Projections by Function, 2025-2035
  • Figure 123: Europe Market Value (USD Million) Analysis by Product Type, 2020-2035
  • Figure 124: Europe Market Volume (Units) Analysis by Product Type, 2020-2035
  • Figure 125: Europe Market Value Share (%) and BPS Analysis by Product Type, 2025-2035
  • Figure 126: Europe Market Y-o-Y Growth (%) Projections by Product Type, 2025-2035
  • Figure 127: Europe Market Value (USD Million) Analysis by Active Ingredient, 2020-2035
  • Figure 128: Europe Market Volume (Units) Analysis by Active Ingredient, 2020-2035
  • Figure 129: Europe Market Value Share (%) and BPS Analysis by Active Ingredient, 2025-2035
  • Figure 130: Europe Market Y-o-Y Growth (%) Projections by Active Ingredient, 2025-2035
  • Figure 131: Europe Market Value (USD Million) Analysis by Channel, 2020-2035
  • Figure 132: Europe Market Volume (Units) Analysis by Channel, 2020-2035
  • Figure 133: Europe Market Value Share (%) and BPS Analysis by Channel, 2025-2035
  • Figure 134: Europe Market Y-o-Y Growth (%) Projections by Channel, 2025-2035
  • Figure 135: Europe Market Value (USD Million) Analysis by Claim, 2020-2035
  • Figure 136: Europe Market Volume (Units) Analysis by Claim, 2020-2035
  • Figure 137: Europe Market Value Share (%) and BPS Analysis by Claim, 2025-2035
  • Figure 138: Europe Market Y-o-Y Growth (%) Projections by Claim, 2025-2035
  • Figure 139: Europe Market Attractiveness by Function, 2025-2035
  • Figure 140: Europe Market Attractiveness by Product Type, 2025-2035
  • Figure 141: Europe Market Attractiveness by Active Ingredient, 2025-2035
  • Figure 142: Europe Market Attractiveness by Channel, 2025-2035
  • Figure 143: Europe Market Attractiveness by Claim, 2025-2035
  • Figure 144: Europe Market Attractiveness by Country, 2025-2035
  • Figure 145: East Asia Market Value (USD Million) by Function, 2025-2035
  • Figure 146: East Asia Market Value (USD Million) by Product Type, 2025-2035
  • Figure 147: East Asia Market Value (USD Million) by Active Ingredient, 2025-2035
  • Figure 148: East Asia Market Value (USD Million) by Channel, 2025-2035
  • Figure 149: East Asia Market Value (USD Million) by Claim, 2025-2035
  • Figure 150: East Asia Market Value (USD Million) by Country, 2025-2035
  • Figure 151: East Asia Market Value (USD Million) Analysis by Country, 2020-2035
  • Figure 152: East Asia Market Volume (Units) Analysis by Country, 2020-2035
  • Figure 153: East Asia Market Value Share (%) and BPS Analysis by Country, 2025-2035
  • Figure 154: East Asia Market Y-o-Y Growth (%) Projections by Country, 2025-2035
  • Figure 155: East Asia Market Value (USD Million) Analysis by Function, 2020-2035
  • Figure 156: East Asia Market Volume (Units) Analysis by Function, 2020-2035
  • Figure 157: East Asia Market Value Share (%) and BPS Analysis by Function, 2025-2035
  • Figure 158: East Asia Market Y-o-Y Growth (%) Projections by Function, 2025-2035
  • Figure 159: East Asia Market Value (USD Million) Analysis by Product Type, 2020-2035
  • Figure 160: East Asia Market Volume (Units) Analysis by Product Type, 2020-2035
  • Figure 161: East Asia Market Value Share (%) and BPS Analysis by Product Type, 2025-2035
  • Figure 162: East Asia Market Y-o-Y Growth (%) Projections by Product Type, 2025-2035
  • Figure 163: East Asia Market Value (USD Million) Analysis by Active Ingredient, 2020-2035
  • Figure 164: East Asia Market Volume (Units) Analysis by Active Ingredient, 2020-2035
  • Figure 165: East Asia Market Value Share (%) and BPS Analysis by Active Ingredient, 2025-2035
  • Figure 166: East Asia Market Y-o-Y Growth (%) Projections by Active Ingredient, 2025-2035
  • Figure 167: East Asia Market Value (USD Million) Analysis by Channel, 2020-2035
  • Figure 168: East Asia Market Volume (Units) Analysis by Channel, 2020-2035
  • Figure 169: East Asia Market Value Share (%) and BPS Analysis by Channel, 2025-2035
  • Figure 170: East Asia Market Y-o-Y Growth (%) Projections by Channel, 2025-2035
  • Figure 171: East Asia Market Value (USD Million) Analysis by Claim, 2020-2035
  • Figure 172: East Asia Market Volume (Units) Analysis by Claim, 2020-2035
  • Figure 173: East Asia Market Value Share (%) and BPS Analysis by Claim, 2025-2035
  • Figure 174: East Asia Market Y-o-Y Growth (%) Projections by Claim, 2025-2035
  • Figure 175: East Asia Market Attractiveness by Function, 2025-2035
  • Figure 176: East Asia Market Attractiveness by Product Type, 2025-2035
  • Figure 177: East Asia Market Attractiveness by Active Ingredient, 2025-2035
  • Figure 178: East Asia Market Attractiveness by Channel, 2025-2035
  • Figure 179: East Asia Market Attractiveness by Claim, 2025-2035
  • Figure 180: East Asia Market Attractiveness by Country, 2025-2035
  • Figure 181: South Asia & Pacific Market Value (USD Million) by Function, 2025-2035
  • Figure 182: South Asia & Pacific Market Value (USD Million) by Product Type, 2025-2035
  • Figure 183: South Asia & Pacific Market Value (USD Million) by Active Ingredient, 2025-2035
  • Figure 184: South Asia & Pacific Market Value (USD Million) by Channel, 2025-2035
  • Figure 185: South Asia & Pacific Market Value (USD Million) by Claim, 2025-2035
  • Figure 186: South Asia & Pacific Market Value (USD Million) by Country, 2025-2035
  • Figure 187: South Asia & Pacific Market Value (USD Million) Analysis by Country, 2020-2035
  • Figure 188: South Asia & Pacific Market Volume (Units) Analysis by Country, 2020-2035
  • Figure 189: South Asia & Pacific Market Value Share (%) and BPS Analysis by Country, 2025-2035
  • Figure 190: South Asia & Pacific Market Y-o-Y Growth (%) Projections by Country, 2025-2035
  • Figure 191: South Asia & Pacific Market Value (USD Million) Analysis by Function, 2020-2035
  • Figure 192: South Asia & Pacific Market Volume (Units) Analysis by Function, 2020-2035
  • Figure 193: South Asia & Pacific Market Value Share (%) and BPS Analysis by Function, 2025-2035
  • Figure 194: South Asia & Pacific Market Y-o-Y Growth (%) Projections by Function, 2025-2035
  • Figure 195: South Asia & Pacific Market Value (USD Million) Analysis by Product Type, 2020-2035
  • Figure 196: South Asia & Pacific Market Volume (Units) Analysis by Product Type, 2020-2035
  • Figure 197: South Asia & Pacific Market Value Share (%) and BPS Analysis by Product Type, 2025-2035
  • Figure 198: South Asia & Pacific Market Y-o-Y Growth (%) Projections by Product Type, 2025-2035
  • Figure 199: South Asia & Pacific Market Value (USD Million) Analysis by Active Ingredient, 2020-2035
  • Figure 200: South Asia & Pacific Market Volume (Units) Analysis by Active Ingredient, 2020-2035
  • Figure 201: South Asia & Pacific Market Value Share (%) and BPS Analysis by Active Ingredient, 2025-2035
  • Figure 202: South Asia & Pacific Market Y-o-Y Growth (%) Projections by Active Ingredient, 2025-2035
  • Figure 203: South Asia & Pacific Market Value (USD Million) Analysis by Channel, 2020-2035
  • Figure 204: South Asia & Pacific Market Volume (Units) Analysis by Channel, 2020-2035
  • Figure 205: South Asia & Pacific Market Value Share (%) and BPS Analysis by Channel, 2025-2035
  • Figure 206: South Asia & Pacific Market Y-o-Y Growth (%) Projections by Channel, 2025-2035
  • Figure 207: South Asia & Pacific Market Value (USD Million) Analysis by Claim, 2020-2035
  • Figure 208: South Asia & Pacific Market Volume (Units) Analysis by Claim, 2020-2035
  • Figure 209: South Asia & Pacific Market Value Share (%) and BPS Analysis by Claim, 2025-2035
  • Figure 210: South Asia & Pacific Market Y-o-Y Growth (%) Projections by Claim, 2025-2035
  • Figure 211: South Asia & Pacific Market Attractiveness by Function, 2025-2035
  • Figure 212: South Asia & Pacific Market Attractiveness by Product Type, 2025-2035
  • Figure 213: South Asia & Pacific Market Attractiveness by Active Ingredient, 2025-2035
  • Figure 214: South Asia & Pacific Market Attractiveness by Channel, 2025-2035
  • Figure 215: South Asia & Pacific Market Attractiveness by Claim, 2025-2035
  • Figure 216: South Asia & Pacific Market Attractiveness by Country, 2025-2035
  • Figure 217: Middle East and Africa Market Value (USD Million) by Function, 2025-2035
  • Figure 218: Middle East and Africa Market Value (USD Million) by Product Type, 2025-2035
  • Figure 219: Middle East and Africa Market Value (USD Million) by Active Ingredient, 2025-2035
  • Figure 220: Middle East and Africa Market Value (USD Million) by Channel, 2025-2035
  • Figure 221: Middle East and Africa Market Value (USD Million) by Claim, 2025-2035
  • Figure 222: Middle East and Africa Market Value (USD Million) by Country, 2025-2035
  • Figure 223: Middle East and Africa Market Value (USD Million) Analysis by Country, 2020-2035
  • Figure 224: Middle East and Africa Market Volume (Units) Analysis by Country, 2020-2035
  • Figure 225: Middle East and Africa Market Value Share (%) and BPS Analysis by Country, 2025-2035
  • Figure 226: Middle East and Africa Market Y-o-Y Growth (%) Projections by Country, 2025-2035
  • Figure 227: Middle East and Africa Market Value (USD Million) Analysis by Function, 2020-2035
  • Figure 228: Middle East and Africa Market Volume (Units) Analysis by Function, 2020-2035
  • Figure 229: Middle East and Africa Market Value Share (%) and BPS Analysis by Function, 2025-2035
  • Figure 230: Middle East and Africa Market Y-o-Y Growth (%) Projections by Function, 2025-2035
  • Figure 231: Middle East and Africa Market Value (USD Million) Analysis by Product Type, 2020-2035
  • Figure 232: Middle East and Africa Market Volume (Units) Analysis by Product Type, 2020-2035
  • Figure 233: Middle East and Africa Market Value Share (%) and BPS Analysis by Product Type, 2025-2035
  • Figure 234: Middle East and Africa Market Y-o-Y Growth (%) Projections by Product Type, 2025-2035
  • Figure 235: Middle East and Africa Market Value (USD Million) Analysis by Active Ingredient, 2020-2035
  • Figure 236: Middle East and Africa Market Volume (Units) Analysis by Active Ingredient, 2020-2035
  • Figure 237: Middle East and Africa Market Value Share (%) and BPS Analysis by Active Ingredient, 2025-2035
  • Figure 238: Middle East and Africa Market Y-o-Y Growth (%) Projections by Active Ingredient, 2025-2035
  • Figure 239: Middle East and Africa Market Value (USD Million) Analysis by Channel, 2020-2035
  • Figure 240: Middle East and Africa Market Volume (Units) Analysis by Channel, 2020-2035
  • Figure 241: Middle East and Africa Market Value Share (%) and BPS Analysis by Channel, 2025-2035
  • Figure 242: Middle East and Africa Market Y-o-Y Growth (%) Projections by Channel, 2025-2035
  • Figure 243: Middle East and Africa Market Value (USD Million) Analysis by Claim, 2020-2035
  • Figure 244: Middle East and Africa Market Volume (Units) Analysis by Claim, 2020-2035
  • Figure 245: Middle East and Africa Market Value Share (%) and BPS Analysis by Claim, 2025-2035
  • Figure 246: Middle East and Africa Market Y-o-Y Growth (%) Projections by Claim, 2025-2035
  • Figure 247: Middle East and Africa Market Attractiveness by Function, 2025-2035
  • Figure 248: Middle East and Africa Market Attractiveness by Product Type, 2025-2035
  • Figure 249: Middle East and Africa Market Attractiveness by Active Ingredient, 2025-2035
  • Figure 250: Middle East and Africa Market Attractiveness by Channel, 2025-2035
  • Figure 251: Middle East and Africa Market Attractiveness by Claim, 2025-2035
  • Figure 252: Middle East and Africa Market Attractiveness by Country, 2025-2035

Frequently Asked Questions

How big is the Sunburn Relief Products Market in 2025?

The global Sunburn Relief Products Market is estimated to be valued at USD 2,803.4 million in 2025.

What will be the size of Sunburn Relief Products Market in 2035?

The market size for the Sunburn Relief Products Market is projected to reach USD 6,905.6 million by 2035.

How much will be the Sunburn Relief Products Market growth between 2025 and 2035?

The Sunburn Relief Products Market is expected to grow at a 9.4% CAGR between 2025 and 2035.

What are the key product types in the Sunburn Relief Products Market?

The key product types in the Sunburn Relief Products Market are Aloe vera gels, After-sun lotions, Sprays/mists, and Balms.

Which range segment to contribute significant share in the Sunburn Relief Products Market in 2025?

In terms of function, the Cooling/soothing segment is expected to command the largest share at 51.5% in the Sunburn Relief Products Market in 2025.

Explore Similar Insights

Future Market Insights

Sunburn Relief Products Market

Chat With

MaRIA

Hi There, I am MaRIA, Your Market Research Intelligence Assistant. How may I help you?