Taurine Market Size and Share Forecast Outlook 2025 to 2035

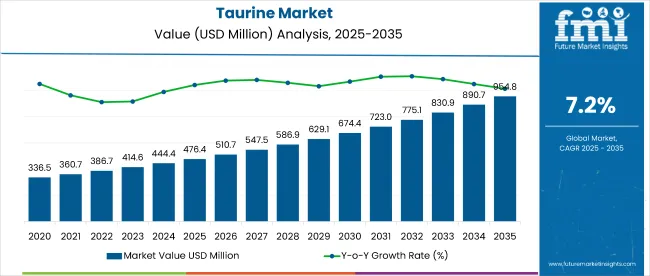
The global taurine market is projected to grow from USD 476.4 million in 2025 to USD 954.8 million by 2035, registering a CAGR of 7.2%. The market expansion is being driven by rising health awareness, increasing adoption of dietary supplements, and taurine’s growing use in infant nutrition and pet food.
Quick Stats for Taurine Market

  • Market Value (2025): USD 476.4 million
  • Forecast Value (2035): USD 954.8 million
  • Forecast CAGR: 7.2%
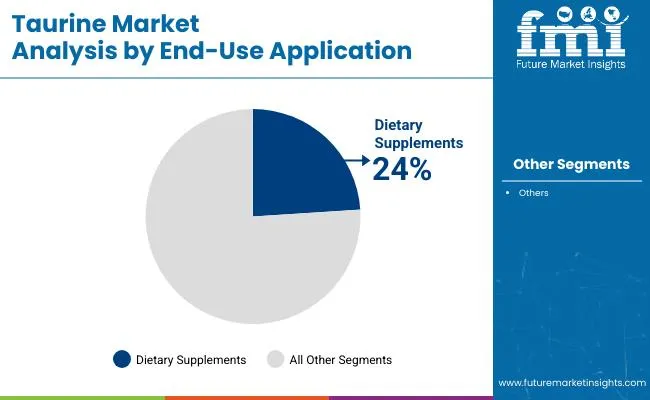
  • End-use Application Leader in 2025: Dietary Supplements (24% market share)
  • Top Grade Segment: Food Grade (48% share)
  • Key Growth Region: East Asia (Japan is the fastest-growing market with a 7.9% CAGR)

Taurine Market

Metric Value
Industry Size (2025E) USD 476.4 million
Industry Value (2035F) USD 954.8 million
CAGR (2025 to 2035) 7.2%

Taurine’s multifunctional benefits in cardiovascular health, metabolism, and neurological development are encouraging its incorporation in food, pharmaceutical, and veterinary products. Diversification into functional beverages, cosmetics, and personal care formulations is further accelerating global demand across multiple consumer categories.

The market holds an estimated 28% share in the amino acid market, driven by its wide application in supplements and beverages. Within the nutraceutical ingredients market, taurine accounts for roughly 5%, while its contribution to the dietary supplements market stands at around 3%.

It makes up 4.5% of the sports nutrition ingredients market and 2% of the infant nutrition sector. In pet food additives, taurine represents about 6% due to its essentiality in feline diets. Its share in broader markets like functional food ingredients and pharmaceutical ingredients remains modest, averaging below 1%.

Regulatory guidelines impacting the market focus on ingredient safety, dosage standards, and nutritional claims. Organizations such as the USA FDA, European Food Safety Authority (EFSA), and Japan’s FOSHU regulate taurine use in foods and supplements.

For pets, bodies like the AAFCO and NRC recommend taurine inclusion in regulated amounts, especially in feline and canine diets. These regulations are driving the adoption of standardized, food-grade, and pharmaceutical-grade taurine in commercial formulations, supporting both human and animal health outcomes.

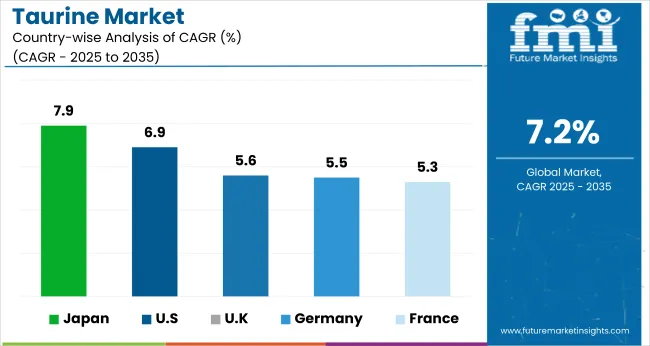
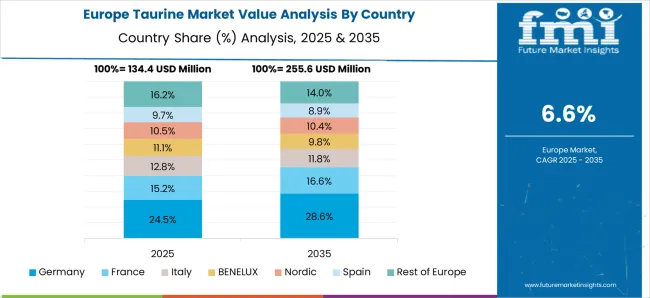
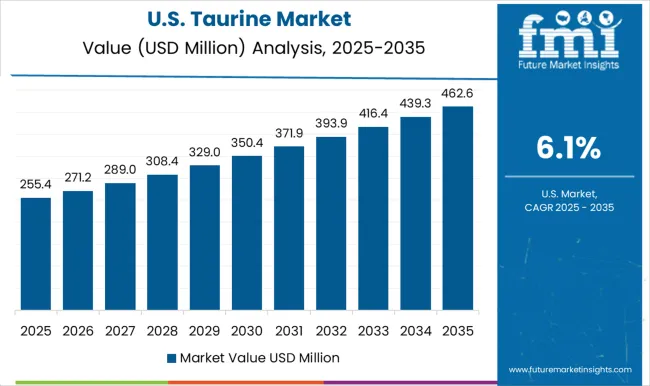
Japan is projected to be the fastest-growing market, expected to expand at a CAGR of 7.9% from 2025 to 2035. The dietary supplements will lead the end-use application segment with a 24% market share in 2025, while food grade will dominate the grade segment with a 48% share. The USA and Germany markets are also expected to grow steadily at CAGRs of 6.9% and 5.5%, respectively. The UK and France are projected to expand at 5.6% and 5.3% CAGR, respectively.

2025: Per-Capita Consumption in the Taurine Market

The taurine market witnesses highly uneven per-capita consumption across regions. Japan and South Korea show the highest intake per individual, led by widespread functional drink adoption. Southeast Asia follows, with taurine used in low-cost energy beverages available through modern retail. In contrast, per-capita volumes in Europe are moderate, confined mostly to urban beverage categories. North American usage remains tied to sports nutrition.

  • Consumption in India is still low outside Tier 1 cities.
  • Thailand and Vietnam show higher penetration in convenience formats.
  • Household use remains minimal; beverage dominates delivery mode.

Infrastructure and Retail Distribution in the Taurine Market

Cold-chain coverage for taurine concentrates is limited to industrial parks in South and East Asia. Ambient-stable formulations dominate consumer-facing sales. Retail distribution is strongest in Japan and South Korea. In India, taurine SKUs are limited to fitness retail chains and online vending.
  • Urban foodservice partners prefer pre-blended taurine RTDs.
  • Modern trade channels avoid dry formulations due to shelf-life concerns.
  • Distribution gaps remain in rural and low-income segments.

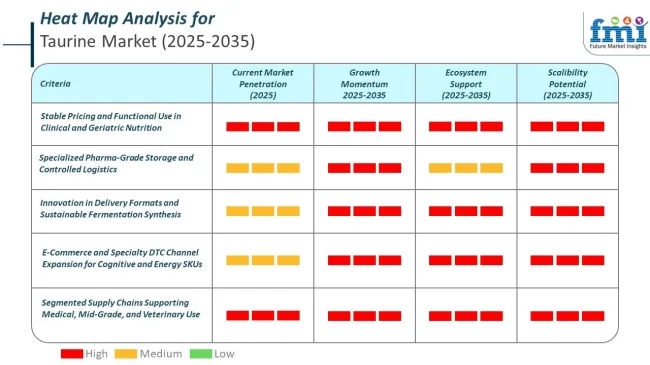
Heat Map For Taurine Market

Analyzing Taurine Market by Top Investment Segments

The global market is segmented by grade, end-use application, and region. By grade, the market is divided into food grade, feed grade, pharmaceutical grade, and others (cosmetic grade, industrial grade, reagent grade, and lab grade).

By end-use application, the market includes food (dairy products, infant, bakery products, cereal products), beverages (energy drinks, caffeinated drinks, soft & carbonated drinks), animal feed (aquaculture feed, poultry feed), pet food (cat food, dog food), pet supplements (cat supplements, dog supplements), dietary supplements, cosmetics & personal care (skin care products, hair care products, toiletries), agriculture, and pharmaceuticals.

Regionally, the market is segmented into North America, Latin America, Western Europe, Eastern Europe, Asia Pacific excluding Japan (APEJ), Japan, and the Middle East & Africa (MEA).
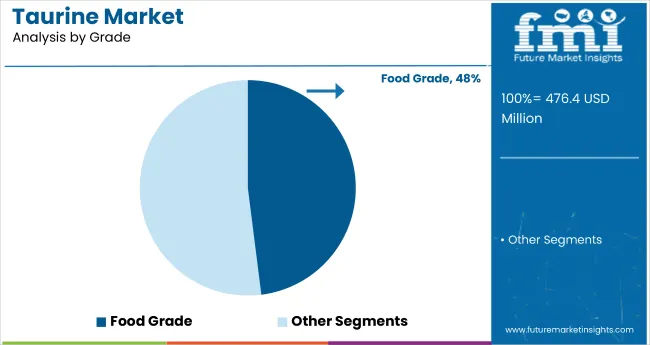
Food Grade to Lead the Grade Segment with 48% Market Share by 2025

Taurine Market Analysis By Grade

Food grade is expected to lead the grade segment with a 48% market share by 2025, driven by its widespread use in functional foods, energy drinks, and infant nutrition across global markets. Its high purity levels, safety profile, and regulatory approvals across regions like North America, Europe, and Asia-Pacific make it the preferred choice among manufacturers.

The ingredient’s role in enhancing cognitive performance, cardiovascular health, and electrolyte balance has fueled its inclusion in health-focused product formulations. Additionally, growing consumer awareness regarding its antioxidant and metabolic benefits supports its expanding application in wellness-centric food and beverage launches.
  • Its extensive use in functional foods, infant formulas, and energy drinks drives its dominance.
  • Regulatory approvals and clean-label demand further support the growth of food-grade taurine.

Dietary Supplements to Dominate End-use Application Segment with 24% Market Share by 2025

Taurine Market Analysis By End Use

Dietary supplements are projected to lead the end-use application segment in the taurine market, capturing a 24% share by 2025, driven by growing consumer demand for health, energy, and performance-boosting formulations.

Taurine’s benefits in muscle function, fat metabolism, and oxidative stress reduction make it a key ingredient in sports nutrition and wellness products. The segment is further supported by rising fitness trends, aging populations seeking vitality, and increased supplement intake among younger consumers. Additionally, the convenience of capsules, powders, and effervescent tablets has enhanced taurine’s accessibility in global nutraceutical markets.

  • Rising consumer awareness about energy, immunity, and metabolic health fuels the demand.
  • Taurine's benefits in cardiovascular, neurological, and muscular health make it a key functional ingredient.

Top Taurine Market Dynamics

The global market is experiencing steady growth, driven by rising health awareness, expanding applications in functional foods, and growing use in dietary supplements, infant nutrition, and pet health. Taurine is increasingly recognized for its critical role in cardiovascular function, neurological development, and metabolic support, contributing to its widespread demand across multiple end-use industries.

Recent Trends in the Taurine Market

  • Expansion of taurine-enriched energy drinks, infant formulas, and nutraceuticals, especially in health-conscious and aging populations.
  • Growing use of plant-based and synthetic taurine in response to ethical and sustainability concerns around animal-derived sources.

Challenges in the Taurine Market

  • High production costs of pharmaceutical-grade taurine and dependency on chemical synthesis limit affordability for price-sensitive markets.
  • Regulatory inconsistencies across countries regarding taurine dosage and permissible applications restrict global standardization and product innovation.

Top Countries Manufacturing, Regulating, and Generating Demand for Taurine

Country Wise Analysis Of Taurine Market

Japan’s taurine market momentum is anchored in advanced health science research, functional nutrition, and the aging population’s growing reliance on supplements. Germany and France maintain consistent demand, driven by EU nutrition regulations and innovations in pharmaceutical-grade amino acids. In comparison, developed economies such as the USA (6.9% CAGR), UK(5.6%), and Japan (7.9%) are expected to grow at 0.78-1.09 times the global growth rate.

Japan shows the strongest momentum in the market, fueled by high demand for functional beverages, senior health supplements, and infant nutrition. The United States follows with robust growth, supported by expanding use in sports nutrition, pet supplements, and fortified wellness products. Germany benefits from strong pharmaceutical integration, with taurine widely used in heart and energy formulations.

France mirrors this trend, with growing applications in infant nutrition and skincare. The United Kingdom, while progressing steadily, sees relatively slower expansion due to post-Brexit regulatory adjustments, but demand is sustained by innovations in dietary supplements and functional beverages across digital and retail platforms.

The report covers in-depth analysis of 40+ countries; five top-performing OECD countries are highlighted below.

In-depth Analysis of Taurine Demand in Japan

The Japan taurine market is growing at a CAGR of 7.9% from 2025 to 2035. Growth is driven by a rising senior population, strong functional beverage demand, and long-standing cultural acceptance of amino acid supplementation. Taurine is widely used for eye health, cardiovascular support, and infant nutrition. Japan’s continued leadership in clinical R&D and nutrition-backed public health policies supports the use of high-purity taurine in preventive care.
  • High taurine use in anti-aging and metabolic formulations.
  • Functional beverages and advanced infant products drive volume.

Growth Outlook for Taurine in Germany

Sales of taurine in Germany are expected to expand at a CAGR of 5.5% during the forecast period, below the global average but supported by regulatory-backed nutraceutical demand. The market benefits from Germany’s robust pharmaceutical production and the use of taurine in cardiometabolic health products. Functional energy drinks and taurine-integrated OTC supplements are gaining popularity, especially among aging and performance-focused consumers.

  • Strong adoption in pharma-grade health and OTC nutrition.
  • Heart health and energy-focused formulations drive taurine growth.

Pharmaceutical and Functional Taurine Demand in France

The French taurine market is projected to grow at a CAGR of 5.3%, similar to Germany, driven by functional food trends, national nutrition programs, and a mature pharmaceutical sector. Usage is concentrated in dietary supplements, clean-label functional drinks, and premium infant nutrition. France is also exploring taurine’s topical applications in skincare and anti-aging formulations.
  • Growing use in premium infant and dermatological products.
  • National nutrition programs support long-term supplement use.

Taurine Demand Trajectory in the USA

The USA taurine market is forecasted to grow at a CAGR of 6.9% from 2025 to 2035, translating to 0.96 times the global rate. Growth is driven by strong demand in sports nutrition, energy drinks, and pet supplements. Taurine is also increasingly included in fortified products for heart health and neurological support. A high consumer focus on performance nutrition, combined with regulatory clarity from the FDA, supports stable expansion.

  • Sports nutrition and pet supplements drive taurine uptake.
  • Clean-label and fortified drinks attract wellness-focused consumers.

Taurine Usage Trends in the UK

The UK taurine market is projected to grow at a CAGR of 5.6% from 2025 to 2035, representing the slowest pace among top OECD markets at 0.76 times the global rate. Demand is supported by dietary supplement expansion, infant formula enhancements, and functional beverage launches. Despite post-Brexit regulatory friction, domestic production and e-commerce distribution of taurine products are rising steadily.
  • Key focus on infant nutrition and functional drinks.
  • Domestic brand activity and online channels sustain demand.

Leading Taurine Market Suppliers and Manufacturers

Taurine Market Analysis By Company

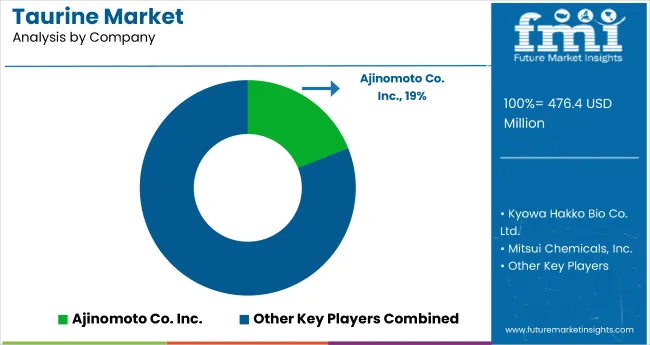
The global market is moderately consolidated, with major players such as QianjiangYongan Pharmaceutical Co. Ltd., Ajinomoto Co. Inc., Kyowa Hakko Bio Co. Ltd., and The Honjo Chemical Corporation playing a central role. These companies are known for their high-purity taurine production and global supply networks, serving industries such as pharmaceuticals, dietary supplements, pet nutrition, and functional beverages.

QianjiangYongan focuses on cost-effective bulk supply, while Ajinomoto and Kyowa Hakko emphasize pharmaceutical-grade taurine through precision fermentation processes. The Honjo Chemical Corporation specializes in amino acid derivatives and taurine integration in healthcare applications.

Other significant contributors include MTC Industries, Stauber USA, Foodchem International Corporation, New Zealand Pharmaceutical Ltd., Jiangsu Yuanyang Chemical Co. Ltd., Funchi Pharmaceutical Co., Ltd., Penta Manufacturing Company, Mitsui Chemicals, Inc., and AuNutra Industries Inc., all of which support global taurine demand with region-specific expertise and customized offerings.

Taurine Market Report Scope

Report Attributes Details
Market Size (2025) USD 476.4 million
Projected Market Size (2035) USD 954.8 million
CAGR (2025 to 2035) 7.2%
Base Year for Estimation 2024
Historical Period 2020 to 2024
Projections Period 2025 to 2035
Report Parameter USD million for value/volume in metric tons
Grade Analyzed Food Grade, Feed Grade, Pharmaceuticals Grade, Others (Cosmetic Grade, Industrial Grade, Reagent Grade, Lab Grade)
End-use Application Analyzed Food (Dairy Products, Infant, Bakery Products, Cereal Products), Beverage (Energy Drinks, Caffeinated Drinks, Soft & Carbonated Drinks), Animal Feed (Aquaculture Feed, Poultry Feed), Pet Food (Cat Food, Dog Food), Pet Supplements (Cat Supplements, Dog Supplements), Dietary Supplements, Cosmetics & Personal Care (Skin Care Products, Hair Care Products, Toiletries), Agriculture, Pharmaceuticals
Regions Covered North America, Latin America, Western Europe, South Asia, East Asia, Eastern Europe, Middle East & Africa
Countries Covered United States, United Kingdom, Germany, France, Japan, China, India, Brazil, South Korea, Australia and 40+ countries
Key Players Influencing the Market MTC Industries, Stauber USA, Foodchem International Corporation, The Honjo Chemical Corporation, Qianjiang Yongan Pharmaceutical Co. Ltd., New Zealand Pharmaceutical Ltd., Ajinomoto Co. Inc., Kyowa Hakko Bio Co. Ltd., Jiangsu Yuanyang Chemical Co. Ltd., Funchi Pharmaceutical Co., Ltd., Penta Manufacturing Company, Mitsui Chemicals, Inc., and AuNutra Industries Inc.
Additional Attributes Dollar sales by grade, demand by application, regional consumption analysis, policy trends, nutraceutical innovation, and competitive benchmarking

Key Segmentation

By Grade:

  • Food Grade
  • Feed Grade
  • Pharmaceuticals Grade
  • Others

By End-use Application:

  • Food
    • Dairy Products
    • Infant
    • Bakery Products
    • Cereal Products
  • Beverage
    • Energy Drinks
    • Caffeinated Drinks
    • Soft & Carbonated Drinks
  • Animal Feed
    • Aquaculture Feed
    • Poultry Feed
  • Pet Food
    • Cat Food
    • Dog Food
  • Pet Supplements
    • Cat Supplements
    • Dog Supplements
  • Dietary Supplements
  • Cosmetics & Personal Care
    • Skin Care Products
    • Hair Care Products
    • Toiletries
  • Agriculture
  • Pharmaceuticals

By Region:

  • North America
  • Latin America
  • Western Europe
  • Eastern Europe
  • Asia Pacific excluding Japan (APEJ)
  • Japan
  • The Middle East & Africa (MEA)

Table of Content

  1. Executive Summary
    • Global Market Outlook
    • Demand-side Trends
    • Supply-side Trends
    • Technology Roadmap Analysis
    • Analysis and Recommendations
  2. Market Overview
    • Market Coverage/Taxonomy
    • Market Definition/Scope/Limitations
  3. Market Background
    • Market Dynamics
      • Drivers
      • Restraints
      • Opportunity
      • Trends
    • Scenario Forecast
      • Demand in Optimistic Scenario
      • Demand in Likely Scenario
      • Demand in Conservative Scenario
    • Opportunity Map Analysis
    • Product Life Cycle Analysis
    • Supply Chain Analysis
      • Supply Side Participants and their Roles
        • Producers
        • Mid-Level Participants (Traders/ Agents/ Brokers)
        • Wholesalers and Distributors
      • Value Added and Value Created at Node in the Supply Chain
      • List of Raw Material Suppliers
      • List of Existing and Potential Buyer’s
    • Investment Feasibility Matrix
    • Value Chain Analysis
      • Profit Margin Analysis
      • Wholesalers and Distributors
      • Retailers
    • PESTLE and Porter’s Analysis
    • Regulatory Landscape
      • By Key Regions
      • By Key Countries
    • Regional Parent Market Outlook
    • Production and Consumption Statistics
    • Import and Export Statistics
  4. Global Market Analysis 2020 to 2024 and Forecast, 2025 to 2035
    • Historical Market Size Value (USD Million) & Volume (Metric Tons) Analysis, 2020 to 2024
    • Current and Future Market Size Value (USD Million) & Volume (Metric Tons) Projections, 2025 to 2035
      • Y-o-Y Growth Trend Analysis
      • Absolute $ Opportunity Analysis
  5. Global Market Pricing Analysis 2020 to 2024 and Forecast 2025 to 2035
  6. Global Market Analysis 2020 to 2024 and Forecast 2025 to 2035, By Grade
    • Introduction/Key Findings
    • Historical Market Size Value (USD Million) & Volume (Metric Tons) Analysis By Grade, 2020 to 2024
    • Current and Future Market Size Value (USD Million) & Volume (Metric Tons) Analysis and Forecast By Grade, 2025 to 2035
      • Food Grade
      • Feed Grade
      • Pharmaceuticals Grade
      • Others (Cosmetic Grade, Industrial Grade, Reagent Grade, Lab Grade)
    • Y-o-Y Growth Trend Analysis By Grade, 2020 to 2024
    • Absolute $ Opportunity Analysis By Grade, 2025 to 2035
  7. Global Market Analysis 2020 to 2024 and Forecast 2025 to 2035, By End-Use Application
    • Introduction/Key Findings
    • Historical Market Size Value (USD Million) & Volume (Metric Tons) Analysis By End-Use Application, 2020 to 2024
    • Current and Future Market Size Value (USD Million) & Volume (Metric Tons) Analysis and Forecast By End-Use Application, 2025 to 2035
      • Food
        • Dairy Products
        • Infant
        • Bakery Products
        • Cereal Products
      • Beverage
        • Energy Drinks
        • Caffeinated Drinks
        • Soft & Carbonated Drinks
      • Animal Feed
        • Aquaculture Feed
        • Poultry Feed
      • Pet Food
        • Cat Food
        • Dog Food
      • Pet Supplements
        • Cat Supplements
        • Dog Supplements
      • Dietary Supplements
      • Cosmetics & Personal Care
        • Skin Care Products
        • Hair Care Products
        • Toiletries
      • Agriculture
      • Pharmaceuticals
    • Y-o-Y Growth Trend Analysis By End-Use Application, 2020 to 2024
    • Absolute $ Opportunity Analysis By End-Use Application, 2025 to 2035
  8. Global Market Analysis 2020 to 2024 and Forecast 2025 to 2035, By Region
    • Introduction
    • Historical Market Size Value (USD Million) & Volume (Metric Tons) Analysis By Region, 2020 to 2024
    • Current Market Size Value (USD Million) & Volume (Metric Tons) Analysis and Forecast By Region, 2025 to 2035
      • North America
      • Latin America
      • Western Europe
      • Eastern Europe
      • East Asia
      • South Asia & Pacific
      • Middle East and Africa
    • Market Attractiveness Analysis By Region
  9. North America Market Analysis 2020 to 2024 and Forecast 2025 to 2035, By Country
    • Historical Market Size Value (USD Million) & Volume (Metric Tons) Trend Analysis By Market Taxonomy, 2020 to 2024
    • Market Size Value (USD Million) & Volume (Metric Tons) Forecast By Market Taxonomy, 2025 to 2035
      • By Country
        • USA
        • Canada
        • Mexico
      • By Grade
      • By End-Use Application
    • Market Attractiveness Analysis
      • By Country
      • By Grade
      • By End-Use Application
    • Key Takeaways
  10. Latin America Market Analysis 2020 to 2024 and Forecast 2025 to 2035, By Country
    • Historical Market Size Value (USD Million) & Volume (Metric Tons) Trend Analysis By Market Taxonomy, 2020 to 2024
    • Market Size Value (USD Million) & Volume (Metric Tons) Forecast By Market Taxonomy, 2025 to 2035
      • By Country
        • Brazil
        • Argentina
        • Rest of LATAM
      • By Grade
      • By End-Use Application
    • Market Attractiveness Analysis
      • By Country
      • By Grade
      • By End-Use Application
    • Key Takeaways
  11. Western Europe Market Analysis 2020 to 2024 and Forecast 2025 to 2035, By Country
    • Historical Market Size Value (USD Million) & Volume (Metric Tons) Trend Analysis By Market Taxonomy, 2020 to 2024
    • Market Size Value (USD Million) & Volume (Metric Tons) Forecast By Market Taxonomy, 2025 to 2035
      • By Country
        • Germany
        • Italy
        • France
        • UK
        • Spain
        • BENELUX
        • Nordic
        • Rest of W.Europe
      • By Grade
      • By End-Use Application
    • Market Attractiveness Analysis
      • By Country
      • By Grade
      • By End-Use Application
    • Key Takeaways
  12. Eastern Europe Market Analysis 2020 to 2024 and Forecast 2025 to 2035, By Country
    • Historical Market Size Value (USD Million) & Volume (Metric Tons) Trend Analysis By Market Taxonomy, 2020 to 2024
    • Market Size Value (USD Million) & Volume (Metric Tons) Forecast By Market Taxonomy, 2025 to 2035
      • By Country
        • Russia
        • Hungary
        • Poland
        • Balkan & Baltics
        • Rest of E. Europe
      • By Grade
      • By End-Use Application
    • Market Attractiveness Analysis
      • By Country
      • By Grade
      • By End-Use Application
    • Key Takeaways
  13. East Asia Market Analysis 2020 to 2024 and Forecast 2025 to 2035, By Country
    • Historical Market Size Value (USD Million) & Volume (Metric Tons) Trend Analysis By Market Taxonomy, 2020 to 2024
    • Market Size Value (USD Million) & Volume (Metric Tons) Forecast By Market Taxonomy, 2025 to 2035
      • By Country
        • China
        • Japan
        • South Korea
      • By Grade
      • By End-Use Application
    • Market Attractiveness Analysis
      • By Country
      • By Grade
      • By End-Use Application
    • Key Takeaways
  14. South Asia & Pacific Market Analysis 2020 to 2024 and Forecast 2025 to 2035, By Country
    • Historical Market Size Value (USD Million) & Volume (Metric Tons) Trend Analysis By Market Taxonomy, 2020 to 2024
    • Market Size Value (USD Million) & Volume (Metric Tons) Forecast By Market Taxonomy, 2025 to 2035
      • By Country
        • India
        • Australia & New Zealand
        • ASEAN
        • Rest of SAP
      • By Grade
      • By End-Use Application
    • Market Attractiveness Analysis
      • By Country
      • By Grade
      • By End-Use Application
    • Key Takeaways
  15. Middle East and Africa Market Analysis 2020 to 2024 and Forecast 2025 to 2035, By Country
    • Historical Market Size Value (USD Million) & Volume (Metric Tons) Trend Analysis By Market Taxonomy, 2020 to 2024
    • Market Size Value (USD Million) & Volume (Metric Tons) Forecast By Market Taxonomy, 2025 to 2035
      • By Country
        • GCC Countries
        • Northern Africa
        • South Africa
        • Turkiye
        • Rest of MEA
      • By Grade
      • By End-Use Application
    • Market Attractiveness Analysis
      • By Country
      • By Grade
      • By End-Use Application
    • Key Takeaways
  16. Key Countries Market Analysis
    • USA
      • Pricing Analysis
      • Market Share Analysis, 2024
        • By Grade
        • By End-Use Application
    • Canada
      • Pricing Analysis
      • Market Share Analysis, 2024
        • By Grade
        • By End-Use Application
    • Brazil
      • Pricing Analysis
      • Market Share Analysis, 2024
        • By Grade
        • By End-Use Application
    • Mexico
      • Pricing Analysis
      • Market Share Analysis, 2024
        • By Grade
        • By End-Use Application
    • Argentina
      • Pricing Analysis
      • Market Share Analysis, 2024
        • By Grade
        • By End-Use Application
  17. Market Structure Analysis
    • Competition Dashboard
    • Competition Benchmarking
    • Market Share Analysis of Top Players
      • By Regional
      • By Grade
      • By End-Use Application
  18. Competition Analysis
    • Competition Deep Dive
      • MTC Industries
        • Overview
        • Product Portfolio
        • Profitability by Market Segments (Product/Age /Sales Channel/Region)
        • Sales Footprint
        • Strategy Overview
          • Marketing Strategy
          • Product Strategy
          • Channel Strategy
      • Stauber USA
        • Overview
        • Product Portfolio
        • Profitability by Market Segments (Product/Age /Sales Channel/Region)
        • Sales Footprint
        • Strategy Overview
          • Marketing Strategy
          • Product Strategy
          • Channel Strategy
      • Foodchem International Corporation
        • Overview
        • Product Portfolio
        • Profitability by Market Segments (Product/Age /Sales Channel/Region)
        • Sales Footprint
        • Strategy Overview
          • Marketing Strategy
          • Product Strategy
          • Channel Strategy
      • The Honjo Chemical Corporation
        • Overview
        • Product Portfolio
        • Profitability by Market Segments (Product/Age /Sales Channel/Region)
        • Sales Footprint
        • Strategy Overview
          • Marketing Strategy
          • Product Strategy
          • Channel Strategy
      • Qianjiang Yongan Pharmaceutical Co. Ltd.
        • Overview
        • Product Portfolio
        • Profitability by Market Segments (Product/Age /Sales Channel/Region)
        • Sales Footprint
        • Strategy Overview
          • Marketing Strategy
          • Product Strategy
          • Channel Strategy
      • New Zealand Pharmaceutical Ltd.
        • Overview
        • Product Portfolio
        • Profitability by Market Segments (Product/Age /Sales Channel/Region)
        • Sales Footprint
        • Strategy Overview
          • Marketing Strategy
          • Product Strategy
          • Channel Strategy
      • Ajinomoto Co. Inc.
        • Overview
        • Product Portfolio
        • Profitability by Market Segments (Product/Age /Sales Channel/Region)
        • Sales Footprint
        • Strategy Overview
          • Marketing Strategy
          • Product Strategy
          • Channel Strategy
      • Kyowa Hakko Bio Co. Ltd.
        • Overview
        • Product Portfolio
        • Profitability by Market Segments (Product/Age /Sales Channel/Region)
        • Sales Footprint
        • Strategy Overview
          • Marketing Strategy
          • Product Strategy
          • Channel Strategy
      • Jiangsu Yuanyang Chemical Co. Ltd.
        • Overview
        • Product Portfolio
        • Profitability by Market Segments (Product/Age /Sales Channel/Region)
        • Sales Footprint
        • Strategy Overview
          • Marketing Strategy
          • Product Strategy
          • Channel Strategy
      • Funchi Pharmaceutical Co., Ltd.
        • Overview
        • Product Portfolio
        • Profitability by Market Segments (Product/Age /Sales Channel/Region)
        • Sales Footprint
        • Strategy Overview
          • Marketing Strategy
          • Product Strategy
          • Channel Strategy
      • Penta Manufacturing Company
        • Overview
        • Product Portfolio
        • Profitability by Market Segments (Product/Age /Sales Channel/Region)
        • Sales Footprint
        • Strategy Overview
          • Marketing Strategy
          • Product Strategy
          • Channel Strategy
      • Mitsui Chemicals, Inc.
        • Overview
        • Product Portfolio
        • Profitability by Market Segments (Product/Age /Sales Channel/Region)
        • Sales Footprint
        • Strategy Overview
          • Marketing Strategy
          • Product Strategy
          • Channel Strategy
      • AuNutra Industries Inc.
        • Overview
        • Product Portfolio
        • Profitability by Market Segments (Product/Age /Sales Channel/Region)
        • Sales Footprint
        • Strategy Overview
          • Marketing Strategy
          • Product Strategy
          • Channel Strategy
  19. Assumptions & Acronyms Used
  20. Research Methodology

List of Tables

  • Table 1: Global Market Value (USD Million) Forecast by Region, 2020-2035
  • Table 2: Global Market Volume (Metric Tons) Forecast by Region, 2020-2035
  • Table 3: Global Market Value (USD Million) Forecast by Grade, 2020-2035
  • Table 4: Global Market Volume (Metric Tons) Forecast by Grade, 2020-2035
  • Table 5: Global Market Value (USD Million) Forecast by End-Use Application, 2020-2035
  • Table 6: Global Market Volume (Metric Tons) Forecast by End-Use Application, 2020-2035
  • Table 7: North America Market Value (USD Million) Forecast by Country, 2020-2035
  • Table 8: North America Market Volume (Metric Tons) Forecast by Country, 2020-2035
  • Table 9: North America Market Value (USD Million) Forecast by Grade, 2020-2035
  • Table 10: North America Market Volume (Metric Tons) Forecast by Grade, 2020-2035
  • Table 11: North America Market Value (USD Million) Forecast by End-Use Application, 2020-2035
  • Table 12: North America Market Volume (Metric Tons) Forecast by End-Use Application, 2020-2035
  • Table 13: Latin America Market Value (USD Million) Forecast by Country, 2020-2035
  • Table 14: Latin America Market Volume (Metric Tons) Forecast by Country, 2020-2035
  • Table 15: Latin America Market Value (USD Million) Forecast by Grade, 2020-2035
  • Table 16: Latin America Market Volume (Metric Tons) Forecast by Grade, 2020-2035
  • Table 17: Latin America Market Value (USD Million) Forecast by End-Use Application, 2020-2035
  • Table 18: Latin America Market Volume (Metric Tons) Forecast by End-Use Application, 2020-2035
  • Table 19: Western Europe Market Value (USD Million) Forecast by Country, 2020-2035
  • Table 20: Western Europe Market Volume (Metric Tons) Forecast by Country, 2020-2035
  • Table 21: Western Europe Market Value (USD Million) Forecast by Grade, 2020-2035
  • Table 22: Western Europe Market Volume (Metric Tons) Forecast by Grade, 2020-2035
  • Table 23: Western Europe Market Value (USD Million) Forecast by End-Use Application, 2020-2035
  • Table 24: Western Europe Market Volume (Metric Tons) Forecast by End-Use Application, 2020-2035
  • Table 25: Eastern Europe Market Value (USD Million) Forecast by Country, 2020-2035
  • Table 26: Eastern Europe Market Volume (Metric Tons) Forecast by Country, 2020-2035
  • Table 27: Eastern Europe Market Value (USD Million) Forecast by Grade, 2020-2035
  • Table 28: Eastern Europe Market Volume (Metric Tons) Forecast by Grade, 2020-2035
  • Table 29: Eastern Europe Market Value (USD Million) Forecast by End-Use Application, 2020-2035
  • Table 30: Eastern Europe Market Volume (Metric Tons) Forecast by End-Use Application, 2020-2035
  • Table 31: East Asia Market Value (USD Million) Forecast by Country, 2020-2035
  • Table 32: East Asia Market Volume (Metric Tons) Forecast by Country, 2020-2035
  • Table 33: East Asia Market Value (USD Million) Forecast by Grade, 2020-2035
  • Table 34: East Asia Market Volume (Metric Tons) Forecast by Grade, 2020-2035
  • Table 35: East Asia Market Value (USD Million) Forecast by End-Use Application, 2020-2035
  • Table 36: East Asia Market Volume (Metric Tons) Forecast by End-Use Application, 2020-2035
  • Table 37: South Asia & Pacific Market Value (USD Million) Forecast by Country, 2020-2035
  • Table 38: South Asia & Pacific Market Volume (Metric Tons) Forecast by Country, 2020-2035
  • Table 39: South Asia & Pacific Market Value (USD Million) Forecast by Grade, 2020-2035
  • Table 40: South Asia & Pacific Market Volume (Metric Tons) Forecast by Grade, 2020-2035
  • Table 41: South Asia & Pacific Market Value (USD Million) Forecast by End-Use Application, 2020-2035
  • Table 42: South Asia & Pacific Market Volume (Metric Tons) Forecast by End-Use Application, 2020-2035
  • Table 43: Middle East and Africa Market Value (USD Million) Forecast by Country, 2020-2035
  • Table 44: Middle East and Africa Market Volume (Metric Tons) Forecast by Country, 2020-2035
  • Table 45: Middle East and Africa Market Value (USD Million) Forecast by Grade, 2020-2035
  • Table 46: Middle East and Africa Market Volume (Metric Tons) Forecast by Grade, 2020-2035
  • Table 47: Middle East and Africa Market Value (USD Million) Forecast by End-Use Application, 2020-2035
  • Table 48: Middle East and Africa Market Volume (Metric Tons) Forecast by End-Use Application, 2020-2035

List of Figures

  • Figure 1: Global Market Volume (Metric Tons) Forecast 2020-2035
  • Figure 2: Global Market Pricing Analysis
  • Figure 3: Global Market Value (USD Million) Forecast 2020-2035
  • Figure 4: Global Market Value Share and BPS Analysis by Grade, 2025 and 2035
  • Figure 5: Global Market Y-o-Y Growth Comparison by Grade, 2025-2035
  • Figure 6: Global Market Attractiveness Analysis by Grade
  • Figure 7: Global Market Value Share and BPS Analysis by End-Use Application, 2025 and 2035
  • Figure 8: Global Market Y-o-Y Growth Comparison by End-Use Application, 2025-2035
  • Figure 9: Global Market Attractiveness Analysis by End-Use Application
  • Figure 10: Global Market Value (USD Million) Share and BPS Analysis by Region, 2025 and 2035
  • Figure 11: Global Market Y-o-Y Growth Comparison by Region, 2025-2035
  • Figure 12: Global Market Attractiveness Analysis by Region
  • Figure 13: North America Market Incremental $ Opportunity, 2025-2035
  • Figure 14: Latin America Market Incremental $ Opportunity, 2025-2035
  • Figure 15: Western Europe Market Incremental $ Opportunity, 2025-2035
  • Figure 16: Eastern Europe Market Incremental $ Opportunity, 2025-2035
  • Figure 17: East Asia Market Incremental $ Opportunity, 2025-2035
  • Figure 18: South Asia & Pacific Market Incremental $ Opportunity, 2025-2035
  • Figure 19: Middle East and Africa Market Incremental $ Opportunity, 2025-2035
  • Figure 20: North America Market Value Share and BPS Analysis by Country, 2025 and 2035
  • Figure 21: North America Market Value Share and BPS Analysis by Grade, 2025 and 2035
  • Figure 22: North America Market Y-o-Y Growth Comparison by Grade, 2025-2035
  • Figure 23: North America Market Attractiveness Analysis by Grade
  • Figure 24: North America Market Value Share and BPS Analysis by End-Use Application, 2025 and 2035
  • Figure 25: North America Market Y-o-Y Growth Comparison by End-Use Application, 2025-2035
  • Figure 26: North America Market Attractiveness Analysis by End-Use Application
  • Figure 27: Latin America Market Value Share and BPS Analysis by Country, 2025 and 2035
  • Figure 28: Latin America Market Value Share and BPS Analysis by Grade, 2025 and 2035
  • Figure 29: Latin America Market Y-o-Y Growth Comparison by Grade, 2025-2035
  • Figure 30: Latin America Market Attractiveness Analysis by Grade
  • Figure 31: Latin America Market Value Share and BPS Analysis by End-Use Application, 2025 and 2035
  • Figure 32: Latin America Market Y-o-Y Growth Comparison by End-Use Application, 2025-2035
  • Figure 33: Latin America Market Attractiveness Analysis by End-Use Application
  • Figure 34: Western Europe Market Value Share and BPS Analysis by Country, 2025 and 2035
  • Figure 35: Western Europe Market Value Share and BPS Analysis by Grade, 2025 and 2035
  • Figure 36: Western Europe Market Y-o-Y Growth Comparison by Grade, 2025-2035
  • Figure 37: Western Europe Market Attractiveness Analysis by Grade
  • Figure 38: Western Europe Market Value Share and BPS Analysis by End-Use Application, 2025 and 2035
  • Figure 39: Western Europe Market Y-o-Y Growth Comparison by End-Use Application, 2025-2035
  • Figure 40: Western Europe Market Attractiveness Analysis by End-Use Application
  • Figure 41: Eastern Europe Market Value Share and BPS Analysis by Country, 2025 and 2035
  • Figure 42: Eastern Europe Market Value Share and BPS Analysis by Grade, 2025 and 2035
  • Figure 43: Eastern Europe Market Y-o-Y Growth Comparison by Grade, 2025-2035
  • Figure 44: Eastern Europe Market Attractiveness Analysis by Grade
  • Figure 45: Eastern Europe Market Value Share and BPS Analysis by End-Use Application, 2025 and 2035
  • Figure 46: Eastern Europe Market Y-o-Y Growth Comparison by End-Use Application, 2025-2035
  • Figure 47: Eastern Europe Market Attractiveness Analysis by End-Use Application
  • Figure 48: East Asia Market Value Share and BPS Analysis by Country, 2025 and 2035
  • Figure 49: East Asia Market Value Share and BPS Analysis by Grade, 2025 and 2035
  • Figure 50: East Asia Market Y-o-Y Growth Comparison by Grade, 2025-2035
  • Figure 51: East Asia Market Attractiveness Analysis by Grade
  • Figure 52: East Asia Market Value Share and BPS Analysis by End-Use Application, 2025 and 2035
  • Figure 53: East Asia Market Y-o-Y Growth Comparison by End-Use Application, 2025-2035
  • Figure 54: East Asia Market Attractiveness Analysis by End-Use Application
  • Figure 55: South Asia & Pacific Market Value Share and BPS Analysis by Country, 2025 and 2035
  • Figure 56: South Asia & Pacific Market Value Share and BPS Analysis by Grade, 2025 and 2035
  • Figure 57: South Asia & Pacific Market Y-o-Y Growth Comparison by Grade, 2025-2035
  • Figure 58: South Asia & Pacific Market Attractiveness Analysis by Grade
  • Figure 59: South Asia & Pacific Market Value Share and BPS Analysis by End-Use Application, 2025 and 2035
  • Figure 60: South Asia & Pacific Market Y-o-Y Growth Comparison by End-Use Application, 2025-2035
  • Figure 61: South Asia & Pacific Market Attractiveness Analysis by End-Use Application
  • Figure 62: Middle East and Africa Market Value Share and BPS Analysis by Country, 2025 and 2035
  • Figure 63: Middle East and Africa Market Value Share and BPS Analysis by Grade, 2025 and 2035
  • Figure 64: Middle East and Africa Market Y-o-Y Growth Comparison by Grade, 2025-2035
  • Figure 65: Middle East and Africa Market Attractiveness Analysis by Grade
  • Figure 66: Middle East and Africa Market Value Share and BPS Analysis by End-Use Application, 2025 and 2035
  • Figure 67: Middle East and Africa Market Y-o-Y Growth Comparison by End-Use Application, 2025-2035
  • Figure 68: Middle East and Africa Market Attractiveness Analysis by End-Use Application
  • Figure 69: Global Market - Tier Structure Analysis
  • Figure 70: Global Market - Company Share Analysis

Frequently Asked Questions

What is the projected size of the taurine market in 2025?

The market is valued at USD 476.4 million in 2025.

What is the outlook on taurine demand by 2035?

The market is forecasted to reach USD 954.8 million by 2035, reflecting a CAGR of 7.2%.

Which segment leads the taurine market by grade in 2025?

Food grade taurine will lead the grade segment, accounting for 48% of the global market share in 2025.

What is the top end use application for the taurine market in 2025?

Dietary supplements will dominate the end-use application segment with a 24% share in 2025.

Which country is projected to have the fastest-growing taurine market?

Japan is projected to grow at the fastest rate, with a CAGR of 7.9% from 2025 to 2035.

Explore Similar Insights

Future Market Insights

Taurine Market