Thermos Drinkware Market Size and Share Forecast Outlook 2025 to 2035
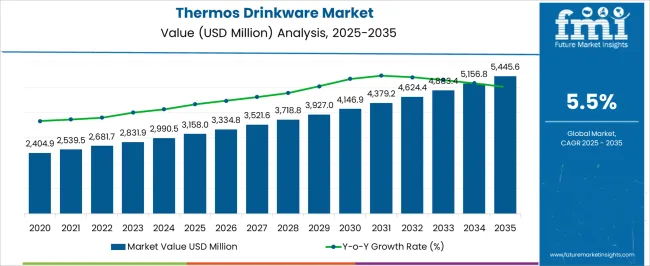
The Thermos Drinkware Market is estimated to be valued at USD 3158.0 million in 2025 and is projected to reach USD 5445.6 million by 2035, registering a compound annual growth rate (CAGR) of 5.5% over the forecast period.
Quick Stats for Thermos Drinkware Market
- Thermos Drinkware Market Industry Value (2025): USD 3158.0 million
- Thermos Drinkware Market Forecast Value (2035): USD 5445.6 million
- Thermos Drinkware Market Forecast CAGR: 5.5%
- Leading Segment in Thermos Drinkware Market in 2025: Mugs And Tumblers (42.7%)
- Key Growth Region in Thermos Drinkware Market: North America, Asia-Pacific, Europe
- Top Key Players in Thermos Drinkware Market: Thermos L.L.C., Sigg Switzerland AG, Tiger Corporation, Camelbak, Zojirushi America Corporation, Stanley PMI, Klean Kanteen, Hydro Flask, Kinto Co., Ltd., Contigo Brands
| Metric |
Value |
| Thermos Drinkware Market Estimated Value in (2025 E) |
USD 3158.0 million |
| Thermos Drinkware Market Forecast Value in (2035 F) |
USD 5445.6 million |
| Forecast CAGR (2025 to 2035) |
5.5% |
Rationale for Segmental Growth in the Thermos Drinkware Market
The thermos drinkware market is experiencing robust growth, fueled by lifestyle changes, increasing health awareness, and rising consumer preference for portable, insulated drinkware. The market is being driven by demand for durable, reusable products that support sustainability and reduce reliance on single-use plastics.
Innovations in vacuum insulation technology, ergonomic designs, and aesthetic appeal have further strengthened adoption across demographics. The current market landscape shows strong demand from both household and on-the-go use, with premiumization trends expanding margins.
E-commerce platforms and brand diversification have widened accessibility and consumer engagement. With ongoing emphasis on sustainability and hydration convenience, the market outlook remains highly favorable.
Segmental Analysis
Insights into the Mugs and Tumblers Segment
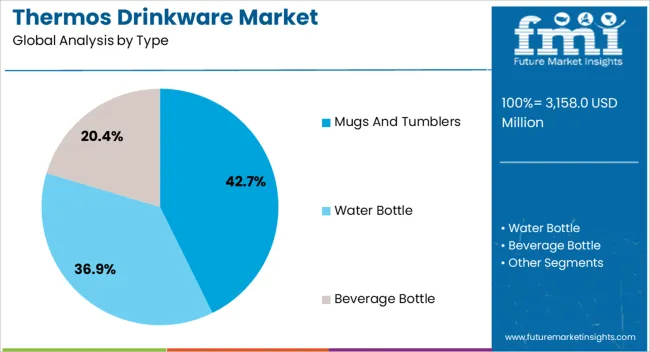
The mugs and tumblers segment leads the type category with approximately 42.7% share, underscoring its popularity as versatile everyday drinkware. Its dominance is supported by high adoption in both home and office environments, where functionality and portability are prioritized.
Manufacturers have expanded offerings with stainless steel, BPA-free, and custom-designed options to attract diverse consumer groups. The segment also benefits from strong gifting and promotional demand.
With continuous innovation in thermal retention and aesthetic designs, mugs and tumblers are expected to maintain their leading market share.
Insights into the Everyday Use Segment
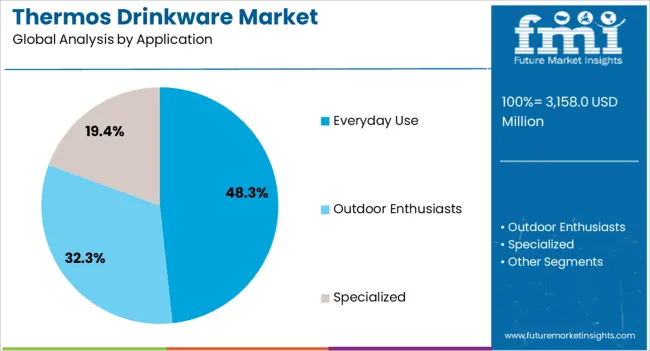
The everyday use segment dominates the application category, holding approximately 48.3% share. This segment’s growth is driven by increasing consumer preference for convenient hydration solutions in daily routines, including work, travel, and leisure.
The segment benefits from strong alignment with lifestyle-driven demand for reusable and eco-friendly products. Retailers and brands are focusing on marketing everyday use drinkware as essential accessories, further reinforcing adoption.
With expanding consumer awareness of sustainability and functionality, the everyday use segment is projected to retain its market leadership.
Insights into the 500 Ml to 1000 Ml Segment
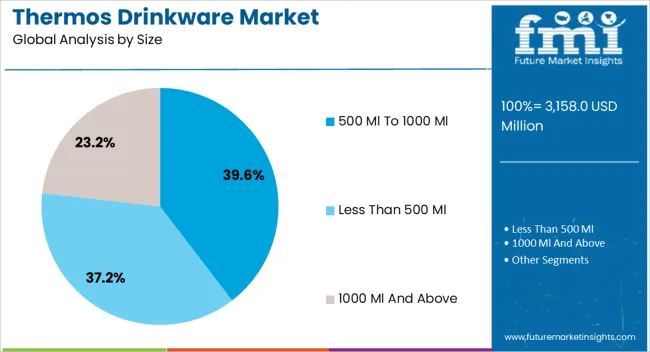
The 500 ml to 1000 ml segment accounts for approximately 39.6% share of the size category, reflecting its balance between portability and sufficient capacity for hydration. This range is considered optimal for personal daily use, offering practicality without excessive bulk.
Consumers favor this size for commuting, fitness activities, and office use, ensuring consistent demand. Manufacturers have responded with a wide variety of styles, finishes, and performance-enhancing features.
With stable adoption across multiple end-use scenarios, the 500 ml to 1000 ml segment is expected to sustain its leadership in the coming years.
Historical Analysis of the Thermos Drinkware Market
The thermos drinkware market was valued at USD 2,990.50 million in 2025. The rising focus on sustainability contributed to the market's rapid expansion. The increased demand for thermos drinkware from sports enthusiasts also contributed to the market’s progress during the historical period. The growing popularity of activities such as hiking, cycling, etc., enhanced sales of thermos drinkware.
| Attributes |
Details |
| Historical market valuation, 2025 |
USD 2,990.50 million |
Trends and Analysis in the Thermos Drinkware Market
- Rising global awareness of plastic pollution is encouraging customers to avoid plastic bottled water, boosting market growth for stainless steel water bottles. The adoption of a healthier lifestyle among consumers to stay hydrated is likely to drive product sales throughout the projection period.
- The decreasing plastic production owing to reduced greenhouse gas emissions is expected to create significant opportunities in the market.
- Increasing environmental awareness, thermos bottles are popular for decreasing the consumption of single-use plastic or paper cups, which supports sustainability efforts. At the same time, the market offers stylish and personalized thermos bottle designs, which appeal to consumers interested in aesthetics and personalization.
- Reusable water bottles are highly preferred by consumers. Despite the high initial cost, they provide long-term savings as bottled water expenses increase.
- Governments across the world are taking steps to gradually reduce single-use plastic water bottles in favour of reusable water bottles made of glass, metals, and other environmentally beneficial and safe materials.
- The introduction of luxury thermos water bottles by leading design companies has generated substantial interest in consumers with better purchasing power and a more defined sense of style and fashion.
- The increasing awareness of sustainability and recyclability of product materials is expected to create significant opportunities during the forecast period. Moreover, adapting eco-friendly products worldwide further contributes to the market's growth.
- The integration of automation and advanced features in a thermos, such as heat indicators and automated heating and cooling capacity, increases revenue while reducing manual efforts.
- Consumer trends and preferences for appealing colors and designs offered by market players are also significantly contributing to the market. Consumers are increasingly adopting reusable thermos drinkware as a result of changing lifestyles, environmental concerns, health considerations, etc.
- The rising social media adoption has increased consumer awareness of customized and personalized thermos drinkware, which is projected to support industry expansion.
- Several industries are using IoT technology to create user-friendly and intelligent products. Using Internet of Things (IoT) technology, smart thermos drinkware bottles are being produced by manufacturers. IoT technologies connect product designers and users to collect real-time data usage.
Challenges Limiting Growth in the Thermos Drinkware Market
- The increased competition from alternative products and materials claiming similar insulating features is expected to hinder the market.
- As consumers become more environmentally conscious, there is an increasing need for eco-friendly and sustainable options, such as reusable glass or stainless-steel containers, posing limitations for traditional thermos drinkware made from materials that may not align with evolving sustainability expectations.
- The easy and widespread availability of lower-cost bottle products hinders industry expansion. Furthermore, using a stainless-steel thermos bottle for extended periods is expected to increase the chance of liquid contamination, reducing product demand. The intense competition of local industry competitors has hampered future market expansion.
Thermos Drinkware Industry Analysis by Top Investment Segments
The thermos drinkware market can be split up into two categories: product type and sales channel. The water bottle segment is expected to dominate the product type category. Online retailers facilitate higher sales of the products in the thermos drinkware market.
The Water Bottle Segment Dominates the Market by Product Type
The water bottle segment is projected to hold a market share of 50.20% in 2025 due to the rising popularity of thermos water bottles among students and athletes. These bottles provide health benefits along with the convenience of keeping water at room temperature. This widespread utilization of water bottles is enhancing their sales, contributing to the market’s growth.
| Attributes |
Details |
| Top Product Type |
Water Bottle |
| Market Share in 2025 |
50.20% |
The Online Retailers Segment Dominates the Market by Sales Channel
The online retailers segment is expected to hold a market share of 23.60% in 2025. The growing popularity of the channel among consumers is due to the product availability under one roof and an influential layout, which encourages customers to buy products from these stores.
| Attributes |
Details |
| Top Sales Channel |
Online Retailers |
| Market Share in 2025 |
23.60% |
Analysis of Top Countries Manufacturing, Distributing, Marketing, and Using Thermos Drinkware
The market's depth has increased over the years. However, certain regions account for a significant portion of the market share. The major countries with higher growth prospects in the market have been highlighted in the table below.
The market is dominated by North America, Europe, and Asia Pacific. Growing trends in Europe and North America have increased sales of portable drinkware. The growing demand for sustainable products in Asia Pacific contributes to the market’s growth.
| Countries |
CAGR (2025 to 2035) |
| United States |
5.50% |
| India |
5.90% |
| Germany |
5.70% |
| China |
5.80% |
| Australia |
6.10% |
Thermos Drinkware Market in the United States
- The increasing popularity of outdoor activities like hiking, camping, and cycling in the country drives the thermos drinkware market.
- The rising awareness of the health benefits of staying hydrated also contributes to the market growth. Moreover, the rising disposable income of consumers is enabling them to invest in high-quality drinkware that can keep their beverages hot or cold for an extended period.
Thermos Drinkware Market in India
- The growing awareness of the health advantages of being hydrated has resulted in the growth in demand for insulated drinkware in the region that can keep liquids hot or cold for a prolonged period.
- The rising popularity of sports activities has also aided market expansion. The thermos drinkware industry is likely to increase further over the coming years.
Thermos Drinkware Market in Germany
- Urbanization, increased consumer disposable incomes, and the growing popularity of online shopping are all important factors driving market expansion in the country.
- These factors have contributed to an increase in demand for numerous items and services across several industries, including retail. As a result, to remain relevant and competitive in the market, companies are responding to shifting customer trends and preferences.
Thermos Drinkware Market in China
- The rising trend of urban living is stimulating the demand for portable drinkware, including thermos bottles, to provide a convenient solution for staying hydrated at work.
- Furthermore, people in Asian countries have a common habit of drinking hot water throughout the day, which is said to have health benefits.
Competitive Landscape of the Thermos Drinkware Market
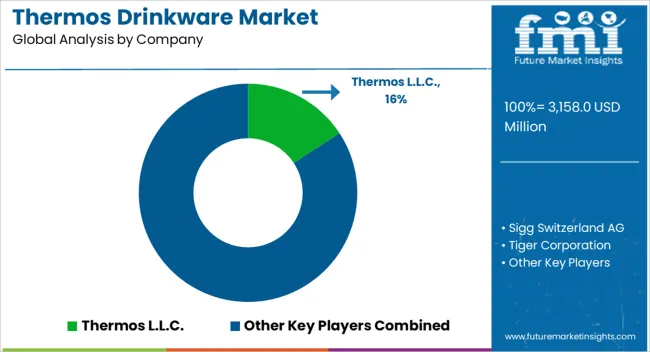
Market profitability is defined by cost efficiency. Companies are concentrating on manufacturing process optimization.
The majority of companies are focusing on providing customized solutions. The major businesses in the global thermos drinkware market are focusing on the production and expansion of their drinkware range globally.
Recent Developments in the Thermos Drinkware Market
- In 2025, MIJIS Thermos Flask is a new product from Xiaomi. This thermos has a 1.8 L capacity. The product is designed for long-term cold storage and heat retention.
- In 2025, Thermos L.L.C. has announced the launch of the all-new IconTM Series. The new product line includes hot beverage and food preservation options and an expanded range that includes cold beverages and hydration products. These offerings promote consumer convenience, with all goods incorporating a GriptecTM Non-Slip Base and a True-CoatTM Finish, providing a user-friendly design.
- In 2025, Hydro Flask launched new TempShield insulation technology, which claims to keep drinks cold for up to 24 hours and hot for up to 12 hours.
- In 2025, Tiger Corporation introduced the new MoMA Collection of thermos products designed by Naoto Fukasawa, a prominent Japanese designer.
- In 2025, Contigo launched a new Autoseal XL mug with a larger capacity for those who need more hydration.
- In 2025, L.L.C. launched a new Hydration Collection of drinkware with features designed to keep users hydrated on the go.
Key Players in the Thermos Drinkware Industry
- Thermos L.L.C. (USA)
- YETI Holding Inc. (USA)
- Contigo (USA)
- Hydro Flask (USA)
- Stanley PMI (USA)
- Zojirushi America Corporation (Japan)
- Klean Kanteen (USA)
- Camelbak (USA)
- Sigg Switzerland AG (Switzerland)
- Tiger Corporation (Japan)
- KINTO Co., Ltd. (Japan)
- Miir (USA)
- Mizu Life (USA)
- The BlenderBottle (USA)
- Igloo (USA)
- Ello Products (USA)
- Nalgene (USA)
Top Segments Studied in the Thermos Drinkware Market Report
By Product Type:
- Water Bottle
- Mugs and Tumblers
- Beverage Bottle
By Sales Channel:
- Specialty Stores
- Convenience Stores
- Supermarkets/Hypermarkets
- Online retailers
By Region:
- North America
- Latin America
- Europe
- South Asia
- East Asia
- Oceania
- Middle East and Africa (MEA)
Frequently Asked Questions
How big is the thermos drinkware market in 2025?
The global thermos drinkware market is estimated to be valued at USD 3,158.0 million in 2025.
What will be the size of thermos drinkware market in 2035?
The market size for the thermos drinkware market is projected to reach USD 5,445.6 million by 2035.
How much will be the thermos drinkware market growth between 2025 and 2035?
The thermos drinkware market is expected to grow at a 5.5% CAGR between 2025 and 2035.
What are the key product types in the thermos drinkware market?
The key product types in thermos drinkware market are mugs and tumblers, water bottle and beverage bottle.
Which application segment to contribute significant share in the thermos drinkware market in 2025?
In terms of application, everyday use segment to command 48.3% share in the thermos drinkware market in 2025.


