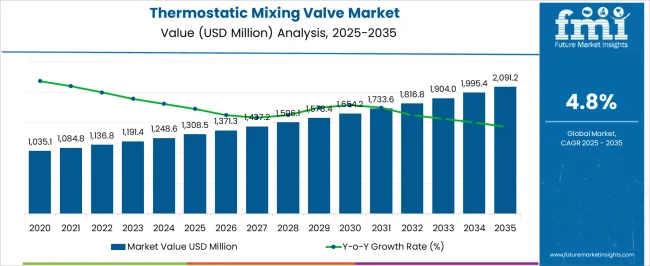
The Thermostatic Mixing Valve Market is estimated to be valued at USD 1308.5 million in 2025 and is projected to reach USD 2091.2 million by 2035, registering a compound annual growth rate (CAGR) of 4.8% over the forecast period.
| Metric | Value |
|---|---|
| Thermostatic Mixing Valve Market Estimated Value in (2025 E) | USD 1308.5 million |
| Thermostatic Mixing Valve Market Forecast Value in (2035 F) | USD 2091.2 million |
| Forecast CAGR (2025 to 2035) | 4.8% |
The thermostatic mixing valve market is registering steady expansion, driven by the rising focus on water safety, energy efficiency, and compliance with temperature control regulations across residential, commercial, and healthcare applications. These valves are critical in ensuring consistent water temperatures, preventing scalding, and supporting energy-efficient hot water systems.
Market growth is being reinforced by stricter building codes, increasing awareness of hygiene standards, and the expansion of centralized hot water supply systems. Product innovation, including compact designs, advanced sensing technologies, and antimicrobial coatings, has further strengthened adoption.
The current landscape is shaped by strong demand in both developed and emerging regions, with significant uptake in renovation and retrofitting projects. Looking ahead, continued investments in sustainable infrastructure and healthcare facilities are expected to enhance market prospects.
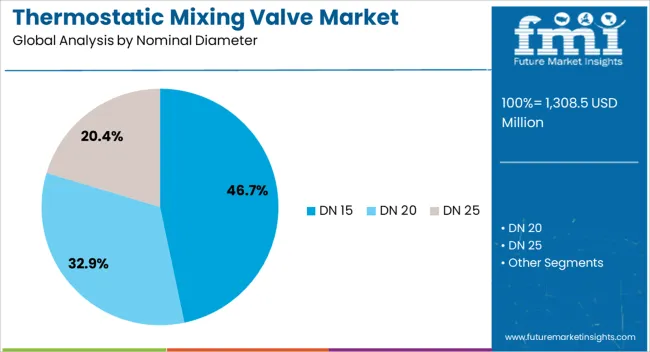
The DN 15 segment leads the nominal diameter category, holding approximately 46.70% share in the thermostatic mixing valve market. Its dominance is attributed to widespread use in residential and commercial applications, where compact design and compatibility with small-scale systems are essential.
DN 15 valves provide precise temperature control and efficient water flow management, ensuring compliance with safety standards in bathrooms, kitchens, and healthcare facilities. The segment benefits from high demand in renovation projects and retrofitting of existing systems.
With rising adoption of water-saving technologies and increasing construction of multi-family housing units, the DN 15 segment is expected to retain its leadership in the near term.
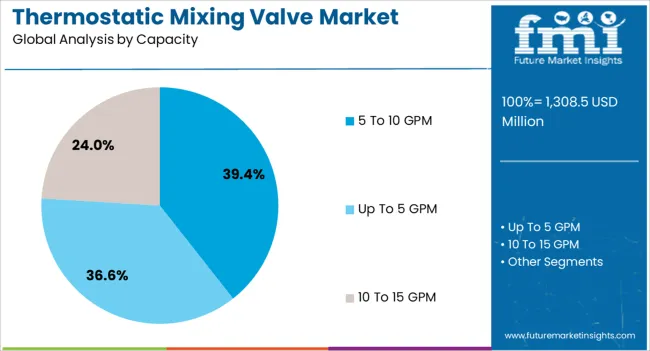
The 5 to 10 GPM segment accounts for approximately 39.40% of the capacity category, supported by its suitability for medium-capacity hot water distribution systems. This capacity range balances energy efficiency with sufficient flow rates for multi-point applications in residential and commercial buildings.
Growing adoption in institutional facilities such as schools and hospitals has reinforced demand. The segment’s appeal lies in its reliability, ease of installation, and ability to maintain consistent outlet temperatures under fluctuating inlet conditions.
With ongoing expansion in commercial construction and healthcare infrastructure, the 5 to 10 GPM segment is projected to remain a key contributor to market growth.
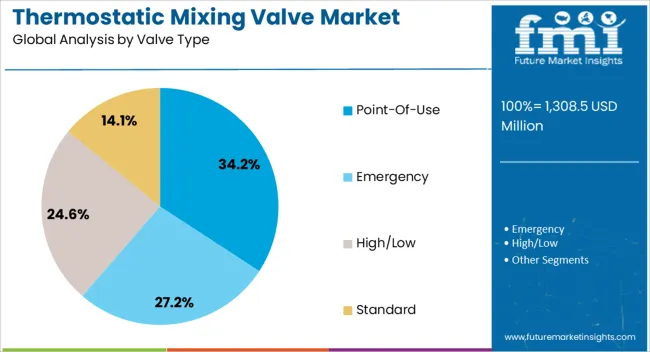
The point-of-use segment dominates the valve type category, holding approximately 34.20% share. Its leadership is driven by the rising need for localized temperature control in showers, faucets, and washbasins.
Point-of-use valves enhance user safety by reducing the risk of scalding, particularly in residential and institutional environments. Growing emphasis on hygiene and water conservation has accelerated adoption across hospitals, nursing homes, and schools.
The compact size and ease of integration into existing systems have further strengthened the segment’s position. With continued regulatory enforcement of water safety standards, point-of-use thermostatic mixing valves are expected to sustain their strong market presence.
As per the latest thermostatic mixing valve market analysis, North America is expected to hold a dominant global market share of 42.3% in 2035. Several factors are expected to drive demand for TMVs and spur growth in the North America thermostatic mixing valve market. These include:
Stringent Safety Regulations and Standards - North America, including the United States and Canada, has a robust regulatory environment emphasizing safety in various industries. Regulations governing water temperature in healthcare facilities, commercial buildings, and residential structures encourage the use of thermostatic mixing valves. Compliance with these stringent standards ensures the safety of end-users, making TMVs a crucial component of plumbing systems.
Advancements in Building Construction - The construction industry in North America continues to experience strong growth, with ongoing infrastructure projects and a demand for modern buildings. As new constructions and renovations take place, there is a parallel need for advanced plumbing systems prioritizing user safety and comfort. TMVs, offering precise control over water temperatures, align with the quality and safety standards in construction practices.
Focus on Energy Efficiency - Energy efficiency remains a key concern in North America, with a growing emphasis on sustainable practices. Thermostatic mixing valves contribute to energy conservation by optimizing water temperatures and reducing the reliance on excessive heating or cooling. As environmentally conscious practices become integral to construction and building management, the adoption of TMVs will likely increase, driving the region's demand.
Technological Innovations and Smart Solutions - The North American market is often quick to embrace technological innovations. Thermostatic mixing valves are no exception, and manufacturers in the region are likely to invest in smart and connected solutions. Integration with building management systems, remote monitoring, and control features align with the tech-savvy preferences of consumers and businesses in North America, contributing to the region's prominence in TMV manufacturing.
Growing Healthcare Infrastructure - The healthcare sector in North America is continuously expanding, driven by factors such as an aging population and technological advancements in medical care. In healthcare facilities, precise temperature control is critical for patient safety, making TMVs essential components. The growth of the healthcare industry further fuels the demand for thermostatic mixing valves, solidifying North America's position as a hotbed for manufacturers.
Public Health Awareness Post-pandemic - The COVID-19 pandemic has heightened public awareness regarding hygiene and health safety. In response, there is an increased focus on maintaining sanitary conditions in public spaces, commercial buildings, and healthcare facilities. Thermostatic mixing valves play a role in ensuring that water is delivered at safe and controlled temperatures, contributing to overall hygiene practices. The heightened awareness of health and safety post-pandemic is likely to drive the demand for TMVs in North America.
The TMV market has witnessed technological innovations, including the integration of smart features, during the last few years. Certain TMVs now come with digital controls, remote monitoring capabilities, and connectivity to building management systems, enhancing overall control and efficiency.
Growing demand for thermostatic mixing valves from residential, industrial, and commercial sectors is expected to boost the market through 2035. TMVs are commonly used in residential buildings for showers, faucets, and other water outlets to prevent scalding and maintain comfortable water temperatures.
In commercial settings, such as hotels, schools, and office buildings, TMVs are crucial for safety compliance and providing consistent water temperatures. Hospitals and healthcare facilities use TMVs to ensure precise control of water temperatures for patient safety and infection control.
Innovation is becoming a key success tool for manufacturers. Several companies are constantly introducing new thermostatic mixing valves to boost their sales. For instance:
Global thermostatic mixing valve sales grew at a CAGR of 1.7% between 2020 and 2025. Total market revenue reached about USD 1,140.1 million in 2025. In the forecast period, the thermostatic mixing valve industry is projected to expand at a CAGR of 4.8%.
| Historical CAGR (2020 to 2025) | 1.7% |
|---|---|
| Forecast CAGR (2025 to 2035) | 4.8% |
The drastic change in CAGR from the historical to the projected period is due to increasing demand from various application areas. Growing awareness of safety from scalding injuries, especially among children & old age people, is another key factor that will boost the market.
The recovery in the residential & commercial construction sectors will increase the demand for plumbing & water solutions. This, in turn, is expected to positively impact sales of thermostatic mixing valves in the forecast period.
The market is witnessing the integration of advanced technologies, such as digital controls and smart features, into TMVs. These innovations are expected to influence purchasing decisions in favor of more sophisticated and technologically advanced products.
Ongoing and potentially strengthened safety regulations are expected to drive sustained demand for TMVs as a critical component in ensuring water temperature safety. Further innovations in TMV technology may be anticipated, including enhanced smart features, connectivity, and improved user interfaces.
The integration of Internet of Things (IoT) capabilities might become more prevalent. The market could witness an increased emphasis on sustainability and energy efficiency, with TMVs playing a role in reducing water-heating energy consumption. Both regulatory requirements and consumer preferences for eco-friendly solutions may drive this trend.
Continued growth in the construction sector, particularly in regions with significant infrastructure development, will likely fuel demand for thermostatic mixing valves. The increasing awareness of safety standards in construction practices can also contribute to this growth.
Rising Importance of Carbon Neutral Economy in Developed Regions
Increasing global warming and its impacts have compelled countries to target a carbon-neutral economy. The United States government has deployed significant capital to achieve climate goals and target a robust clean energy economy. This is expected to positively impact thermostatic mixing valve demand due to their extensive application in solar thermal systems.
The European Union, through its huge investment in the Green Deal Plan, focuses on decarbonizing the building and infrastructural sector. It has given updated regulations to improve carbon performance and the use of renewable energy for new residential constructions. This is putting the hydronic heating systems into the spotlight.
Residential hydronic heating systems provide energy-saving solutions to end users, reducing environmental carbon emissions. Thermostatic mixing valve has the primary function of regulating water temperature in hydronic heating systems. The rising need for efficient solutions in residential buildings will likely drive the sales of thermostatic mixing valves through 2035.
Surging Importance of Hygiene and Sanitation
Continual water supply at residential homes has seen a rise in slimy growth inside pipes. Such a glue-like mixture of bacteria and fungi, named biofilm, increases health risks for humans. These biofilms provide a safe way for microbes and waterborne pathogens to cause legionella disease.
The presence of pathogens in home and industrial plumbing can have a damaging impact on human health. Rising cases of legionella disease in the United States and Europe have made customers more aware of waterborne diseases and their unfavorable impacts.
Customers are taking safety measures to protect themselves from unwanted diseases by regularly maintaining home plumbing systems. The thermostatic mixing valve helps increase sanitation and prevents end users from scalding and legionella diseases.
Growing demand for water heaters is expected to fuel sales of thermostatic mixing valves during the forecast period. This is because these valves are widely used in water heaters.
Rapid Expansion of the Real Estate Sector
Increasing urbanization has boosted the purchasing capability of individuals in the United States and Europe. Homebuilding in the United States has grown significantly in 2024, including single-family and multi-family housing projects. For instance, new residential construction projects in the United States increased 11.8% in Nov 2025.
The increased employment and disposable income in Europe have bolstered the demand for housing and property investment. Residential homes have vital applications of thermostatic mixing valves serving plumbing fixtures at homes.
The real estate sector in the developed economies is anticipated to expand rapidly during the forecast period. This, in turn, is expected to uplift demand for thermostatic mixing valves.
Expanding Food Processing and Manufacturing Facilities
Rising demand for processed food is resulting in the expansion of food and beverage establishments. This will likely create lucrative growth opportunities for thermostatic mixing valve manufacturing companies.
High temperature water is required in food processing and other industrial facilities. Thermostatic mixing valve provides constant and precise temperature control in processing facilities. Hence, the increasing manufacturing facilities of food and beverages are set to drive the demand for thermostatic mixing valves through 2035.
Growing Preference for Digital Mixing Valves over TMVs
Electronically controlled, digital mixing valves are gaining popularity due to their advanced and technological features, especially in commercial applications. Digital mixing valve allows customers to see temperatures and other valves. Remote communication through smart apps and thermal disinfection capability gives the technologically advanced mixing valve an added advantage.
A digital mixing valve (DMV) helps prevent recirculation temperature creep and provides handy features for the operator to view current performance conditions. DMV has extensive applications in thermal disinfection in Europe. Increasing demand for digital mixing valves might impact the growth of the thermostatic mixing valve industry.
Strict Distinct Regulations by Different Countries
Changing regulations by different local & international regulatory bodies for the production of thermostatic mixing valves can hamper market growth. Similarly, regulations related to maintenance of the thermostatic mixing valves can divert the end users to opt for other available options in the market. This can negatively impact the growth of the thermostatic mixing valve market in the forecast period.
Different countries and regions may have their own set of standards and regulations pertaining to water temperature control in plumbing systems. This diversity requires TMV manufacturers to adhere to a range of compliance requirements, which can be complex and costly.
Meeting various standards adds a layer of complexity to production and distribution processes. Complying with strict regulations often involves rigorous testing and certification processes. Manufacturers may need to invest significant resources to ensure that their TMV products meet the specific requirements of each country or region. This can lead to increased production costs, which, in turn, may affect the pricing of TMVs in the market.
The existence of distinct regulations can result in market fragmentation, with different product versions needed for different regions. This fragmentation can complicate inventory management and distribution logistics for manufacturers, particularly if they operate on a global scale.
Strict regulations can pose barriers to new entrants in the TMV market. Companies looking to expand their market presence or enter new geographical regions must navigate and comply with diverse regulatory landscapes, adding complexity to their entry strategies.
The table below highlights the thermostatic mixing valve market revenues in top countries. The United States and Canada are expected to remain the top consumers of thermostatic mixing valves, with expected valuations of USD 2091.2 million and USD 257.5 million, respectively, in 2035. This can be attributed to the expanding residential sector and rising usage of scald protection valves in these countries.
| Countries | Projected Thermostatic Mixing Valve Market Revenue (2035) |
|---|---|
| United States | USD 2091.2 million |
| Canada | USD 257.5 million |
| Germany | USD 141.2 million |
| United Kingdom | USD 140.9 million |
The below table shows the estimated growth rates of the top countries. The United Kingdom and Germany are set to record high CAGRs of 6.5% and 5.2%, respectively, through 2035.
| Countries | Projected Thermostatic Mixing Valve CAGR (2025 to 2035) |
|---|---|
| United Kingdom | 6.5% |
| Germany | 5.2% |
| Canada | 4.9% |
| United States | 4.1% |
As per the latest analysis, the United Kingdom is predicted to emerge as one of the lucrative markets for thermostatic mixing valve manufacturers during the forecast period. This is attributable to the country’s weather conditions and rising demand for hot water systems.
The United Kingdom is known for its robust regulatory environment, and safety standards in plumbing systems are strictly enforced. Thermostatic mixing valves play a crucial role in meeting these standards by ensuring precise control of water temperatures. The commitment to safety regulations can drive sustained demand for TMVs in various applications.
Ongoing infrastructure development, including residential and commercial construction projects, can contribute to the demand for TMVs. As the construction industry grows, the need for advanced plumbing systems with safety features like TMVs becomes more pronounced.
The healthcare sector, which relies heavily on precise water temperature control for patient safety, can be a significant contributor to the demand for TMVs. The United Kingdom's emphasis on healthcare infrastructure development and standards may drive the adoption of these devices.
Sales of thermostatic mixing valves in the United Kingdom are projected to soar at a CAGR of around 6.5% during the assessment period. By 2035, the United Kingdom thermostatic mixing valve market value is set to total USD 140.9 million by 2035.
The United States thermostatic mixing valve market size is anticipated to rise from USD 1308.5 million in 2025 to USD 2091.2 million by 2035. Overall demand for thermostatic mixing valves in the United States is projected to increase at 4.1% CAGR during the assessment period.
Several factors are expected to drive the growth of the thermostatic mixing valve market in the United States through 2035. These include the ongoing growth in new constructions, high investment by the local governments, rising adoption of anti-scald valves, and implementation of stringent regulations.
The United States has strict safety regulations governing various industries, including construction and healthcare. Compliance with these regulations often requires the installation of TMVs to prevent scalding and maintain safe water temperatures. This emphasis on safety standards can drive the demand for TMVs.
In healthcare settings, precise control of water temperature is crucial for patient safety. As the healthcare industry expands and modernizes, there is an increasing need for TMVs in hospitals and medical facilities, presenting opportunities for TMV manufacturers.
The United States also greatly emphasizes energy efficiency and sustainable building practices. TMVs align with these initiatives by optimizing water temperatures and reducing the need for excessive heating. Manufacturers offering energy-efficient TMV solutions may find favorable opportunities in the market.
The below section shows the residential segment dominating the global market for thermostatic mixing valves. It is forecast to thrive at a 4.6% CAGR between 2025 and 2035. Based on nominal diameter, the DN 20 segment is poised to exhibit a CAGR of 5.3% during the forecast period.
| Top Segment (Application) | Residential |
|---|---|
| Predicted CAGR (2025 to 2035) | 4.6% |
Based on application, the global thermostatic mixing valve industry is segmented into residential, commercial, and industrial. Among these, the adoption of thermostatic mixing valves remains high in the residential segment.
As per the latest analysis, demand for thermostatic mixing valves in the residential sector is projected to increase at 4.6% CAGR during the forecast period. It will likely have a total valuation of USD 2091.2 million by 2035.
Thermostatic mixing valves (TMVs) are widely used for plumbing solutions in the residential sector. They provide high-safety plumbing solutions for the safe, accurate, and constant flow of temperature-controlled water.
Residential consumers are a key driver of the TMV market, as they install anti-scald valves for various applications, such as showers and faucets, to ensure safety and comfort. These valves help prevent scalding, particularly in baths and showers where sudden changes in water temperature can be dangerous.
Ensuring safe water temperatures to prevent scalding is a significant concern in residential settings. TMVs are essential for meeting safety standards and providing consistent water temperatures, contributing to their widespread use in homes.
Both new constructions and renovations influence the residential category. As households invest in upgrading plumbing systems for safety and efficiency, the demand for TMVs will increase.
| Top Segment (Nominal Diameter Type) | DN 20 |
|---|---|
| Projected CAGR (2025 to 2035) | 5.3% |
As per the latest report, the DN 15 segment will likely retain its dominant position in the thermostatic mixing valve market during the forecast period. It is projected to advance at a CAGR of 4.3%, totaling USD 878.3 million by 2035.
Thermostatic mixing valves with DN 15 are widely used in the residential & commercial sectors. This is because these sectors often install 15 mm Pipe diameter owing to high pressure & less capacity of water requirements.
On the other hand, TMVs with DN 20 are expected to witness a higher demand, rising at 5.3% CAGR during the forecast period. Factors such as construction activities, safety regulations, and technological advancements within the industry are predicted to contribute to rising sales of DN 20 TMVs.
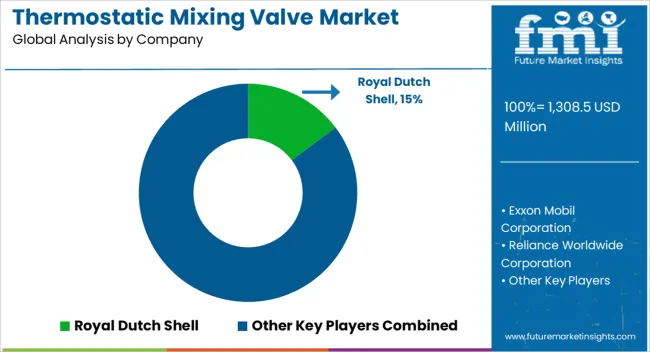
The global thermostatic mixing valve market is fragmented, with leading players accounting for about 60% to 70% share. Reliance Worldwide Corporation, Honeywell International Inc., Watts Water Technologies Company, Danfoss, Caleffi S.p.a., Hans Sasserath GmbH & Co. KG, Leonard Valve Company, MISUMI Group Inc., Bradley Corporation, Armstrong International Inc., Afriso-Euro-Index GmbH, Pegler Yorkshire, ESBE Group, Hans Sasserath GmbH & Co. KG, and Bianchi F.lli S.P.A are the leading manufacturers of thermostatic mixing valves listed in the report.
Prominent thermostatic mixing valve companies are investing huge capital in research & development activities to introduce innovative, cost-effective & lead-free products. For instance, they are launching new commercial mixing valves and residential thermostatic valves to have the upper hand over their peers.
Several participants are implementing strategies like acquisitions, mergers, and collaborations to expand their footprint. Further, they are striving to get TMV2 & TMV3 certification for their products.
Recent Developments in the Thermostatic Mixing Valve Market
| Attribute | Details |
|---|---|
| Current Market Value (2025) | USD 1308.5 million |
| Projected Market Size (2035) | USD 2091.2 million |
| Anticipated Growth Rate (2025 to 2035) | 4.8% |
| Historical Data | 2020 to 2025 |
| Forecast Period | 2025 to 2035 |
| Quantitative Units | Value (USD million) and Volume (Units) |
| Report Coverage | Revenue Forecast, Volume Forecast, Company Ranking, Competitive Landscape, Growth Factors, Trends, and Pricing Analysis |
| Market Segments Covered | By Nominal Diameter, By Capacity, By Valve Type, By Application, By Region |
| Regions Covered | North America; Latin America; Europe; East Asia; South Asia Pacific; Middle East & Africa |
| Key Countries Covered | Germany, France, United Kingdom, Italy, Spain, Russia, Rest of Europe, United States, Canada, Mexico, China, India, Japan, South Korea, Australia, Rest of Asia Pacific, Brazil, South Africa, GCC Countries, Kingdom of Saudi Arabia, Others |
| Key Companies Profiled | Royal Dutch Shell; Exxon Mobil Corporation; Reliance Worldwide Corporation; MISUMI Group Inc.; Honeywell International Inc.; Watts Water Technologies Company; Danfoss A/S; Bradley Corporation; Armstrong International Inc.; Caleffi S.p.A; Afriso-Euro-Index GmbH; Pegler Yorkshire; ESBE Group; Hans Sasserath GmbH & Co. KG; Bianchi F.lli S.P.A; Leonard Valve Company; Geann Industrial Co. Ltd; Others |
The global thermostatic mixing valve market is estimated to be valued at USD 1,308.5 million in 2025.
The market size for the thermostatic mixing valve market is projected to reach USD 2,091.2 million by 2035.
The thermostatic mixing valve market is expected to grow at a 4.8% CAGR between 2025 and 2035.
The key product types in thermostatic mixing valve market are dn 15, dn 20 and dn 25.
In terms of capacity, 5 to 10 gpm segment to command 39.4% share in the thermostatic mixing valve market in 2025.


Full Research Suite comprises of:
Market outlook & trends analysis
Interviews & case studies
Strategic recommendations
Vendor profiles & capabilities analysis
5-year forecasts
8 regions and 60+ country-level data splits
Market segment data splits
12 months of continuous data updates
DELIVERED AS:
PDF EXCEL ONLINE
Thermostatic Radiator Valves Market Size and Share Forecast Outlook 2025 to 2035
Mixing Console Market by Type, Sales Channel, Application & Region Forecast till 2025 to 2035
Foam Mixing Machine Market Size and Share Forecast Outlook 2025 to 2035
Paint Mixing Market Analysis - Size, Share, and Forecast Outlook for 2025-2035
Vacuum Mixing Devices Market Analysis - Size, Share & Forecast 2025 to 2035
Asphalt Mixing Plants Market Size and Share Forecast Outlook 2025 to 2035
Asphalt Mixing Plant Market Analysis and Opportunity Assessment in India Size and Share Forecast Outlook 2025 to 2035
Thermal Mixing Valves Market Size and Share Forecast Outlook 2025 to 2035
Food-Grade Mixing Tank Market Size and Share Forecast Outlook 2025 to 2035
Valve Grinder Market Size and Share Forecast Outlook 2025 to 2035
Valve Seat Inserts Market Size and Share Forecast Outlook 2025 to 2035
Valve Driver Market Size and Share Forecast Outlook 2025 to 2035
Valve Remote Control Systems Market Analysis by Type, Application and Region - Forecast for 2025 to 2035
Valve Positioner Market Growth – Trends & Forecast (2024-2034)
Valve Cover Gasket Market
Valve Sack Market
ESD Valve Market Forecast and Outlook 2025 to 2035
EGR Valve Market
HVAC Valve Market Size and Share Forecast Outlook 2025 to 2035
Flat Valve Caps And Closures Market Size and Share Forecast Outlook 2025 to 2035

Thank you!
You will receive an email from our Business Development Manager. Please be sure to check your SPAM/JUNK folder too.
Chat With
MaRIA