The global asphalt mixing plants market is valued at USD 563.3 million in 2025. It is slated to reach USD 786.9 million by 2035, recording an absolute increase of USD 226.9 million over the forecast period. This translates into a total growth of 40.3%, with the market forecast to expand at a compound annual growth rate (CAGR) of 3.4% between 2025 and 2035. The overall market size is expected to grow by nearly 1.4X during the same period, supported by increasing demand for road infrastructure development and rehabilitation projects, growing adoption of reclaimed asphalt pavement and warm mix asphalt technologies for sustainable construction, expanding highway modernization programs and urban road maintenance activities, and rising emphasis on low-emission mixing plant technologies complying with stringent environmental regulations across road construction, bridge development, parking facility construction, and infrastructure maintenance applications.
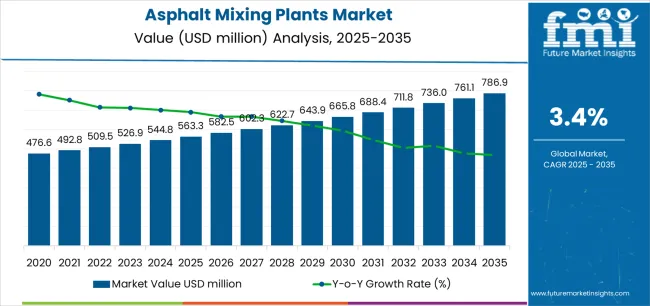
Between 2025 and 2030, the asphalt mixing plants market is projected to expand from USD 563.3 million to USD 676 million, resulting in a value increase of USD 112.7 million, which represents 49.7% of the total forecast growth for the decade. This phase of development will be shaped by increasing highway rehabilitation and bridge modernization programs, rising adoption of low-emission burner technologies and emission control systems, and growing demand for recycling-capable mixing plants incorporating high RAP percentage capabilities. Road construction contractors and infrastructure developers are expanding their asphalt production capabilities to address the growing demand for efficient and environmentally compliant mixing plant solutions that ensure construction quality and regulatory compliance.
| Metric | Value |
|---|---|
| Estimated Value in (2025E) | USD 563.3 million |
| Forecast Value in (2035F) | USD 786.9 million |
| Forecast CAGR (2025 to 2035) | 3.4% |
From 2030 to 2035, the market is forecast to grow from USD 676 million to USD 786.9 million, adding another USD 114.2 million, which constitutes 50.3% of the overall ten-year expansion. This period is expected to be characterized by the expansion of sustainable road construction practices emphasizing circular economy principles, the development of advanced automation and digital plant control systems for operational optimization, and the growth of specialized mixing plant configurations for airport runway construction and high-performance pavement applications. The growing adoption of intelligent production monitoring and real-time quality control technologies will drive demand for asphalt mixing plants with enhanced process automation and environmental performance features.
Between 2020 and 2025, the asphalt mixing plants market experienced steady growth, driven by increasing infrastructure investment programs following pandemic-related construction recovery and growing recognition of asphalt mixing plants as essential capital equipment for delivering consistent asphalt quality and production efficiency in diverse road construction, highway development, and infrastructure maintenance applications. The market developed as construction contractors and government agencies recognized the potential for modern mixing plant technology to improve material utilization efficiency, reduce emissions, and support sustainability objectives while meeting stringent quality specifications. Technological advancement in RAP recycling capabilities and low-NOx burner systems began emphasizing the critical importance of maintaining production consistency and environmental compliance in challenging regulatory environments.
Market expansion is being supported by the increasing global demand for road infrastructure development driven by urbanization trends and economic growth requirements, alongside the corresponding need for efficient asphalt production equipment that can enhance construction productivity, enable sustainable material recycling, and maintain consistent mix quality across road construction, highway rehabilitation, bridge deck surfacing, and urban infrastructure maintenance applications. Modern construction contractors and infrastructure agencies are increasingly focused on implementing asphalt mixing plant solutions that can incorporate reclaimed materials, minimize emissions, and provide reliable production capacity in demanding project schedules.
The growing emphasis on environmental sustainability and circular economy principles is driving demand for mixing plants that can support high RAP content utilization, enable warm mix asphalt production, and ensure comprehensive emission control through advanced burner technologies and filtration systems. Construction industry preference for equipment that combines production efficiency with environmental compliance and fuel economy is creating opportunities for innovative recycling-capable and low-emission mixing plant implementations. The rising influence of stringent air quality regulations and government infrastructure investment programs is also contributing to increased adoption of modern asphalt mixing plants that can provide superior environmental performance without compromising production capacity or mix quality capabilities.
The market is segmented by product type, plant type, application, and region. By product type, the market is divided into stationary and portable asphalt mixing plants. Based on plant type, the market is categorized into batch mixing and continuous mixing configurations. By application, the market is segmented into road construction, parking lots, bridges, pedestrian paths, and other infrastructure applications. Regionally, the market is divided into Asia Pacific, Europe, North America, Latin America, and Middle East & Africa.
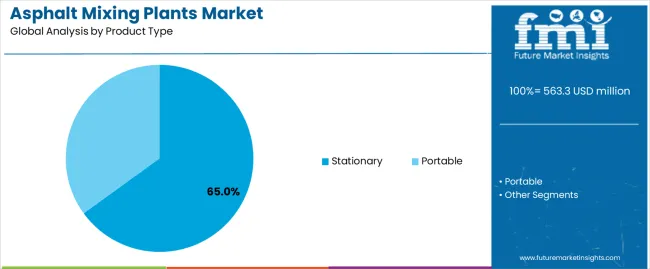
The stationary asphalt mixing plants segment is projected to maintain its leading position in the asphalt mixing plants market in 2025 with a 65% market share, reaffirming its role as the preferred product category for high-volume production operations and permanent installation applications. Road construction contractors and infrastructure developers increasingly utilize stationary mixing plants for their superior production capacity characteristics, comprehensive component configurations, and proven effectiveness in delivering consistent asphalt quality for large-scale highway projects and continuous production requirements. Stationary plant technology's proven effectiveness and production versatility directly address the industry requirements for high-output asphalt production and long-term project commitments across diverse construction environments and material specifications.
This product segment forms the foundation of major road construction operations, as it represents the configuration with the greatest contribution to production efficiency and established reliability record across multiple large-scale infrastructure projects and highway construction programs. Infrastructure investment trends in highway networks continue to strengthen adoption among major construction contractors and government road agencies. With infrastructure projects emphasizing production capacity and quality consistency, stationary asphalt mixing plants align with both operational requirements and economic objectives, making them the central component of comprehensive road construction strategies.
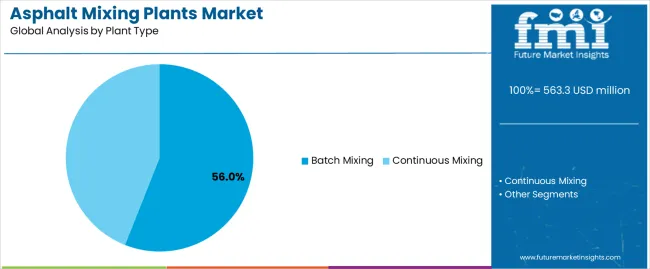
The batch mixing plant segment is projected to maintain its leading position in the asphalt mixing plants market in 2025 with a 56% market share, reflecting its critical role in delivering precise mix design control and quality consistency for diverse asphalt specifications. Construction contractors prefer batch mixing configurations for their exceptional recipe flexibility, accurate material proportioning capabilities, and ability to produce multiple mix designs within single production shifts while maintaining strict quality control standards. Batch mixing technology provides strategic advantages for projects requiring varied pavement specifications, tight quality tolerances, and frequent mix design changes throughout construction programs.
This plant type segment serves the foundation of quality-focused asphalt production where precise control over aggregate gradations, binder contents, and additive incorporation ensures compliance with demanding pavement specifications. Road construction projects requiring multiple surface course types, polymer-modified asphalts, and specialty mixes find batch configurations technically superior while ensuring mix design integrity. With infrastructure agencies emphasizing quality assurance and contractors managing diverse project specifications, batch mixing plants align with both quality objectives and operational flexibility requirements.
The road construction application segment is projected to represent the largest share of asphalt mixing plant demand in 2025 with a 58% market share, underscoring its critical role as the primary driver for mixing plant investments across highway construction, urban street development, and rural road improvement projects. Infrastructure agencies and construction contractors prefer asphalt mixing plants for road construction applications due to their essential role in producing hot mix asphalt for pavement layers, proven production capacity for large-scale linear projects, and ability to deliver consistent material quality supporting long-term pavement performance and durability objectives. Positioned as fundamental capital equipment for modern road construction operations, asphalt mixing plants offer both production efficiency advantages and quality assurance benefits.
The segment is supported by continuous government infrastructure investment programs and the growing scale of highway modernization and rehabilitation projects requiring substantial asphalt production volumes with consistent quality characteristics. Additionally, construction contractors are investing in comprehensive mixing plant capabilities to support increasingly ambitious road construction schedules and demanding pavement performance specifications. As highway networks expand and road maintenance intensifies, the road construction application will continue to dominate the market while supporting advanced mixing technologies and sustainable production practices.
The asphalt mixing plants market is advancing steadily due to increasing demand for road infrastructure development driven by economic growth and urbanization trends, and growing adoption of sustainable asphalt production technologies incorporating RAP recycling and warm mix asphalt capabilities providing enhanced environmental performance and resource conservation across road construction, highway rehabilitation, and infrastructure maintenance applications. However, the market faces challenges, including high capital investment requirements for modern mixing plant equipment and ancillary systems, stringent emission regulations requiring expensive pollution control technologies, and competition from mobile asphalt production units for smaller-scale regional projects. Innovation in digital automation systems and emission reduction technologies continues to influence product development and market expansion patterns.
The growing scale of highway rehabilitation projects and bridge infrastructure modernization is driving demand for asphalt mixing plant solutions that address pavement reconstruction requirements including large production volumes, diverse mix specifications for structural and surface layers, and quality consistency for long-lasting road surfaces. Major infrastructure projects require reliable mixing plant systems that deliver sustained production capacity across extended construction seasons while maintaining strict quality control and environmental compliance. Construction contractors are increasingly recognizing the competitive advantages of modern mixing plant investments for large project capture and operational efficiency, creating opportunities for high-capacity stationary plants specifically designed for major highway corridor reconstruction programs.
Modern asphalt mixing plant manufacturers are incorporating reclaimed asphalt pavement recycling capabilities and warm mix asphalt production systems to enhance sustainability performance, reduce virgin material consumption, and support comprehensive environmental objectives through optimized heating processes and material conservation strategies. Leading manufacturers are developing high-capacity RAP handling systems, implementing precise moisture control technologies for recycled materials, and advancing production processes that enable 30-50% RAP content without compromising mix quality. These technologies improve resource efficiency while enabling new value propositions, including reduced CO2 emissions, lower fuel consumption, and circular economy compliance. Advanced recycling integration also allows contractors to support comprehensive sustainability commitments and competitive differentiation beyond traditional production capabilities.
The implementation of stringent air quality regulations and emission standards is driving innovation in low-NOx burner technologies and advanced filtration systems with precisely controlled combustion processes and comprehensive particulate capture capabilities. These environmental compliance technologies require sophisticated burner designs with staged combustion, baghouse filtration systems, and continuous emission monitoring that exceed traditional mixing plant specifications, creating premium equipment segments with differentiated environmental value propositions. Manufacturers are investing in advanced combustion engineering and emission control capabilities to serve markets with strict environmental regulations while supporting contractor compliance with air quality permits and community emission standards.
| Country | CAGR (2025-2035) |
|---|---|
| India | 6% |
| United Kingdom | 3.6% |
| Brazil | 3.5% |
| Germany | 3% |
| United States | 2.7% |
| China | 2.4% |
| Japan | 2.1% |
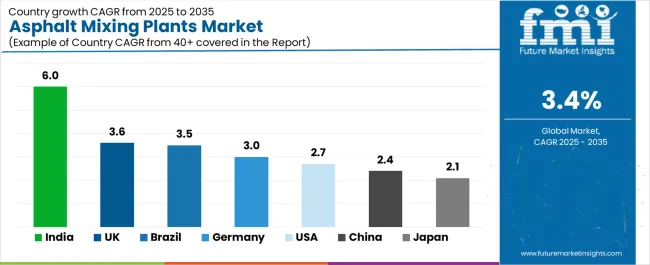
The asphalt mixing plants market is experiencing solid growth globally, with India leading at a 6% CAGR through 2035, driven by expanding PMGSY rural road connectivity programs and Bharatmala highway corridor development alongside greenfield logistics infrastructure projects. The United Kingdom follows at 3.6%, supported by local road maintenance investment surge and growing deployment of compact and portable mixing plant configurations for distributed construction projects. Brazil shows growth at 3.5%, emphasizing highway concession-led road twinning programs and regional airport access road construction. Germany demonstrates 3% growth, supported by strict emission regulations accelerating replacement of older mixing plants with modern low-emission equipment. The United States records 2.7%, focusing on highway and bridge rehabilitation programs and low-emission burner retrofit requirements. China exhibits 2.4% growth, emphasizing national expressway network upgrades and RAP-WMA technology adoption in provincial road construction programs. Japan shows 2.1% growth, supported by urban resurfacing maintenance cycles and precision batch mixing requirements for high-quality pavement specifications.
The report covers an in-depth analysis of 40+ countries; seven top-performing countries are highlighted below.
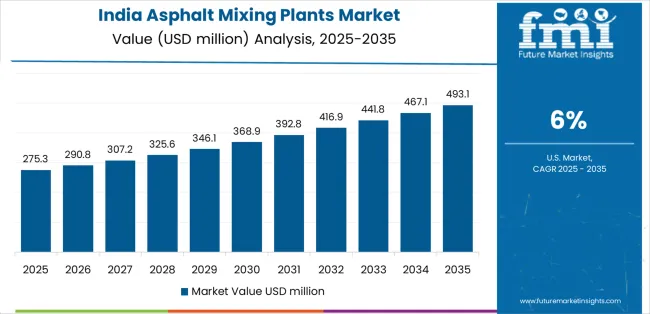
Revenue from asphalt mixing plants in India is projected to exhibit exceptional growth with a CAGR of 6% through 2035, driven by expanding Pradhan Mantri Gram Sadak Yojana rural connectivity programs and rapidly developing Bharatmala highway corridor construction supported by government infrastructure investment initiatives and logistics network modernization programs. The country's massive road construction scale and increasing investment in national highway capacity are creating substantial demand for asphalt mixing plant solutions. Major construction contractors and equipment suppliers are establishing comprehensive sales and service capabilities to serve both government infrastructure projects and private sector construction requirements.
Revenue from asphalt mixing plants in the United Kingdom is expanding at a CAGR of 3.6%, supported by significant local road maintenance investment increases addressing deferred maintenance backlogs and growing deployment of compact and portable mixing plant configurations enabling flexible multi-site construction operations. The nation's focus on distributed infrastructure maintenance and regulatory compliance is driving demand for versatile mixing plant solutions. Regional contractors and local authorities are investing in mobile production capabilities to serve geographically dispersed maintenance programs.
Revenue from asphalt mixing plants in Brazil is expanding at a CAGR of 3.5%, supported by highway concession-led road duplication and widening programs alongside regional airport access road construction addressing transportation infrastructure modernization requirements. The nation's infrastructure concession model and aviation sector expansion are driving demand for asphalt production equipment. Construction companies and concession operators are investing in mixing plant capabilities to support multi-year construction programs.
Revenue from asphalt mixing plants in Germany is expanding at a CAGR of 3%, driven by strict emission regulations accelerating replacement of aging mixing plants with modern low-emission equipment incorporating advanced burner technologies and comprehensive filtration systems. Germany's stringent environmental standards and technical excellence are driving sophisticated emission control capabilities throughout asphalt production operations. Construction contractors and material producers are establishing comprehensive equipment upgrade programs to meet evolving regulatory requirements.
Revenue from asphalt mixing plants in the United States is expanding at a CAGR of 2.7%, supported by comprehensive highway and bridge rehabilitation programs addressing aging infrastructure and increasing implementation of low-emission burner retrofit projects meeting state and federal air quality standards. The nation's extensive highway network and environmental regulatory framework are driving demand for both new mixing plants and technology upgrades. Construction contractors and material producers are investing in capacity modernization and emission control improvements.
Revenue from asphalt mixing plants in China is expanding at a CAGR of 2.4%, supported by ongoing national expressway network upgrades and provincial highway improvement programs alongside increasing adoption of RAP recycling and warm mix asphalt technologies in government-mandated sustainable construction initiatives. The nation's mature highway network and environmental policy evolution are driving demand for advanced mixing plant capabilities. State-owned construction enterprises and private contractors are investing in technology upgrades supporting green construction practices.
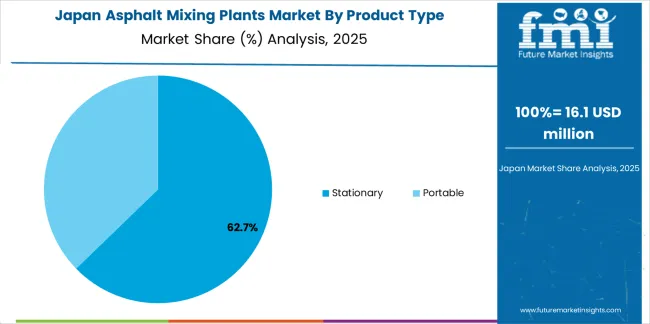
Revenue from asphalt mixing plants in Japan is expanding at a CAGR of 2.1%, supported by continuous urban road resurfacing maintenance cycles addressing high-traffic pavement deterioration and precision batch mixing requirements for demanding pavement quality specifications in dense urban environments. The nation's quality-focused construction practices and aging infrastructure maintenance needs are driving demand for precision mixing equipment. Established contractors and material suppliers are investing in equipment modernization supporting strict quality control standards.
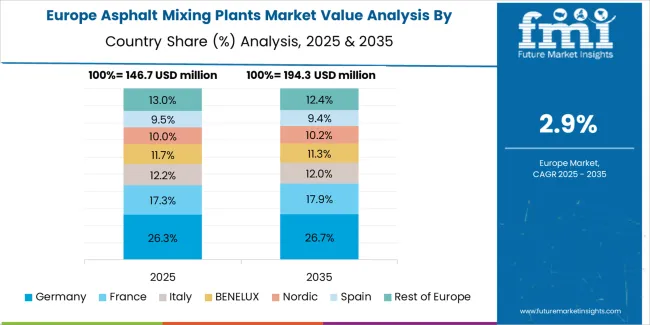
The asphalt mixing plants market in Europe is projected to grow from USD 157.7 million in 2025 to USD 223.5 million by 2035, registering a CAGR of approximately 3.6% over the forecast period. Germany is expected to maintain leadership with approximately 22% market share in 2025, supported by strict emission compliance requirements favoring low-NOx burners and RAP-WMA capable equipment, and steady infrastructure modernization programs.
The United Kingdom follows with approximately 18% market share in 2025, driven by local road maintenance investment increases and compact portable plant deployments for distributed construction operations. France holds approximately 16% market share in 2025, supported by trans-European corridor maintenance programs and airport runway resurfacing requirements. Italy commands approximately 14% in 2025, driven by highway concession maintenance obligations and urban infrastructure renewal. Spain accounts for approximately 10% in 2025, supported by regional road improvement programs and tourism infrastructure development. The Nordic region maintains approximately 8% in 2025, reflecting demanding emission standards and cold-climate mixing plant requirements. The Rest of Europe region holds approximately 12% in 2025, representing emerging demand in Central and Eastern European markets with expanding highway networks and EU infrastructure funding programs.
The asphalt mixing plants market is characterized by competition among established construction equipment manufacturers, specialized asphalt plant producers, and regional equipment suppliers. Companies are investing in emission control technology development, RAP recycling capability enhancement, digital automation integration, and service network expansion to deliver efficient, environmentally compliant, and reliable asphalt mixing plant solutions. Innovation in low-emission burner systems, advanced material handling technologies, and intelligent plant control systems is central to strengthening market position and competitive advantage.
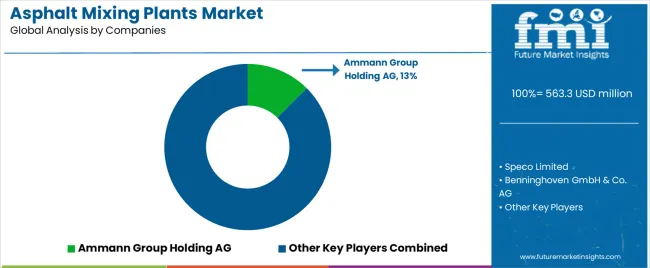
Ammann Group Holding AG leads the market with a 12.5% share, offering comprehensive asphalt mixing plant solutions with a focus on sustainable production technologies, diverse plant configurations, and advanced automation capabilities across stationary and portable applications. The company introduced its second-generation RAH 50 low-emission recycling dryer system in 2024, featuring improved thermal efficiency and enabling higher RAP utilization ratios, demonstrating continued commitment to sustainable asphalt production advancement and circular economy support. Speco Limited provides innovative asphalt plant products with emphasis on Indian market requirements and cost-effective production solutions.
Benninghoven GmbH & Co. AG delivers high-performance asphalt mixing plants with focus on premium quality and environmental technology leadership. Lintec & Linnhoff offers comprehensive mixing plant solutions with emphasis on mobility and rapid deployment capabilities, having deployed the CDP5001M continuous mixing plant in Australia in 2024, highlighting fast re-mobilization advantages through integrated chassis design for multi-site construction operations. Nikko Co. Ltd. specializes in Japanese market mixing plant technologies with precision production capabilities. Astec Industries Inc. provides diverse infrastructure equipment including comprehensive asphalt plant portfolios serving North American markets. Marini S.p.A offers Italian-engineered mixing plant solutions with advanced technology features. Parker Plant Ltd. focuses on compact and mobile asphalt plant configurations. Tietuo Machinery (TTM) emphasizes Chinese market production with competitive pricing strategies. SPEEDCRAFTS Ltd. provides emerging market mixing plant solutions with cost-effective designs.
Asphalt mixing plants represent essential capital equipment within road construction and infrastructure development sectors, projected to grow from USD 563.3 million in 2025 to USD 786.9 million by 2035 at a 3.4% CAGR. These critical production systems—primarily stationary and portable configurations with batch or continuous mixing capabilities—serve as fundamental equipment for producing hot mix asphalt in highway construction, urban road development, bridge deck surfacing, and infrastructure maintenance applications where production efficiency, mix quality consistency, and environmental compliance are essential. Market expansion is driven by increasing infrastructure investment programs, growing RAP recycling adoption, expanding emission control requirements, and rising demand for sustainable construction practices across government road agencies, construction contractors, and infrastructure development organizations.
How Infrastructure Regulators and Transportation Agencies Could Strengthen Equipment Standards and Environmental Performance?
How Industry Associations and Construction Organizations Could Advance Technology Standards and Market Development?
How Asphalt Mixing Plant Manufacturers Could Drive Innovation and Market Leadership?
How Construction Contractors and Infrastructure Developers Could Optimize Equipment Selection and Utilization?
How Research Institutions Could Enable Technology Advancement?
How Investors and Financial Enablers Could Support Market Growth and Innovation?
| Items | Values |
|---|---|
| Quantitative Units (2025) | USD 563.3 million |
| Product Type | Stationary, Portable |
| Plant Type | Batch Mixing, Continuous Mixing |
| Application | Road Construction, Parking Lots, Bridges, Pedestrian Paths, Other Infrastructure |
| Regions Covered | Asia Pacific, Europe, North America, Latin America, Middle East & Africa |
| Countries Covered | India, China, United States, Germany, United Kingdom, Japan, Brazil, and 40+ countries |
| Key Companies Profiled | Ammann Group Holding AG, Speco Limited, Benninghoven GmbH & Co. AG, Lintec & Linnhoff, Nikko Co. Ltd., Astec Industries Inc. |
| Additional Attributes | Dollar sales by product type, plant type, and application categories, regional demand trends, competitive landscape, technological advancements in emission control, RAP recycling integration, digital automation development, and sustainable production optimization |
The global asphalt mixing plants market is estimated to be valued at USD 563.3 million in 2025.
The market size for the asphalt mixing plants market is projected to reach USD 786.9 million by 2035.
The asphalt mixing plants market is expected to grow at a 3.4% CAGR between 2025 and 2035.
The key product types in asphalt mixing plants market are stationary and portable.
In terms of plant type, batch mixing segment to command 56.0% share in the asphalt mixing plants market in 2025.


Full Research Suite comprises of:
Market outlook & trends analysis
Interviews & case studies
Strategic recommendations
Vendor profiles & capabilities analysis
5-year forecasts
8 regions and 60+ country-level data splits
Market segment data splits
12 months of continuous data updates
DELIVERED AS:
PDF EXCEL ONLINE
Asphalt Testing Equipment Market Size and Share Forecast Outlook 2025 to 2035
Asphalt Pavers Market Growth - Trends & Forecast 2025 to 2035
Asphalt Shingle Market Forecast 2024-2034
Asphalt Mixing Plant Market Analysis and Opportunity Assessment in India Size and Share Forecast Outlook 2025 to 2035
Cold Mix Asphalt Market Size and Share Forecast Outlook 2025 to 2035
Recycled Asphalt Pavement Market Size and Share Forecast Outlook 2025 to 2035
Bitumen and Asphalt Testing Services Market
Mixing Console Market by Type, Sales Channel, Application & Region Forecast till 2025 to 2035
Foam Mixing Machine Market Size and Share Forecast Outlook 2025 to 2035
Paint Mixing Market Analysis - Size, Share, and Forecast Outlook for 2025-2035
Vacuum Mixing Devices Market Analysis - Size, Share & Forecast 2025 to 2035
Thermal Mixing Valves Market Size and Share Forecast Outlook 2025 to 2035
Food-Grade Mixing Tank Market Size and Share Forecast Outlook 2025 to 2035
Thermostatic Mixing Valve Market Size and Share Forecast Outlook 2025 to 2035
Power Plants Heavy Duty Gas Turbine Market Size and Share Forecast Outlook 2025 to 2035
Bio-Implants Market Analysis - Size, Share, and Forecast Outlook for 2025 to 2035
Gel Implants Market Analysis - Trends, Share & Forecast 2025 to 2035
Smart Implants Market Size and Share Forecast Outlook 2025 to 2035
Brain Implants Market Size and Share Forecast Outlook 2025 to 2035
Process Plants Gas Turbine Market Analysis - Size, Share, and Forecast Outlook 2025 to 2035

Thank you!
You will receive an email from our Business Development Manager. Please be sure to check your SPAM/JUNK folder too.
Chat With
MaRIA