
- Market Size (2026)
- USD 18.9 Bn
- Forecast (2036)
- USD 41.2 Bn
- CAGR (2026 to 2036)
- 8.1%
How big is HVAC Valve Market in 2026?
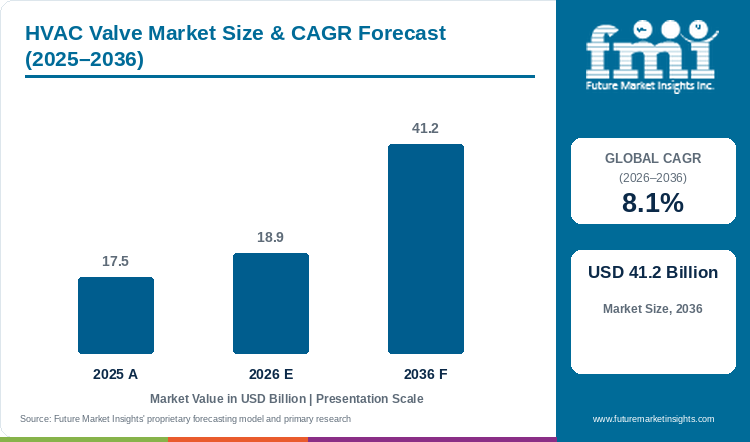
Assessed at USD 17.5 billion in 2025 and progressing to USD 18.9 billion in 2026, the HVAC valve market valuation is on course to reach USD 41.2 billion by 2036, supported by a forecast-period CAGR of 8.1%.
The global HVAC valve market recorded an industry valuation of USD 17.5 billion in 2025 and is estimated at USD 18.9 billion in 2026 on a path to USD 41.2 billion by 2036 at an 8.1% CAGR. Valve demand tracks slightly below the 10.2% CAGR forecast for commercial heat pump systems through 2036, as heat-pump skids carry higher unit prices while pulling multi-valve manifold retrofits across building. For instance, in September 2025 Johnson Controls launched data-center thermal management systems that cut cooling power use by 40%, accelerating adoption of pressure-independent control valves. Owing to bubble-tight isolation across chiller headers, ball and butterfly valves are projected to hold 38.4% of valve type share in 2026. However, brass alloy price swings and technician shortages restrain retrofits in older towers. Industry evaluation by FMI analysts suggests that suppliers embedding ultrasonic flow sensors into pre-calibrated actuators will capture top margin growth.
Key Market Trends & Insights
- By valve type: Ball and butterfly valves are projected to capture 38.4% in 2026, supported by compact quarter-turn shut-off across large chilled-water headers.
- By actuation: Electric actuated valves are estimated to command 44.8% in 2026 as facility managers link motorized actuators to BACnet building controllers.
- By body material: Brass and bronze bodies are expected to concentrate 46.2% in 2026, reflecting corrosion resistance in terminal fan-coil and radiator zones.
- By application: Hydronic chilled and hot water loops are forecast to generate 52.6% in 2026 owing to variable-flow heat pump and chiller piping retrofits.
- By digital and connectivity tier: IIoT-connected and edge-telemetry enabled valves are anticipated to account for 55.9% in 2026 through ultrasonic flow and power-monitoring diagnostics.
Regional Highlights
- Top national expansion: South Korea is projected to pace major national markets at an 8.6% CAGR through 2036 under semiconductor fab cleanroom and AI data-center buildouts.
- Broader country progression: The United Kingdom is expected to expand at 7.9% CAGR ahead of the United States at 7.8% and Germany at 7.5%, while Japan progresses at 7.1%.
Market Size & Forecast
Table 1: Market Size and Forecast for the HVAC Valve Market (USD billion and CAGR percentage), 2025 to 2036
| Metric | Value |
|---|---|
| 2025 Market Size | USD 17.5 billion |
| Estimated Market Size in 2026 | USD 18.9 billion |
| Projected Market Size by 2036 | USD 41.2 billion |
| CAGR, 2026 to 2036 | 8.1% |
| Added Value, 2026 to 2036 | USD 22.3 billion |
Rising need to eliminate low-delta-T chilled-water waste and cut central plant pumping electricity is driving building owners to replace manual circuit setters with automatic control valves. Manual balancing valves drift out of calibration when zone loads fluctuate across floors, causing chilled water to overflow coils. According to the U.S. Department of Energy hydronic decarbonization study running through December 2025, four-loop variable-flow heat-pump manifolds optimize building pumping energy. Analysts at Future Market Insights note that contractors retrofitting chiller headers with high-performance butterfly valves achieve rapid payback, though pneumatic wiring conversion adds upfront cost.
Installed-Loop and Valve-Density Sizing
Table 2: Installed-Loop and Valve-Density Sizing for the HVAC Valve Market (USD billion and operational ranges), 2025 to 2036
| Metric | 2025 | 2026 | 2036 |
|---|---|---|---|
| Market size (USD billion) | 17.5 | 18.9 | 41.2 |
| Annual commercial HVAC valve shipments (million units) | 142.0 to 158.0 | 152.0 to 168.0 | 285.0 to 320.0 |
| Valves per 100,000 sq ft commercial building (units) | 180 to 240 | 195 to 260 | 280 to 360 |
| Valves per MW of liquid-cooled data center (units) | 110 to 145 | 120 to 160 | 190 to 250 |
Operational note: Valve density ranges reflect ASHRAE 90.1 hydronic zoning baselines and direct-to-chip data-center coolant distribution manifold architectures.
Rapid deployment of artificial intelligence server clusters generating over 50 kilowatts of heat per rack has created a surge in valve density per megawatt of data-center capacity. Air-cooled computer room air handlers cannot dissipate extreme GPU thermal loads efficiently, forcing hyperscale operators to pipe inhibited propylene glycol directly to cold plates on server motherboards. As a result, coolant distribution units rely on stainless steel control valves and sanitary butterfly valves to modulate fluid flow without particulate shedding, although strict zero-leakage qualification testing lengthens supplier approval cycles.
Per Capita & Building Facility Sizing
Table 3: Per Capita and Facility Valve Indicators for the HVAC Valve Market (USD), 2025 to 2036
| Metric | 2025 | 2026 | 2036 |
|---|---|---|---|
| World population (billion) | 8.2 | 8.3 | 9.0 |
| Market value per capita (USD) | 2.1 | 2.3 | 4.6 |
| Valve spend per commercial chiller plant (USD) | 18,500 to 24,000 | 19,500 to 25,500 | 29,000 to 38,000 |
| IIoT-connected telemetry share (%) | 53.5% to 55.0% | 55.0% to 56.5% | 66.0% to 70.0% |
Table 4: Facility & Hydronic Loop Indicators for the HVAC Valve Market (USD and percentages), 2026
| Metric | Value | Institutional Reference Basis |
|---|---|---|
| Market size, 2026 | USD 18.9 billion | 2026 global valuation baseline |
| Commercial & industrial HVAC facilities | 4.8 million buildings | Global commercial chiller and heat-pump registry |
| Average annual valve allocation per facility | USD 3,938 | Annualized new-build and MRO valve allocation |
| Hydronic loop application allocation, 2026 | USD 9.9 billion | 52.6% application segment allocation |
Expanding adoption of air-to-water heat pumps and radiant floor heating in multi-family apartments is increasing unit sales of compact brass zone valves and manifold actuators. Each apartment unit requires independent room-by-room flow balancing so tenants can adjust heating setpoints without starving adjacent residential loops of hot water. To automate this zoning requirement, heating installers pair residential ball valves with programmable valve actuators on pre-assembled distribution manifolds, although tight ceiling cavity clearances and homeowner price sensitivity restrain premium smart-actuator upgrades in entry-level housing.
Analyst Perspective
"Direct-to-chip data-center liquid cooling and commercial heat-pump retrofits have turned HVAC valves from passive pipe fittings into intelligent thermal-control nodes. Manufacturers that embed ultrasonic flow sensors and BACnet telemetry directly into motorized PICVs capture the highest margin growth."
- Nikhil Kaitwade, Principal Consultant, Future Market Insights.
How is the HVAC valve market segmented?
The HVAC valve market is segmented by valve type, actuation, body material, application, and digital and connectivity tier. In 2026, ball and butterfly valves is projected at 38.4%, electric actuated valves at 44.8%, brass and bronze at 46.2%, hydronic chilled and hot water loops at 52.6%, and IIoT-connected and edge-telemetry enabled at 55.9%.
By valve type: Ball and butterfly valves and pressure independent control valves PICV as well as globe and balancing valves and zone and solenoid valves.
By actuation: Electric actuated valves and pneumatic actuated valves as well as manual balancing valves.
By body material: Brass and bronze and cast iron and ductile iron as well as stainless steel and engineered polymers.
By application: Hydronic chilled and hot water loops and district cooling and data center cooling as well as steam and refrigerant lines.
By digital and connectivity tier: IIoT-connected and edge-telemetry enabled and standalone conventional electromechanical.
Why do ball and butterfly valves lead the valve type category?
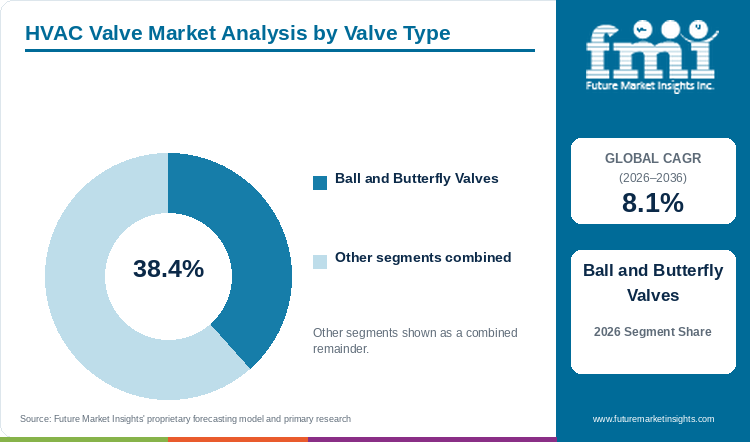
Ball and butterfly valves are projected to capture 38.4% of valve type demand in 2026 under tight shut-off requirements.
Table 5: Valve Type Share for the HVAC Valve Market (percentage share), 2026
| Valve Type | Share (2026) |
|---|---|
| Ball and Butterfly Valves | 38.4% |
| Other Segments Combined | 61.6%* |
| Total | 100.0% |
Operational note: Other valve type categories sum to 100.0% of 2026 HVAC valve demand.
Table 6: Valve Type Leadership and Market Growth for the HVAC Valve Market (segment and CAGR percentage), 2026 to 2036
| Metric | Value |
|---|---|
| Global CAGR (2026 to 2036) | 8.1% |
| Leading Segment | Ball and Butterfly Valves |
Mechanical contractors specify quarter-turn ball and butterfly valves for terminal air handlers and large chiller headers. Although uncharacterized ball trims can cause non-linear flow surges, fast-acting solenoid valves also gain adoption after a July 2026 study in Scientific Reports (PMC13424582) showed 9 Hz pulsated refrigerant flow improved evaporator heat transfer by 13.33%.
- Ball and butterfly valves are projected to secure 38.4% of valve type share in 2026 by combining bubble-tight isolation with lower weight and actuator torque than globe valves.
- In its 2025 Annual Report, Belimo Holding AG reported that control valve sales in the Americas rose 31.8% to USD 615.0 million equivalent, led by butterfly and characterized control valves in AI data centers.
Why do electric actuated valves define the largest actuation segment?
Electric actuated valves are estimated to secure 44.8% of the actuation category in 2026 through building management integration.
Brushless direct-current electric actuated valves consume up to 80% less standby power than pneumatic cylinders and eliminate compressed-air tubing maintenance across commercial ceilings. While electronic printed circuit boards are sensitive to plenum moisture, facility engineers connect motorized actuators to smart building thermostats and building automation controls for automated cooling.
- Electric actuated valves are estimated to command 44.8% of the actuation segment in 2026 as commercial energy codes mandate automated zone setback and fail-safe spring-return actuators.
- A 2026 fault-detection study in Buildings (PMC13259129) analyzing 525,600 one-minute hydronic fan-coil records demonstrated that automated virtual temperature sensing rapidly flags stuck cooling and heating valve actuators.
What keeps brass and bronze ahead by body material?
Brass and bronze valves are expected to command 46.2% of body material demand in 2026 across terminal hydronic zones.
Half-inch to two-inch terminal fan-coil units, chilled beams, and radiant manifolds require machinable forged brass and bronze bodies that resist closed-loop water corrosion. Where aggressive water chemistry risks dezincification, central plant headers and district cooling networks specify ductile iron butterfly bodies or stainless steel trims.
- Brass and bronze is expected to hold 46.2% of body material share in 2026, owing to high unit counts of terminal zone valves per commercial floor.
- In March 2026, Danfoss A/S published its 2025 Annual Report detailing expanded hydronic balancing and brass radiator valve deliveries across European and North American building retrofits.
Why do hydronic chilled and hot water loops lead the application category?
Hydronic chilled and hot water loops are forecast to generate 52.6% of application demand in 2026 across buildings.
Closed-loop hydronic chilled and hot water loops require isolation and modulating control valves across central chillers and terminal air handlers. Although hydronic piping installation requires certified welders, large campuses integrate chilled water storage systems to shift peak afternoon compressor loads to off-peak night hours.
- Hydronic chilled and hot water loops are forecast to account for 52.6% of application demand in 2026 as ASHRAE Standard 90.1-2025 sequencing rules require multi-equipment hydronic isolation.
- An August 2026 study in Applied Energy (PMC13503725) mapping water-cooled data-center rooms confirmed that hydronic chilled-water loops and district cooling interfaces govern rack-level thermal stability.
What gives IIoT-connected and edge-telemetry enabled the leading position in digital tier?
IIoT-connected and edge-telemetry enabled valves are anticipated to account for 55.9% of digital tier demand in 2026 globally.
Smart IIoT-connected and edge-telemetry enabled energy valves combine an ultrasonic flow meter, temperature sensors, and a motorized actuator that streams British thermal unit data over BACnet/IP. Even though cybersecurity qualification slows IT approval, automated coil delta-T control prevents chilled-water overflow and cuts central plant pumping electricity.
- IIoT-connected and edge-telemetry enabled valves are anticipated to capture 55.9% of digital tier share in 2026 as data centers and hospitals deploy predictive valve-health monitoring.
- A 2026 secondary cooling water control study (PMC13165837) demonstrated that deep reinforcement learning valve controllers execute online inference in 0.53 milliseconds within a 100-millisecond sampling cycle.
What are the drivers, restraints, and opportunities in the HVAC valve market?
In the HVAC valve market, the key driver is AI data-center liquid cooling expansion, the key restraint is brass alloy price volatility, and the key opportunity is ultrasonic energy valve retrofits.
- Driver: Direct-to-chip data-center liquid cooling buildouts and commercial heat-pump decarbonization laws multiply motorized control valve counts per building.
- Restraint: Copper and zinc raw material price swings and low-GWP A2L refrigerant pressure qualification hurdles increase valve manufacturing costs.
- Opportunity: Commercial building retrofits using IIoT ultrasonic energy valves generate utility efficiency rebates and recurring software diagnostics.
Growth Analysis and Future Potential: Qualitative Demand Catalysts
Market assessment by FMI shows that electrification of commercial heating and rapid growth in liquid-cooled artificial intelligence clusters are expanding global orders for precision hydronic valves. In November 2025, Fraunhofer ISE reported that heat pumps ranked first among heating systems sold in Germany during the first half of 2025 and accounted for nearly 70% of newly completed buildings. Each multi-stage air-to-water heat pump and thermal storage manifold requires motorized diverter and balancing valves to manage defrost and domestic hot-water priority cycles. Similarly, proposed Addendum o to ASHRAE Standard 90.1-2025 enforces strict heating equipment sequencing and minimum 90% thermal efficiency across commercial hydronic systems, rewarding suppliers of low-leakage isolation valves.
Risk Assessment of the HVAC Valve Market: Operational and Formulation Friction
Analysis by Future Market Insights highlights that raw metal price volatility for copper-zinc brass alloys and actuator semiconductor lead times represent the primary supply-chain pressures for valve manufacturers. Chiller conversions to mildly flammable low-GWP refrigerants such as R-454B and R-32 also require hermetic solenoid and expansion valve redesigns. According to Oak Ridge National Laboratory and U.S. Department of Energy testing on R-454B heat pumps with thermal energy storage, six-mode operation requires dedicated electronic expansion valve subcooling control algorithms to prevent charge migration. In older commercial building retrofits, incompatible legacy pneumatic control wiring slows conversion to digital BACnet actuators, favoring suppliers that offer drop-in retrofit actuator mounting linkages.
Commercial Opportunity Analysis: Formulation Differentiation and Value-Add Formats
Research by FMI analysts indicates that valve manufacturers capture higher gross margins by selling pre-assembled, factory-calibrated pressure-independent control valves that eliminate manual field balancing. Conventional manual circuit setters require two technicians using differential pressure gauges across multiple floors, adding commissioning delays and recurring seasonal flow drift. A 2026 chiller topology modeling study in Scientific Reports (PMC13194754) confirmed that coordinated expansion and chilled-water throttling valves directly govern parallel chiller plant energy efficiency. Although smart ultrasonic energy valves carry higher unit prices than manual globe valves, major manufacturers such as Belimo and Danfoss with Siemens and Johnson Controls scaling direct-to-chip data-center coolant valve assemblies cut contractor installation labor by 40%.
HVAC Valve Market by Country (2026 to 2036)
As noted by FMI, South Korea is projected to lead HVAC valve expansion across major national markets at an 8.6% CAGR through 2036, whereas Japan is forecast to progress at a 7.1% annual pace. Commercial performance across East Asian semiconductor and data-center hubs and European and North American heat-pump retrofit markets depends on building energy codes and liquid-cooling capex.
Table 7: Country CAGR and Primary Growth Levers for the HVAC Valve Market (CAGR percentage and operational drivers), 2026 to 2036
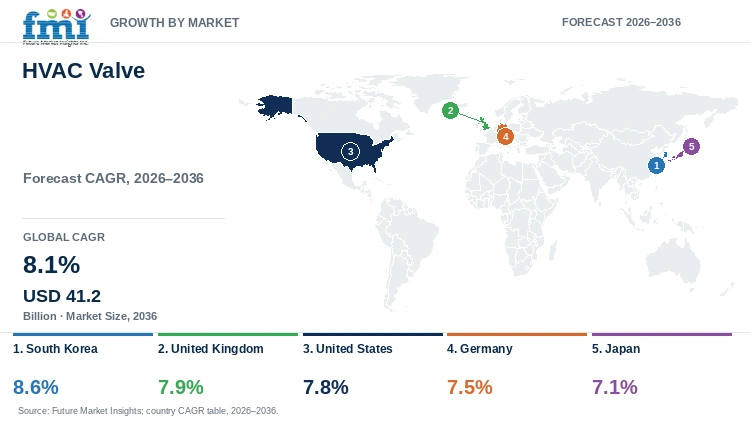
| Country | CAGR (2026 to 2036) | Primary Growth Lever |
|---|---|---|
| South Korea | 8.6% | Semiconductor mega-fab cleanroom chilled-water loops and AI data-center cooling |
| United Kingdom | 7.9% | Boiler Upgrade Scheme heat-pump grants and public building hydronic decarbonization |
| United States | 7.8% | Hyperscale data-center direct-to-chip liquid cooling and ASHRAE 90.1-2025 retrofits |
| Germany | 7.5% | Building Energy Act (GEG) heat-pump hydraulic balancing and district heating expansion |
| Japan | 7.1% | District heating and cooling plant modernization and ZEB commercial tower retrofits |
Source: Future Market Insights analysis
South Korea HVAC Valve Market Outlook (2026 to 2036)
South Korea HVAC valve market valuation is projected to expand at a leading 8.6% CAGR through 2036 across ultra-pure cleanroom make-up air units, district heating substations, and hyperscale cloud campuses. Capital expenditure on semiconductor wafer fabs in Gyeonggi Province and high-density urban district cooling networks makes South Korea the fastest-expanding national HVAC valve market in East Asia. According to the March 2026 ASHRAE Journal AHR Expo report, Korean and global HVAC OEMs are scaling AI-enabled heat recovery and variable-water-flow thermal platforms for commercial and industrial facilities. Because strict cleanroom vibration and outgassing tolerances disqualify standard cast-iron valves, suppliers offering stainless steel and fluoropolymer-lined control valves win Korean fab tenders.
Key takeaway: In South Korea, semiconductor cleanroom hydronic loops and district cooling expansion are projected to drive a leading 8.6% CAGR through 2036.
United Kingdom HVAC Valve Market Outlook (2026 to 2036)
Statutory heat decarbonization grants and commercial office Minimum Energy Efficiency Standards drive hydronic valve replacement across the United Kingdom. United Kingdom HVAC valve market size is estimated to rise at a 7.9% CAGR from 2026 to 2036 across residential heat-pump diverter valves, NHS hospital steam-to-low-temperature-hot-water conversions, and London data centers. The July 2026 Ofgem Boiler Upgrade Scheme Annual Report and DESNZ business case confirm UK government funding for 350,000 to 436,000 low-carbon heat pump installations through 2030. Because shortages of certified hydronic heating installers slow manual radiator balancing, hydronic valve manufacturers supplying pre-plumbed pressure-independent control valve manifold kits capture recurring British commercial heating contractor volume.
Key takeaway: In the United Kingdom, Boiler Upgrade Scheme heat-pump installations and hospital hydronic conversions are estimated to support a 7.9% CAGR.
United States HVAC Valve Market Outlook (2026 to 2036)
Hyperscale AI data-center construction across Virginia and Texas and commercial building performance standards anchor demand in the United States. United States HVAC valve industry valuation is anticipated to grow at a 7.8% CAGR through 2036 across chilled-water butterfly valves, pressure-independent control valves, and A2L refrigerant solenoids. According to Belimo's 2025 Annual Report, Americas sales climbed 31.8% to USD 615.0 million equivalent as data-center owners and chipmakers adopted direct-to-chip liquid cooling control valves. Although tariff surcharges on imported castings raise unit costs, Buy America domestic content rules on federally funded school and municipal building retrofits reward hydronic manufacturers operating certified United States valve assembly plants.
Key takeaway: In the United States, AI data-center liquid cooling manifolds and commercial RetroFIT+ upgrades are anticipated to drive a 7.8% CAGR through 2036.
Germany HVAC Valve Market Outlook (2026 to 2036)
Mandatory hydraulic balancing (Hydraulischer Abgleich) under Germany's Building Energy Act (Gebaeudeenergiegesetz) and municipal heat-network planning directly mandate automatic balancing valves across multi-family apartments. German demand for HVAC valves is forecast to advance at a 7.5% CAGR through 2036 as landlords and municipal utilities install thermostatic radiator valves, differential pressure regulators, and district-heating transfer stations. In November 2025, Fraunhofer ISE confirmed that heat pumps overtook gas boilers to become the top-selling heating technology in Germany during the first half of 2025. Because subdued new commercial office construction limits greenfield chiller orders, hydronic valve manufacturers focusing on quick-mount motorized retrofit actuators and automatic differential pressure regulators capture German building replacement demand.
Key takeaway: In Germany, statutory hydraulic balancing rules and municipal district heating transfer stations are forecast to sustain a 7.5% CAGR over the decade.
Japan HVAC Valve Market Outlook (2026 to 2036)
Net-Zero Energy Building (ZEB) redevelopment towers in Tokyo and Osaka and cloud data-center expansion in Chiba and Kansai govern demand across Japan. Japan HVAC valve market size is slated to expand at a 7.1% CAGR from 2026 to 2036 across seismic-rated butterfly valves, motorized two-way PICVs, and district cooling absorption chiller loops. A 2026 field assessment of economy fan-coil units in cooling mode (PMC12835230) demonstrated how precise chilled-water valve modulation prevents overcooling and condensation in humid Asian commercial buildings. Because aging facility maintenance workforces limit manual seasonal valve recalibration, Japanese mechanical engineering contractors specify self-calibrating BACnet electric valve actuators across metropolitan commercial tower retrofits.
Key takeaway: In Japan, Net-Zero Energy Building commercial redevelopments and hyperscale data-center cooling loops are slated to anchor a 7.1% CAGR through 2036.
Full report country CAGRs cover: North America; Latin America; Western Europe; Eastern Europe; East Asia; South Asia and Pacific; Middle East and Africa.
Who are the notable companies in the HVAC valve market?
Belimo Holding AG, Danfoss A/S, Johnson Controls International plc, Honeywell International Inc., Siemens AG, IMI plc, Bray International Inc., and Flowserve Corporation are the notable companies in the HVAC valve market.
An FMI analyst notes that commercial competition divides between specialized HVAC field-device innovators, integrated building-automation conglomerates, and heavy industrial flow-control manufacturers. Field-device specialists focus on motorized control valves and ultrasonic energy meters for commercial buildings and data centers. Integrated automation groups bundle valves with chillers and building management software, whereas industrial valve makers supply large-diameter district cooling headers.
- Hydronic Balancing & Smart Field-Device Leaders: Belimo Holding AG and Danfoss A/S as well as IMI plc lead in pressure-independent control valves, hydronic balancing, and ultrasonic energy valves.
- Integrated Building Automation & Chiller Platforms: Johnson Controls International plc and Honeywell International Inc. as well as Siemens AG integrate motorized HVAC valves with building management platforms.
- Large-Bore Industrial & District Cooling Specialists: Bray International Inc. and Flowserve Corporation supply large-bore butterfly and severe-service ball valves for central utility and district cooling plants.
Competitive Benchmarking: HVAC Valve Market
Table 8: Competitive Benchmarking for the HVAC Valve Market (qualitative capability ratings), 2026
| Company | PICV & Hydronic Breadth | Smart Actuator & IIoT Depth | Data Center / BMS Access | Geographic Reach |
|---|---|---|---|---|
| Belimo Holding AG | High | High | High | High |
| Danfoss A/S | High | High | High | High |
| Johnson Controls International plc | High | High | High | High |
| Honeywell International Inc. | High | High | High | High |
| Siemens AG | High | High | High | High |
| IMI plc | High | Medium | Medium | High |
| Bray International Inc. | Medium | Medium | Medium | High |
| Flowserve Corporation | Medium | Medium | Medium | High |
Scoring basis: Capability tiers evaluate documented pressure-independent and butterfly valve breadth and BACnet/IP telemetry integration. Ratings also reflect data-center contractor reach and global manufacturing footprints.
Key Developments in the HVAC Valve Market
- In July 2026, Belimo Holding AG reported first-half 2026 net sales of USD 765.0 million equivalent (up 29.6% in local currencies), with data-center cooling solutions generating over half of absolute sales growth.
- In April 2026, Honeywell International Inc. published its 2025 Annual Report and 2026 Proxy Statement detailing Building Automation commercial valve and controller expansion across data centers and healthcare facilities.
- In March 2026, Johnson Controls International plc filed its Fiscal 2025 Annual Report and received the 2026 IDEA Innovation Award for data-center liquid cooling and building automation valve integration.
- In December 2025, Siemens AG published its 2025 Annual Report detailing Smart Infrastructure building automation and intelligent hydronic field devices.
Key Players in the HVAC Valve Market
Hydronic Balancing & Smart Field-Device Leaders
- Belimo Holding AG
- Danfoss A/S
- IMI plc
Integrated Building Automation & Chiller Platforms
- Johnson Controls International plc
- Honeywell International Inc.
- Siemens AG
Large-Bore Industrial & District Cooling Specialists
- Bray International Inc.
- Flowserve Corporation
HVAC Valve Market - Report Scope
Table 9: Report Scope for the HVAC Valve Market (coverage fields and definitions), 2026 to 2036
| Coverage field | Report scope |
|---|---|
| Market breakdown | Valve Type; Actuation; Body Material; Application; Digital and Connectivity Tier |
| Quantitative Units | USD Billion |
| Market Definition | Includes commercial manufacturer valuation from ball, butterfly, pressure-independent control (PICV), globe, balancing, zone, and solenoid valves and integrated valve-actuator assemblies used in heating, ventilation, air-conditioning, district cooling, and data-center liquid cooling loops. Category Scope Note: Excludes upstream oil-and-gas wellhead valves, municipal potable water street gate valves, and air-duct sheet-metal dampers. |
| Regions Covered | North America; Latin America; Western Europe; Eastern Europe; East Asia; South Asia and Pacific; Middle East and Africa |
| Countries Covered | South Korea, United Kingdom, United States, Germany, Japan, and additional countries in the full report |
| Key Companies Covered | Belimo Holding AG, Danfoss A/S, Johnson Controls International plc, Honeywell International Inc., Siemens AG, IMI plc, Bray International Inc., Flowserve Corporation |
| Forecast Period | 2026 to 2036 |
| Approach | Primary and secondary research with top-down and bottom-up market triangulation. |
HVAC Valve Market - Research Methodology
Table 10: Research Methodology for the HVAC Valve Market (research methods and approach), 2026 edition
| Method | Approach |
|---|---|
| Primary Research | Structured interviews with MEP consulting engineers, hyperscale data-center thermal architects, hydronic balancing contractors, and valve OEM product directors. |
| Secondary Research | Analysis of corporate annual reports (Belimo, Danfoss, Johnson Controls, Honeywell, Siemens, IMI, Flowserve), ASHRAE 90.1 standards, U.S. DOE BTO hydronic studies, and peer-reviewed thermal engineering journals. |
| Market Sizing and Forecasting | Top-down HVAC field-device valuations reconciled against bottom-up valve counts per commercial building, heat pump, and megawatt of liquid-cooled data center capacity from 2026 to 2036. |
| Country Forecasting Model | Country projections weight semiconductor cleanroom and data-center capex, statutory heat-pump grant volumes, hydraulic balancing mandates, and district cooling buildouts. |
| Operational Benchmark Traceability | Loop and facility indicators in Tables 2, 3, and 4 trace to Belimo 2025 and HY26 disclosures, U.S. DOE hydronic decarbonization benchmarks, and ASHRAE 90.1-2025 addenda. |
| Data Triangulation and Validation | Segment shares and company revenues are cross-checked against reported HVAC field-device and commercial valve division sales without double counting standalone air-damper actuators. |
HVAC Valve Market by Segments
HVAC Valve Market segmented by Valve Type:
- Ball and Butterfly Valves
- Pressure Independent Control Valves PICV
- Globe and Balancing Valves
- Zone and Solenoid Valves
HVAC Valve Market segmented by Actuation:
- Electric Actuated Valves
- Pneumatic Actuated Valves
- Manual Balancing Valves
HVAC Valve Market segmented by Body Material:
- Brass and Bronze
- Cast Iron and Ductile Iron
- Stainless Steel and Engineered Polymers
HVAC Valve Market segmented by Application:
- Hydronic Chilled and Hot Water Loops
- District Cooling and Data Center Cooling
- Steam and Refrigerant Lines
HVAC Valve Market segmented by Digital and Connectivity Tier:
- IIoT-Connected and Edge-Telemetry Enabled
- Standalone Conventional Electromechanical
HVAC Valve Market by Region
- North America
- United States
- Canada
- Latin America
- Brazil
- Mexico
- Argentina
- Chile
- Western Europe
- Germany
- France
- United Kingdom
- Italy
- Spain
- Benelux
- Nordics
- Eastern Europe
- Poland
- Czech Republic
- Romania
- Hungary
- East Asia
- China
- Japan
- South Korea
- South Asia and Pacific
- India
- ASEAN
- Australia and New Zealand
- Middle East and Africa
- GCC Countries
- South Africa
- Türkiye
- Israel
Research Sources and Bibliography
- [1] Belimo Holding AG. (2026, July 20). Half-Year Report 2026: Management Report. Belimo Holding AG.
- [2] Johnson Controls International plc. (2025, September 24). Johnson Controls named to Fortune's 2025 Change the World List for data center thermal management innovation. Johnson Controls Media Center.
- [3] Woods, J., et al. (2024, November 15). Ice storage for efficient and flexible decarbonization of hydronic space heating (Project Term 2023 to December 31, 2025). U.S. Department of Energy Building Technologies Office.
- [4] Al-Zahrani, A., et al. (2026, July 30). Experimental enhancement of the evaporator performance using solenoid-controlled pulsating refrigerant flow. Scientific Reports (PMC13424582).
- [5] Belimo Holding AG. (2026, February 23). Annual Report 2025: Management Report. Belimo Holding AG.
- [6] Kim, H., et al. (2026, May 18). BRICK-Automated Virtual Temperature Sensors for Sensor Fault Detection in Hydronic Fan-Coil Systems. Buildings (PMC13259129).
- [7] Danfoss A/S. (2026, March 3). Danfoss Annual Report 2025: Strengthening customer partnerships, competitiveness, and resilience. Danfoss A/S.
- [8] American Society of Heating, Refrigerating and Air-Conditioning Engineers. (2025, April 1). Proposed Addendum o to Standard 90.1-2025, Energy Standard for Sites and Buildings Except Low-Rise Residential Buildings. ASHRAE.
- [9] Sunden, B., et al. (2026, August 24). Pursuing a hierarchical taxonomy in a water-cooled data center room. Applied Energy (PMC13503725).
- [10] Zhang, L., et al. (2026, April 10). Secondary Cooling Water System Control Method Based on Deep Reinforcement Learning. Sensors (PMC13165837).
- [11] Fraunhofer Institute for Solar Energy Systems ISE. (2025, November 3). Fraunhofer ISE Research Project Completed: Heat Pumps Provide Climate-Friendly Heating in Existing Buildings. Fraunhofer ISE.
- [12] Gluesenkamp, K., et al. (2024, November 18). Residential Heat Pump with Thermal Energy Storage to Enable Grid-Flexible Decarbonization. U.S. Department of Energy / Oak Ridge National Laboratory.
- [13] Wang, Y., et al. (2026, April 22). Topology modeling and energy efficiency prediction of parallel chiller systems. Scientific Reports (PMC13194754).
- [14] American Society of Heating, Refrigerating and Air-Conditioning Engineers. (2026, March 4). AHR Expo 2026 Recap - ASHRAE Journal. ASHRAE Journal.
- [15] Office of Gas and Electricity Markets (Ofgem). (2026, July 31). Boiler Upgrade Scheme Annual Report April 2025 to March 2026. Ofgem (GOV.UK).
- [16] Chen, W., et al. (2026, January 12). Field assessment of economy fan coil unit performance in cooling mode. Scientific Reports (PMC12835230).
- [17] Honeywell International Inc. (2026, February 13). Form 10-K Annual Report for the Fiscal Year Ended December 31, 2025: Building Automation Segment. U.S. Securities and Exchange Commission (SEC).
- [18] Johnson Controls International plc. (2026, March 4). 2026 Notice of Annual General Meeting, Proxy Statement and Fiscal 2025 Annual Report (Form 10-K). U.S. Securities and Exchange Commission (SEC).
- [19] Siemens AG. (2025, December 10). Siemens Annual Report 2024/2025. Siemens AG.
- [20] IMI plc. (2025, March 5). IMI plc Annual Report and Accounts: Fluid and Motion Control. IMI plc.
This bibliography is provided for reader reference and is not exhaustive. The full report contains the complete reference list and detailed citations.
This Report Answers
- How large is the HVAC valve market in 2026 and what is forecast for 2036?
- Which data-center liquid cooling and heat-pump drivers support demand for HVAC valves?
- Why do ball and butterfly valves lead the valve type category?
- Why does electric actuation lead the actuation category globally?
- How do growth rates differ across South Korea and the United Kingdom as well as the United States and Germany?
- Which leading companies manufacture smart hydronic and district cooling valves today?
- What alloy cost and commissioning barriers restrain adoption in the HVAC valve market?
- What should MEP contractors evaluate before specifying commercial HVAC valves?
Table of Content
- Key Takeaways
- Market Size and CAGR
- Top Growth Driver
- Fastest Growing Segment
- Leading Region
- Key Companies
- Emerging Opportunities
- Executive Summary
- Global Market Outlook
- Demand-side Trends
- Supply-side Trends
- Technology Roadmap Analysis
- Analysis and Recommendations
- Analyst Perspective (What is happening? Why now? What should investors know?)
- Key Questions Answered
- How large is the market?
- What is the CAGR?
- What are key trends?
- Which region dominates?
- Who are the leaders?
Read More...
- Market Overview
- Market Coverage / Taxonomy
- Market Definition / Scope / Limitations
- Research Methodology
- Chapter Orientation
- Analytical Lens and Working Hypotheses
- Market Structure, Signals, and Trend Drivers
- Benchmarking and Cross-market Comparability
- Market Sizing, Forecasting, and Opportunity Mapping
- Research Design and Evidence Framework
- Desk Research Programme (Secondary Evidence)
- Expert Input and Fieldwork (Primary Evidence)
- Tooling, Models, and Reference Databases
- Data Engineering and Model Build
- Quality Assurance and Audit Trail
- Market Background
- Market Dynamics (Drivers, Restraints, Opportunity, Trends)
- Scenario Forecast (Optimistic, Likely, Conservative)
- Impact Analysis
- AI Impact
- Sustainability Impact
- Regulatory Impact
- Technology Impact
- Consumer / Buyer Analysis
- Purchase Drivers
- Adoption Barriers
- Buyer Journey
- Opportunity Map Analysis
- Product Life Cycle Analysis
- Supply Chain Analysis
- Investment Feasibility Matrix
- Value Chain Analysis
- PESTLE and Porter's Analysis
- Regulatory Landscape
- Regional Parent Market Outlook
- Production and Consumption Statistics
- Import and Export Statistics
- Global Market Analysis and Forecast, 2021 to 2036
- Historical Market Size Value (USD Billion) Analysis, 2021 to 2025
- Current and Future Market Size Value (USD Billion) Projections, 2026 to 2036
- Y-o-Y Growth Trend Analysis
- Absolute $ Opportunity Analysis
- Global Market Pricing Analysis, 2021 to 2036
- Global Market Analysis and Forecast, By Valve Type, 2021 to 2036
- Introduction / Key Findings
- Historical Market Size Value (USD Billion) Analysis By Valve Type, 2021 to 2025
- Current and Future Market Size Value (USD Billion) Analysis and Forecast By Valve Type, 2026 to 2036
- Ball and Butterfly Valves
- Pressure Independent Control Valves PICV
- Globe and Balancing Valves
- Zone and Solenoid Valves
- Y-o-Y Growth Trend Analysis By Valve Type, 2021 to 2025
- Absolute $ Opportunity Analysis By Valve Type, 2026 to 2036
- Global Market Analysis and Forecast, By Actuation, 2021 to 2036
- Introduction / Key Findings
- Historical Market Size Value (USD Billion) Analysis By Actuation, 2021 to 2025
- Current and Future Market Size Value (USD Billion) Analysis and Forecast By Actuation, 2026 to 2036
- Electric Actuated Valves
- Pneumatic Actuated Valves
- Manual Balancing Valves
- Y-o-Y Growth Trend Analysis By Actuation, 2021 to 2025
- Absolute $ Opportunity Analysis By Actuation, 2026 to 2036
- Global Market Analysis and Forecast, By Body Material, 2021 to 2036
- Introduction / Key Findings
- Historical Market Size Value (USD Billion) Analysis By Body Material, 2021 to 2025
- Current and Future Market Size Value (USD Billion) Analysis and Forecast By Body Material, 2026 to 2036
- Brass and Bronze
- Cast Iron and Ductile Iron
- Stainless Steel and Engineered Polymers
- Y-o-Y Growth Trend Analysis By Body Material, 2021 to 2025
- Absolute $ Opportunity Analysis By Body Material, 2026 to 2036
- Global Market Analysis and Forecast, By Application, 2021 to 2036
- Introduction / Key Findings
- Historical Market Size Value (USD Billion) Analysis By Application, 2021 to 2025
- Current and Future Market Size Value (USD Billion) Analysis and Forecast By Application, 2026 to 2036
- Hydronic Chilled and Hot Water Loops
- District Cooling and Data Center Cooling
- Steam and Refrigerant Lines
- Y-o-Y Growth Trend Analysis By Application, 2021 to 2025
- Absolute $ Opportunity Analysis By Application, 2026 to 2036
- Global Market Analysis and Forecast, By Digital and Connectivity Tier, 2021 to 2036
- Introduction / Key Findings
- Historical Market Size Value (USD Billion) Analysis By Digital and Connectivity Tier, 2021 to 2025
- Current and Future Market Size Value (USD Billion) Analysis and Forecast By Digital and Connectivity Tier, 2026 to 2036
- IIoT-Connected and Edge-Telemetry Enabled
- Standalone Conventional Electromechanical
- Y-o-Y Growth Trend Analysis By Digital and Connectivity Tier, 2021 to 2025
- Absolute $ Opportunity Analysis By Digital and Connectivity Tier, 2026 to 2036
- Global Market Analysis and Forecast, By Region, 2021 to 2036
- Introduction
- Historical Market Size Value (USD Billion) Analysis By Region, 2021 to 2025
- Current Market Size Value (USD Billion) Analysis and Forecast By Region, 2026 to 2036
- North America
- Latin America
- Western Europe
- Eastern Europe
- East Asia
- South Asia and Pacific
- Middle East and Africa
- Market Attractiveness Analysis By Region
- North America Market Analysis and Forecast, By Country, 2021 to 2036
- Historical Market Size Value (USD Billion) Trend Analysis By Market Taxonomy, 2021 to 2025
- Market Size Value (USD Billion) Forecast By Market Taxonomy, 2026 to 2036
- By Country
- United States
- Canada
- By Valve Type
- By Actuation
- By Body Material
- By Application
- By Digital and Connectivity Tier
- By Country
- Market Attractiveness Analysis
- By Country
- By Valve Type
- By Actuation
- By Body Material
- By Application
- By Digital and Connectivity Tier
- Key Takeaways
- Latin America Market Analysis and Forecast, By Country
- Historical Market Size Value (USD Billion) Trend Analysis By Market Taxonomy, 2021 to 2025
- Market Size Value (USD Billion) Forecast By Market Taxonomy, 2026 to 2036
- By Country
- Brazil
- Mexico
- Argentina
- Chile
- By Valve Type
- By Actuation
- By Body Material
- By Application
- By Digital and Connectivity Tier
- By Country
- Market Attractiveness Analysis
- By Country
- By Valve Type
- By Actuation
- By Body Material
- By Application
- By Digital and Connectivity Tier
- Key Takeaways
- Western Europe Market Analysis and Forecast, By Country
- Historical Market Size Value (USD Billion) Trend Analysis By Market Taxonomy, 2021 to 2025
- Market Size Value (USD Billion) Forecast By Market Taxonomy, 2026 to 2036
- By Country
- Germany
- France
- United Kingdom
- Italy
- Spain
- Benelux
- Nordics
- By Valve Type
- By Actuation
- By Body Material
- By Application
- By Digital and Connectivity Tier
- By Country
- Market Attractiveness Analysis
- By Country
- By Valve Type
- By Actuation
- By Body Material
- By Application
- By Digital and Connectivity Tier
- Key Takeaways
- Eastern Europe Market Analysis and Forecast, By Country
- Historical Market Size Value (USD Billion) Trend Analysis By Market Taxonomy, 2021 to 2025
- Market Size Value (USD Billion) Forecast By Market Taxonomy, 2026 to 2036
- By Country
- Poland
- Czech Republic
- Romania
- Hungary
- By Valve Type
- By Actuation
- By Body Material
- By Application
- By Digital and Connectivity Tier
- By Country
- Market Attractiveness Analysis
- By Country
- By Valve Type
- By Actuation
- By Body Material
- By Application
- By Digital and Connectivity Tier
- Key Takeaways
- East Asia Market Analysis and Forecast, By Country
- Historical Market Size Value (USD Billion) Trend Analysis By Market Taxonomy, 2021 to 2025
- Market Size Value (USD Billion) Forecast By Market Taxonomy, 2026 to 2036
- By Country
- China
- Japan
- South Korea
- By Valve Type
- By Actuation
- By Body Material
- By Application
- By Digital and Connectivity Tier
- By Country
- Market Attractiveness Analysis
- By Country
- By Valve Type
- By Actuation
- By Body Material
- By Application
- By Digital and Connectivity Tier
- Key Takeaways
- South Asia and Pacific Market Analysis and Forecast, By Country
- Historical Market Size Value (USD Billion) Trend Analysis By Market Taxonomy, 2021 to 2025
- Market Size Value (USD Billion) Forecast By Market Taxonomy, 2026 to 2036
- By Country
- India
- ASEAN
- Australia and New Zealand
- By Valve Type
- By Actuation
- By Body Material
- By Application
- By Digital and Connectivity Tier
- By Country
- Market Attractiveness Analysis
- By Country
- By Valve Type
- By Actuation
- By Body Material
- By Application
- By Digital and Connectivity Tier
- Key Takeaways
- Middle East and Africa Market Analysis and Forecast, By Country
- Historical Market Size Value (USD Billion) Trend Analysis By Market Taxonomy, 2021 to 2025
- Market Size Value (USD Billion) Forecast By Market Taxonomy, 2026 to 2036
- By Country
- GCC Countries
- South Africa
- Türkiye
- Israel
- By Valve Type
- By Actuation
- By Body Material
- By Application
- By Digital and Connectivity Tier
- By Country
- Market Attractiveness Analysis
- By Country
- By Valve Type
- By Actuation
- By Body Material
- By Application
- By Digital and Connectivity Tier
- Key Takeaways
- Key Countries Market Analysis
- United States
- Pricing Analysis
- Market Share Analysis, 2025
- By Valve Type
- By Actuation
- By Body Material
- By Application
- By Digital and Connectivity Tier
- Canada
- Pricing Analysis
- Market Share Analysis, 2025
- By Valve Type
- By Actuation
- By Body Material
- By Application
- By Digital and Connectivity Tier
- Mexico
- Pricing Analysis
- Market Share Analysis, 2025
- By Valve Type
- By Actuation
- By Body Material
- By Application
- By Digital and Connectivity Tier
- Brazil
- Pricing Analysis
- Market Share Analysis, 2025
- By Valve Type
- By Actuation
- By Body Material
- By Application
- By Digital and Connectivity Tier
- Chile
- Pricing Analysis
- Market Share Analysis, 2025
- By Valve Type
- By Actuation
- By Body Material
- By Application
- By Digital and Connectivity Tier
- Germany
- Pricing Analysis
- Market Share Analysis, 2025
- By Valve Type
- By Actuation
- By Body Material
- By Application
- By Digital and Connectivity Tier
- United Kingdom
- Pricing Analysis
- Market Share Analysis, 2025
- By Valve Type
- By Actuation
- By Body Material
- By Application
- By Digital and Connectivity Tier
- Italy
- Pricing Analysis
- Market Share Analysis, 2025
- By Valve Type
- By Actuation
- By Body Material
- By Application
- By Digital and Connectivity Tier
- Spain
- Pricing Analysis
- Market Share Analysis, 2025
- By Valve Type
- By Actuation
- By Body Material
- By Application
- By Digital and Connectivity Tier
- France
- Pricing Analysis
- Market Share Analysis, 2025
- By Valve Type
- By Actuation
- By Body Material
- By Application
- By Digital and Connectivity Tier
- India
- Pricing Analysis
- Market Share Analysis, 2025
- By Valve Type
- By Actuation
- By Body Material
- By Application
- By Digital and Connectivity Tier
- ASEAN
- Pricing Analysis
- Market Share Analysis, 2025
- By Valve Type
- By Actuation
- By Body Material
- By Application
- By Digital and Connectivity Tier
- Australia and New Zealand
- Pricing Analysis
- Market Share Analysis, 2025
- By Valve Type
- By Actuation
- By Body Material
- By Application
- By Digital and Connectivity Tier
- China
- Pricing Analysis
- Market Share Analysis, 2025
- By Valve Type
- By Actuation
- By Body Material
- By Application
- By Digital and Connectivity Tier
- Japan
- Pricing Analysis
- Market Share Analysis, 2025
- By Valve Type
- By Actuation
- By Body Material
- By Application
- By Digital and Connectivity Tier
- South Korea
- Pricing Analysis
- Market Share Analysis, 2025
- By Valve Type
- By Actuation
- By Body Material
- By Application
- By Digital and Connectivity Tier
- Poland
- Pricing Analysis
- Market Share Analysis, 2025
- By Valve Type
- By Actuation
- By Body Material
- By Application
- By Digital and Connectivity Tier
- Hungary
- Pricing Analysis
- Market Share Analysis, 2025
- By Valve Type
- By Actuation
- By Body Material
- By Application
- By Digital and Connectivity Tier
- Türkiye
- Pricing Analysis
- Market Share Analysis, 2025
- By Valve Type
- By Actuation
- By Body Material
- By Application
- By Digital and Connectivity Tier
- South Africa
- Pricing Analysis
- Market Share Analysis, 2025
- By Valve Type
- By Actuation
- By Body Material
- By Application
- By Digital and Connectivity Tier
- United States
- Market Structure Analysis
- Competition Dashboard
- Competition Benchmarking
- Market Share Analysis of Top Players
- By Regional
- By Valve Type
- By Actuation
- By Body Material
- By Application
- By Digital and Connectivity Tier
- Emerging Startups
- Innovation Benchmarking
- Competition Analysis
- Competition Deep Dive
- Belimo Holding AG
- Overview
- Product Portfolio
- Profitability by Market Segments
- Sales Footprint
- Strategy Overview
- Marketing Strategy
- Product Strategy
- Channel Strategy
- Danfoss A/S
- Johnson Controls International plc
- Honeywell International Inc.
- Siemens AG
- IMI plc
- Bray International Inc.
- Flowserve Corporation
- Belimo Holding AG
- Case Studies
- Success Stories
- Recent Developments
- Competition Deep Dive
- Assumptions & Acronyms Used
List of Tables
- Table 1: Global Market Value (USD Billion) Forecast by Region, 2021 to 2036
- Table 2: Global Market Value (USD Billion) Forecast by Valve Type, 2021 to 2036
- Table 3: Global Market Value (USD Billion) Forecast by Actuation, 2021 to 2036
- Table 4: Global Market Value (USD Billion) Forecast by Body Material, 2021 to 2036
- Table 5: Global Market Value (USD Billion) Forecast by Application, 2021 to 2036
- Table 6: Global Market Value (USD Billion) Forecast by Digital and Connectivity Tier, 2021 to 2036
- Table 7: North America Market Value (USD Billion) Forecast by Country, 2021 to 2036
- Table 8: North America Market Value (USD Billion) Forecast by Valve Type, 2021 to 2036
- Table 9: North America Market Value (USD Billion) Forecast by Actuation, 2021 to 2036
- Table 10: North America Market Value (USD Billion) Forecast by Body Material, 2021 to 2036
- Table 11: North America Market Value (USD Billion) Forecast by Application, 2021 to 2036
- Table 12: North America Market Value (USD Billion) Forecast by Digital and Connectivity Tier, 2021 to 2036
- Table 13: Latin America Market Value (USD Billion) Forecast by Country, 2021 to 2036
- Table 14: Latin America Market Value (USD Billion) Forecast by Valve Type, 2021 to 2036
- Table 15: Latin America Market Value (USD Billion) Forecast by Actuation, 2021 to 2036
- Table 16: Latin America Market Value (USD Billion) Forecast by Body Material, 2021 to 2036
- Table 17: Latin America Market Value (USD Billion) Forecast by Application, 2021 to 2036
- Table 18: Latin America Market Value (USD Billion) Forecast by Digital and Connectivity Tier, 2021 to 2036
- Table 19: Western Europe Market Value (USD Billion) Forecast by Country, 2021 to 2036
- Table 20: Western Europe Market Value (USD Billion) Forecast by Valve Type, 2021 to 2036
- Table 21: Western Europe Market Value (USD Billion) Forecast by Actuation, 2021 to 2036
- Table 22: Western Europe Market Value (USD Billion) Forecast by Body Material, 2021 to 2036
- Table 23: Western Europe Market Value (USD Billion) Forecast by Application, 2021 to 2036
- Table 24: Western Europe Market Value (USD Billion) Forecast by Digital and Connectivity Tier, 2021 to 2036
- Table 25: Eastern Europe Market Value (USD Billion) Forecast by Country, 2021 to 2036
- Table 26: Eastern Europe Market Value (USD Billion) Forecast by Valve Type, 2021 to 2036
- Table 27: Eastern Europe Market Value (USD Billion) Forecast by Actuation, 2021 to 2036
- Table 28: Eastern Europe Market Value (USD Billion) Forecast by Body Material, 2021 to 2036
- Table 29: Eastern Europe Market Value (USD Billion) Forecast by Application, 2021 to 2036
- Table 30: Eastern Europe Market Value (USD Billion) Forecast by Digital and Connectivity Tier, 2021 to 2036
- Table 31: East Asia Market Value (USD Billion) Forecast by Country, 2021 to 2036
- Table 32: East Asia Market Value (USD Billion) Forecast by Valve Type, 2021 to 2036
- Table 33: East Asia Market Value (USD Billion) Forecast by Actuation, 2021 to 2036
- Table 34: East Asia Market Value (USD Billion) Forecast by Body Material, 2021 to 2036
- Table 35: East Asia Market Value (USD Billion) Forecast by Application, 2021 to 2036
- Table 36: East Asia Market Value (USD Billion) Forecast by Digital and Connectivity Tier, 2021 to 2036
- Table 37: South Asia and Pacific Market Value (USD Billion) Forecast by Country, 2021 to 2036
- Table 38: South Asia and Pacific Market Value (USD Billion) Forecast by Valve Type, 2021 to 2036
- Table 39: South Asia and Pacific Market Value (USD Billion) Forecast by Actuation, 2021 to 2036
- Table 40: South Asia and Pacific Market Value (USD Billion) Forecast by Body Material, 2021 to 2036
- Table 41: South Asia and Pacific Market Value (USD Billion) Forecast by Application, 2021 to 2036
- Table 42: South Asia and Pacific Market Value (USD Billion) Forecast by Digital and Connectivity Tier, 2021 to 2036
- Table 43: Middle East and Africa Market Value (USD Billion) Forecast by Country, 2021 to 2036
- Table 44: Middle East and Africa Market Value (USD Billion) Forecast by Valve Type, 2021 to 2036
- Table 45: Middle East and Africa Market Value (USD Billion) Forecast by Actuation, 2021 to 2036
- Table 46: Middle East and Africa Market Value (USD Billion) Forecast by Body Material, 2021 to 2036
- Table 47: Middle East and Africa Market Value (USD Billion) Forecast by Application, 2021 to 2036
- Table 48: Middle East and Africa Market Value (USD Billion) Forecast by Digital and Connectivity Tier, 2021 to 2036
List of Figures
- Figure 1: Global Market Pricing Analysis
- Figure 2: Global Market Value (USD Billion) Forecast 2021-2036
- Figure 3: Global Market Value Share and BPS Analysis by Valve Type, 2026 and 2036
- Figure 4: Global Market Y-o-Y Growth Comparison by Valve Type, 2026-2036
- Figure 5: Global Market Attractiveness Analysis by Valve Type
- Figure 6: Global Market Value Share and BPS Analysis by Actuation, 2026 and 2036
- Figure 7: Global Market Y-o-Y Growth Comparison by Actuation, 2026-2036
- Figure 8: Global Market Attractiveness Analysis by Actuation
- Figure 9: Global Market Value Share and BPS Analysis by Body Material, 2026 and 2036
- Figure 10: Global Market Y-o-Y Growth Comparison by Body Material, 2026-2036
- Figure 11: Global Market Attractiveness Analysis by Body Material
- Figure 12: Global Market Value Share and BPS Analysis by Application, 2026 and 2036
- Figure 13: Global Market Y-o-Y Growth Comparison by Application, 2026-2036
- Figure 14: Global Market Attractiveness Analysis by Application
- Figure 15: Global Market Value Share and BPS Analysis by Digital and Connectivity Tier, 2026 and 2036
- Figure 16: Global Market Y-o-Y Growth Comparison by Digital and Connectivity Tier, 2026-2036
- Figure 17: Global Market Attractiveness Analysis by Digital and Connectivity Tier
- Figure 18: Global Market Value (USD Billion) Share and BPS Analysis by Region, 2026 and 2036
- Figure 19: Global Market Y-o-Y Growth Comparison by Region, 2026-2036
- Figure 20: Global Market Attractiveness Analysis by Region
- Figure 21: North America Market Incremental Dollar Opportunity, 2026-2036
- Figure 22: Latin America Market Incremental Dollar Opportunity, 2026-2036
- Figure 23: Western Europe Market Incremental Dollar Opportunity, 2026-2036
- Figure 24: Eastern Europe Market Incremental Dollar Opportunity, 2026-2036
- Figure 25: East Asia Market Incremental Dollar Opportunity, 2026-2036
- Figure 26: South Asia and Pacific Market Incremental Dollar Opportunity, 2026-2036
- Figure 27: Middle East and Africa Market Incremental Dollar Opportunity, 2026-2036
- Figure 28: North America Market Value Share and BPS Analysis by Country, 2026 and 2036
- Figure 29: North America Market Value Share and BPS Analysis by Valve Type, 2026 and 2036
- Figure 30: North America Market Y-o-Y Growth Comparison by Valve Type, 2026-2036
- Figure 31: North America Market Attractiveness Analysis by Valve Type
- Figure 32: North America Market Value Share and BPS Analysis by Actuation, 2026 and 2036
- Figure 33: North America Market Y-o-Y Growth Comparison by Actuation, 2026-2036
- Figure 34: North America Market Attractiveness Analysis by Actuation
- Figure 35: North America Market Value Share and BPS Analysis by Body Material, 2026 and 2036
- Figure 36: North America Market Y-o-Y Growth Comparison by Body Material, 2026-2036
- Figure 37: North America Market Attractiveness Analysis by Body Material
- Figure 38: North America Market Value Share and BPS Analysis by Application, 2026 and 2036
- Figure 39: North America Market Y-o-Y Growth Comparison by Application, 2026-2036
- Figure 40: North America Market Attractiveness Analysis by Application
- Figure 41: North America Market Value Share and BPS Analysis by Digital and Connectivity Tier, 2026 and 2036
- Figure 42: North America Market Y-o-Y Growth Comparison by Digital and Connectivity Tier, 2026-2036
- Figure 43: North America Market Attractiveness Analysis by Digital and Connectivity Tier
- Figure 44: Latin America Market Value Share and BPS Analysis by Country, 2026 and 2036
- Figure 45: Latin America Market Value Share and BPS Analysis by Valve Type, 2026 and 2036
- Figure 46: Latin America Market Y-o-Y Growth Comparison by Valve Type, 2026-2036
- Figure 47: Latin America Market Attractiveness Analysis by Valve Type
- Figure 48: Latin America Market Value Share and BPS Analysis by Actuation, 2026 and 2036
- Figure 49: Latin America Market Y-o-Y Growth Comparison by Actuation, 2026-2036
- Figure 50: Latin America Market Attractiveness Analysis by Actuation
- Figure 51: Latin America Market Value Share and BPS Analysis by Body Material, 2026 and 2036
- Figure 52: Latin America Market Y-o-Y Growth Comparison by Body Material, 2026-2036
- Figure 53: Latin America Market Attractiveness Analysis by Body Material
- Figure 54: Latin America Market Value Share and BPS Analysis by Application, 2026 and 2036
- Figure 55: Latin America Market Y-o-Y Growth Comparison by Application, 2026-2036
- Figure 56: Latin America Market Attractiveness Analysis by Application
- Figure 57: Latin America Market Value Share and BPS Analysis by Digital and Connectivity Tier, 2026 and 2036
- Figure 58: Latin America Market Y-o-Y Growth Comparison by Digital and Connectivity Tier, 2026-2036
- Figure 59: Latin America Market Attractiveness Analysis by Digital and Connectivity Tier
- Figure 60: Western Europe Market Value Share and BPS Analysis by Country, 2026 and 2036
- Figure 61: Western Europe Market Value Share and BPS Analysis by Valve Type, 2026 and 2036
- Figure 62: Western Europe Market Y-o-Y Growth Comparison by Valve Type, 2026-2036
- Figure 63: Western Europe Market Attractiveness Analysis by Valve Type
- Figure 64: Western Europe Market Value Share and BPS Analysis by Actuation, 2026 and 2036
- Figure 65: Western Europe Market Y-o-Y Growth Comparison by Actuation, 2026-2036
- Figure 66: Western Europe Market Attractiveness Analysis by Actuation
- Figure 67: Western Europe Market Value Share and BPS Analysis by Body Material, 2026 and 2036
- Figure 68: Western Europe Market Y-o-Y Growth Comparison by Body Material, 2026-2036
- Figure 69: Western Europe Market Attractiveness Analysis by Body Material
- Figure 70: Western Europe Market Value Share and BPS Analysis by Application, 2026 and 2036
- Figure 71: Western Europe Market Y-o-Y Growth Comparison by Application, 2026-2036
- Figure 72: Western Europe Market Attractiveness Analysis by Application
- Figure 73: Western Europe Market Value Share and BPS Analysis by Digital and Connectivity Tier, 2026 and 2036
- Figure 74: Western Europe Market Y-o-Y Growth Comparison by Digital and Connectivity Tier, 2026-2036
- Figure 75: Western Europe Market Attractiveness Analysis by Digital and Connectivity Tier
- Figure 76: Eastern Europe Market Value Share and BPS Analysis by Country, 2026 and 2036
- Figure 77: Eastern Europe Market Value Share and BPS Analysis by Valve Type, 2026 and 2036
- Figure 78: Eastern Europe Market Y-o-Y Growth Comparison by Valve Type, 2026-2036
- Figure 79: Eastern Europe Market Attractiveness Analysis by Valve Type
- Figure 80: Eastern Europe Market Value Share and BPS Analysis by Actuation, 2026 and 2036
- Figure 81: Eastern Europe Market Y-o-Y Growth Comparison by Actuation, 2026-2036
- Figure 82: Eastern Europe Market Attractiveness Analysis by Actuation
- Figure 83: Eastern Europe Market Value Share and BPS Analysis by Body Material, 2026 and 2036
- Figure 84: Eastern Europe Market Y-o-Y Growth Comparison by Body Material, 2026-2036
- Figure 85: Eastern Europe Market Attractiveness Analysis by Body Material
- Figure 86: Eastern Europe Market Value Share and BPS Analysis by Application, 2026 and 2036
- Figure 87: Eastern Europe Market Y-o-Y Growth Comparison by Application, 2026-2036
- Figure 88: Eastern Europe Market Attractiveness Analysis by Application
- Figure 89: Eastern Europe Market Value Share and BPS Analysis by Digital and Connectivity Tier, 2026 and 2036
- Figure 90: Eastern Europe Market Y-o-Y Growth Comparison by Digital and Connectivity Tier, 2026-2036
- Figure 91: Eastern Europe Market Attractiveness Analysis by Digital and Connectivity Tier
- Figure 92: East Asia Market Value Share and BPS Analysis by Country, 2026 and 2036
- Figure 93: East Asia Market Value Share and BPS Analysis by Valve Type, 2026 and 2036
- Figure 94: East Asia Market Y-o-Y Growth Comparison by Valve Type, 2026-2036
- Figure 95: East Asia Market Attractiveness Analysis by Valve Type
- Figure 96: East Asia Market Value Share and BPS Analysis by Actuation, 2026 and 2036
- Figure 97: East Asia Market Y-o-Y Growth Comparison by Actuation, 2026-2036
- Figure 98: East Asia Market Attractiveness Analysis by Actuation
- Figure 99: East Asia Market Value Share and BPS Analysis by Body Material, 2026 and 2036
- Figure 100: East Asia Market Y-o-Y Growth Comparison by Body Material, 2026-2036
- Figure 101: East Asia Market Attractiveness Analysis by Body Material
- Figure 102: East Asia Market Value Share and BPS Analysis by Application, 2026 and 2036
- Figure 103: East Asia Market Y-o-Y Growth Comparison by Application, 2026-2036
- Figure 104: East Asia Market Attractiveness Analysis by Application
- Figure 105: East Asia Market Value Share and BPS Analysis by Digital and Connectivity Tier, 2026 and 2036
- Figure 106: East Asia Market Y-o-Y Growth Comparison by Digital and Connectivity Tier, 2026-2036
- Figure 107: East Asia Market Attractiveness Analysis by Digital and Connectivity Tier
- Figure 108: South Asia and Pacific Market Value Share and BPS Analysis by Country, 2026 and 2036
- Figure 109: South Asia and Pacific Market Value Share and BPS Analysis by Valve Type, 2026 and 2036
- Figure 110: South Asia and Pacific Market Y-o-Y Growth Comparison by Valve Type, 2026-2036
- Figure 111: South Asia and Pacific Market Attractiveness Analysis by Valve Type
- Figure 112: South Asia and Pacific Market Value Share and BPS Analysis by Actuation, 2026 and 2036
- Figure 113: South Asia and Pacific Market Y-o-Y Growth Comparison by Actuation, 2026-2036
- Figure 114: South Asia and Pacific Market Attractiveness Analysis by Actuation
- Figure 115: South Asia and Pacific Market Value Share and BPS Analysis by Body Material, 2026 and 2036
- Figure 116: South Asia and Pacific Market Y-o-Y Growth Comparison by Body Material, 2026-2036
- Figure 117: South Asia and Pacific Market Attractiveness Analysis by Body Material
- Figure 118: South Asia and Pacific Market Value Share and BPS Analysis by Application, 2026 and 2036
- Figure 119: South Asia and Pacific Market Y-o-Y Growth Comparison by Application, 2026-2036
- Figure 120: South Asia and Pacific Market Attractiveness Analysis by Application
- Figure 121: South Asia and Pacific Market Value Share and BPS Analysis by Digital and Connectivity Tier, 2026 and 2036
- Figure 122: South Asia and Pacific Market Y-o-Y Growth Comparison by Digital and Connectivity Tier, 2026-2036
- Figure 123: South Asia and Pacific Market Attractiveness Analysis by Digital and Connectivity Tier
- Figure 124: Middle East and Africa Market Value Share and BPS Analysis by Country, 2026 and 2036
- Figure 125: Middle East and Africa Market Value Share and BPS Analysis by Valve Type, 2026 and 2036
- Figure 126: Middle East and Africa Market Y-o-Y Growth Comparison by Valve Type, 2026-2036
- Figure 127: Middle East and Africa Market Attractiveness Analysis by Valve Type
- Figure 128: Middle East and Africa Market Value Share and BPS Analysis by Actuation, 2026 and 2036
- Figure 129: Middle East and Africa Market Y-o-Y Growth Comparison by Actuation, 2026-2036
- Figure 130: Middle East and Africa Market Attractiveness Analysis by Actuation
- Figure 131: Middle East and Africa Market Value Share and BPS Analysis by Body Material, 2026 and 2036
- Figure 132: Middle East and Africa Market Y-o-Y Growth Comparison by Body Material, 2026-2036
- Figure 133: Middle East and Africa Market Attractiveness Analysis by Body Material
- Figure 134: Middle East and Africa Market Value Share and BPS Analysis by Application, 2026 and 2036
- Figure 135: Middle East and Africa Market Y-o-Y Growth Comparison by Application, 2026-2036
- Figure 136: Middle East and Africa Market Attractiveness Analysis by Application
- Figure 137: Middle East and Africa Market Value Share and BPS Analysis by Digital and Connectivity Tier, 2026 and 2036
- Figure 138: Middle East and Africa Market Y-o-Y Growth Comparison by Digital and Connectivity Tier, 2026-2036
- Figure 139: Middle East and Africa Market Attractiveness Analysis by Digital and Connectivity Tier
- Figure 140: Global Market - Tier Structure Analysis
- Figure 141: Global Market - Company Share Analysis
Frequently Asked Questions
How big is the HVAC valve market in 2026, and what is forecast for 2036?
According to FMI, global HVAC valve market valuation is estimated to reach USD 18.9 billion in 2026 from USD 17.5 billion in 2025. The market size is projected to hit USD 41.2 billion by 2036 as buildings and data centers upgrade hydronic loops.
What is the CAGR for the HVAC valve market from 2026 to 2036?
Future Market Insights projects an 8.1% compound annual growth rate between 2026 and 2036, generating USD 22.3 billion in added industry valuation across commercial and industrial cooling networks.
Which valve type segment leads the HVAC valve market?
Ball and butterfly valves are projected to capture 38.4% of valve type demand in 2026, driven by zero-leakage shut-off and compact quarter-turn actuation across chiller headers and air handlers.
Which actuation segment leads the HVAC valve market?
Electric actuated valves are estimated to secure 44.8% of actuation demand in 2026 as facility managers link brushless DC actuators directly to BACnet building management controllers.
Which country has the highest growth outlook during the assessment period?
South Korea is projected to lead major national markets at an 8.6% CAGR through 2036, supported by semiconductor cleanroom chilled-water loops and AI data-center construction.
Who are the key players in the market?
Major suppliers include Belimo Holding AG and Danfoss A/S as well as Johnson Controls International plc and Honeywell International Inc. Siemens AG and IMI plc as well as Bray International Inc. and Flowserve Corporation also lead global supply.
Preview the report firsthand - request a free sample
Get SampleGet the brochure for pricing and purchase details.
Get PDF
