
- Market Size (2026)
- USD 347.7 Bn
- Forecast (2036)
- USD 611.0 Bn
- CAGR (2026 to 2036)
- 5.8%
How big is the HVAC Market in 2026?
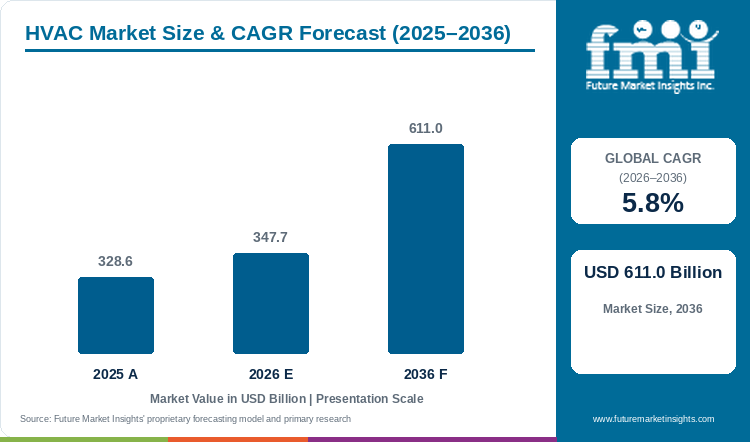
The global heating, ventilation and air-conditioning market is estimated at USD 347.66 billion in 2026, compared with USD 328.6 billion in 2025, and is forecast to reach USD 611.00 billion by 2036, expanding at a CAGR of 5.8% from 2026 to 2036.
Demand for heating and cooling equipment is supported by replacement activity in existing buildings and growing interest in systems that provide both functions. Heating equipment accounts for 36.2% of the market by equipment type in 2026, while replacement and retrofit contribute 54.9% by installation and residential users hold 41.7% by end use. The replacement of ageing air-conditioning equipment also creates opportunities for heat pump manufacturers. ENERGY STAR identifies central air-conditioner replacement as an opportunity to install a heat pump at a modest additional cost, depending on the building's suitability. Growth in heating equipment demand is reflected in European industry sales figures. According to the European Heat Pump Association, approximately 2.9 million heat pumps were sold across 21 European countries in 2025, representing an increase of 13.0% over the previous year. Germany recorded sales growth of 50.0% during the same period. Manufacturers are also investing in regional production capabilities to strengthen equipment availability. For instance, Daikin inaugurated a EUR 300 million residential heat pump manufacturing facility in Poland on May 21, 2026. The facility serves European markets and supports the company's regional supply network. Equipment selection and installation expertise remain important as contractors assess existing ductwork and heating requirements before recommending replacement systems.
Key Market Trends & Insights
- The IEA finds that more than 70% of building heat-pump sales in each major market were supplied domestically in 2024. Local specifications and climate requirements therefore give regional production a commercial purpose beyond freight savings. [3]
- The IEA reports that heat-pump equipment can cost two to three times, or more, than alternatives, before installation. Financing the complete job can therefore matter more to conversion than a small reduction in the equipment price. [3]
- The US Census Bureau found that 13.2 million households experienced at least 24 hours of uncomfortable heat in 2023. Cooling suppliers have a service and reliability argument alongside their efficiency offer; this is a US household finding, rather than a global demand measure. [4]
Regional Highlights
- In Europe, heat-pump sales recovered by 11% in 2025, according to the IEA's Global Energy Review 2026. The recovery strengthens the case for restocking, while the different national results argue against treating Europe as one uniform replacement cycle. [5]
- Across North America, heat-pump installation guidance makes building fit central to the sale. Canada's government asks owners to account for planned insulation and window work when sizing a system; US Department of Energy guidance also links installation quality to realised efficiency. Suppliers need local contractor capacity as well as available units. [6][7]
Table 1: HVAC Market Size and Forecast (USD billion and CAGR percentage), 2025 to 2036
| Market size and forecast | Value |
|---|---|
| Market size in 2025 | USD 328.6 billion |
| Estimated market size in 2026 | USD 347.66 billion |
| Market size forecast for 2035 | USD 577.5 billion |
| Projected market size by 2036 | USD 611.00 billion |
| CAGR from 2026 to 2036 | 5.8% |
| Added revenue from 2026 to 2036 | USD 263.34 billion |
Source: Future Market Insights, HVAC Market Report, 2026 to 2036.
Analyst Perspective
“An HVAC replacement order is shaped by the building's climate, its service contractor and the equipment's refrigerant. A lower equipment price can lose its appeal if the unit cannot be installed under the applicable rule or maintained locally.”
- Nikhil Kaitwade, Principal Consultant, FMI
How is the HVAC Market segmented?
The report separates the equipment bought, the installation that creates the order and the building user paying for it. A residential replacement heat pump belongs to all three classifications, but the classifications answer different market questions.
- By Equipment Type: Heating equipment, Ventilation equipment, Air conditioning and cooling equipment.
- By Installation: New construction, Replacement and retrofit.
- By End User: Residential, Commercial, Industrial.
- By Region: North America, Latin America, Western Europe, Eastern Europe, East Asia, South Asia and Pacific, Middle East and Africa.
Why does heating equipment lead by equipment type?
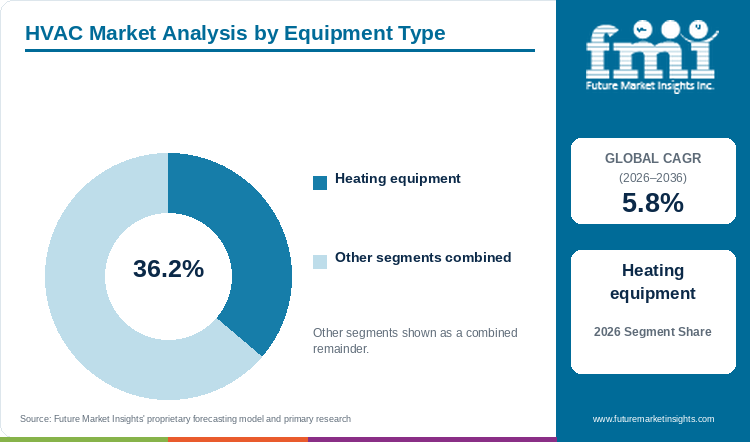
Heating equipment accounts for 36.2% of the HVAC Market by equipment type in 2026.
FMI finds that heating replacement can be funded by both an immediate equipment need and a longer decision to change fuel. The European Heat Pump Association reports that heat pumps reached half of Germany's space-heating equipment sales in 2025. [8] This supports a stronger heating offer, but the share refers to that country's heating sales; it does not make heat pumps alone 36.2% of worldwide HVAC revenue.
The heating category includes several technologies, while cooling and ventilation retain their own orders. A supplier selling into an existing home must fit the output temperature, available space and distribution system. A product that requires extensive changes can lose to an alternative that the installer can commission sooner. FMI therefore expects heating suppliers with a suitable replacement range and technical support to defend the category's lead more effectively than those competing only on rated output.
Table 2: HVAC Market Leading Equipment Type Share, 2026
| Leading Share | 2026 market share |
|---|---|
| Heating equipment | 36.2% |
| All Other Segments Combined Share | 63.8% |
Source: Future Market Insights, HVAC Market Report, 2026 to 2036.
Why does Replacement and retrofit lead by installation?
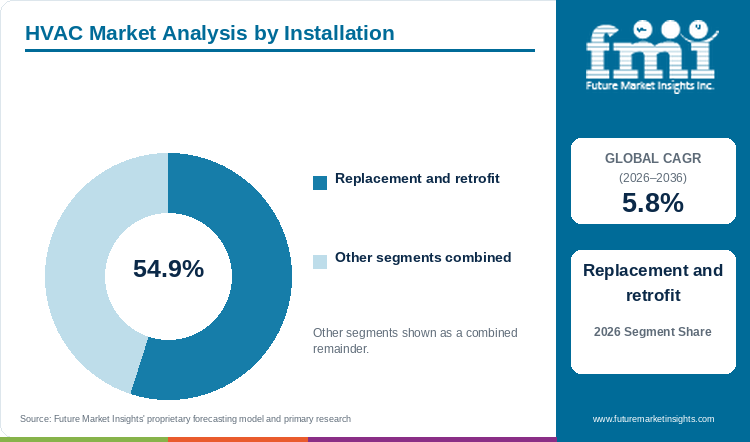
Replacement and retrofit account for 54.9% of the HVAC Market by installation in FMI's 2026 assessment.
An equipment failure creates an order even when construction slows. The commercial issue is whether the replacement fits the building quickly enough. The US Department of Energy's heat-pump replacement checklist calls for room-by-room load calculations and inspection of exposed ducts. [9] FMI finds that the contractor who already knows the building can make those checks before proposing a replacement, giving established service channels access to repeat sales.
Replacement is also broader than changing one unit for an identical model. Insulation work or a change from combustion heating can alter the required capacity. Suppliers need a range of sizes and compatible controls so that the installer can match the new unit to the actual load. New construction remains important because systems can be designed together, but its timing depends on building completions. The replacement market turns on the condition of equipment already in use.
Table 3: HVAC Market Leading Installation Share, 2026
| Leading Share | 2026 market share |
|---|---|
| Replacement and retrofit | 54.9% |
| All Other Segments Combined Share | 45.1% |
Source: Future Market Insights, HVAC Market Report, 2026 to 2036.
What supports residential users as the leading end user?
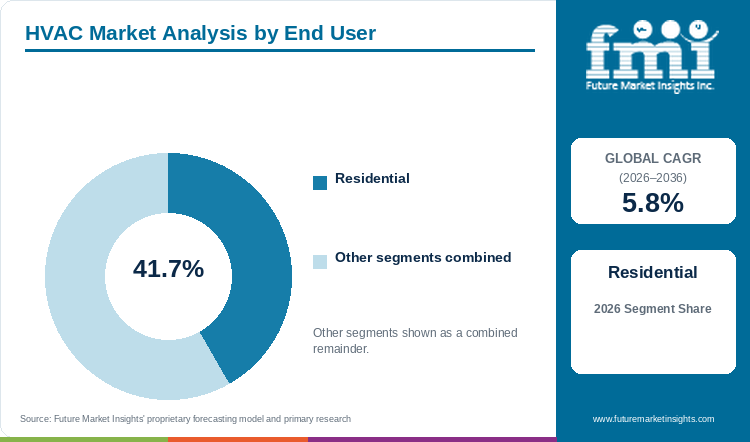
Residential users account for 41.7% of the HVAC Market by end user in FMI's 2026 assessment.
Households buy many smaller systems through local installers and retailers, which creates repeat business across a large installed base. ENERGY STAR describes ducted and ductless heat pumps as options for different home configurations. [1] FMI's view is that a supplier reaches more of this demand by making selection and installation manageable for the contractor, rather than by offering the largest unit in a catalogue.
Residential leadership does not imply that commercial systems have less value per order. A chiller or an air-handling package can serve a large building and require a longer design process. Residential revenue instead benefits from the number of individual decisions and the recurrence of replacement. A manufacturer needs spare parts, clear commissioning instructions and support for the installer after the sale. Those capabilities help retain a household through its service contractor when the next replacement is due.
Table 4: HVAC Market Leading End User Share, 2026
| Leading Share | 2026 market share |
|---|---|
| Residential | 41.7% |
| All Other Segments Combined Share | 58.3% |
Source: Future Market Insights, HVAC Market Report, 2026 to 2036.
What are the key drivers restraints and opportunities?
The forecast adds USD 263.34 billion between 2026 and 2036. Replacement supports equipment orders, installation costs can delay them, and the rising cost of cooling gives efficient systems a separate opening.
Driver
Cooling growth brings first installations as well as replacement. The IEA projects that India's cooling demand will more than double by 2035 under current policy settings. [10] FMI finds that this creates demand for equipment and for installers able to connect, commission and service it. The sale is realised when a functioning system reaches the building, rather than when a hot season alone raises interest.
Restraint
Changing the equipment can require work elsewhere in the building. US Department of Energy guidance identifies oversizing, incorrect refrigerant charge and leaking ducts as causes of efficiency loss. [7] An owner facing these additional costs may postpone a planned change or choose a smaller project. Suppliers that leave such work outside the initial quote risk losing the order when the final installed price becomes clear.
Opportunity
Suppliers can win additional business by showing how controls and efficient equipment reduce the cost of meeting a building's cooling load. In the IEA's Stated Policies Scenario, income-driven air-conditioning use adds around 330 GW to global peak demand by 2035, with higher temperatures adding another 170 GW. [11] FMI sees an opening for offers that combine appropriate capacity with controllable operation, especially where the owner pays for peak electricity use.
How do refrigerant and quality rules affect purchasing?
The US EPA's Technology Transitions restrictions vary by product and subsector, and the agency completed a reconsideration rule in May 2026 covering several applications, including residential and light-commercial air-conditioning and heat-pump systems. [12] A distributor therefore needs the applicable product classification and manufacture or import record before committing older stock to a project. A general claim that all existing units are banned, or all can be installed indefinitely, would misstate the rule.
Quality checks address a different risk. Department of Energy purchasing guidance refers federal buyers to installation specifications as well as equipment efficiency. [7] FMI finds that a compliant refrigerant does not by itself guarantee a good installation. Suppliers gain from providing both the model's compliance information and practical commissioning support; the two answer different questions in a buyer's decision.
What limits reliable HVAC commissioning and operation?
The unit's rated capacity has to match the building and its distribution system. The US government-hosted cold-climate sizing guide advises using manufacturer performance at design conditions and checking whether existing ducts are suitable. [13] FMI finds that simply copying the capacity of the removed unit can preserve an earlier sizing mistake.
For a manufacturer, this makes product information part of supply. Installers need performance tables, compatible indoor and outdoor combinations and guidance on controls. For an owner, the consequence is a possible delay between ordering equipment and receiving dependable heating or cooling. The supplier able to resolve a sizing or commissioning question promptly helps the contractor complete more installations with the same workforce.
Where can HVAC suppliers win additional business?
Commercial buildings create an opening for equipment, controls and continuing service to be sold together. Carrier lists chillers, airside systems, building controls and packaged equipment in its commercial portfolio. [14] FMI's view is that a coordinated offer can reduce the number of interfaces an owner must manage when replacing a central plant.
The opportunity depends on the building. An existing hospital, factory or office may need cooling throughout the work, so equipment delivery and changeover have to fit an operating schedule. A supplier that can plan the transition and service the installed system can compete on continuity of operation. This is a different offer from an equipment-only quotation and can support repeat work on the rest of the site.
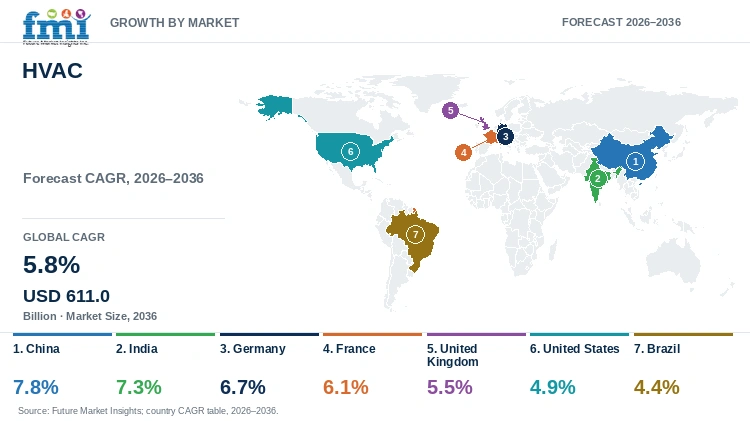
HVAC Market by Country (2026 to 2036)
Table 5: HVAC Market Country Growth (CAGR percentage), 2026 to 2036
| Country | CAGR |
|---|---|
| China | 7.8% |
| India | 7.3% |
| Germany | 6.7% |
| France | 6.1% |
| United Kingdom | 5.5% |
| United States | 4.9% |
| Brazil | 4.4% |
Source: Future Market Insights, HVAC Market Report, 2026 to 2036.
What supports HVAC demand in China?
A replacement incentive is useful to an HVAC supplier only when an eligible model and an installer are available together. China's national consumer-goods trade-in programme generated CNY 1.1 trillion in sales in the first half of 2026, according to the State Council Information Office's August report. That total covers the programme's goods, rather than air conditioners alone. [15] It nevertheless gives suppliers a reason to prepare their replacement range for households deciding to use the support. A producer that waits for the order before arranging local installation can miss the buying window even when equipment is in stock.
The 7.8% CAGR forecast for China from 2026 to 2036 combines that replacement opportunity with new installations and sales into different building uses. Manufacturing also gives Chinese suppliers access to orders outside the domestic market. The IEA describes an integrated heat-pump supply chain and a manufacturing cost advantage, while noting weak building heat-pump sales in 2025 and early 2026. [3] The decade's outlook therefore does not assume that every HVAC product grows in every quarter.
Purchases brought forward can leave a quieter period behind them. Before expanding stocks, a manufacturer needs to separate distributor shipments from completed household installations; the two do not describe the same stage of demand. A broad efficiency range and established local installation channels make it easier to serve the programme without depending on one heavily promoted model. They also leave the supplier less exposed to one short selling season when the timing of incentives changes the replacement cycle.
What is driving HVAC demand in India?
Only around one in five Indian households has an air conditioner, yet cooling already accounts for slightly more than a tenth of annual electricity use, according to the IEA. [10] This leaves manufacturers serving first-time buyers as well as households replacing old units. India cannot be approached as a mature replacement market in which most customers already have a system. The commercial task begins with an affordable equipment offer and continues through the customer's first dependable installation, because the need for cooling alone does not complete a sale.
Running cost can be as decisive as the purchase price. Air conditioners can account for as much as a third of electricity consumption on hot summer nights, the IEA finds. [10] That observation concerns those hours, rather than the whole year's electricity mix. Seasonal ratings and actual operating cost will matter increasingly as cooling reaches more homes: a household able to buy a unit still has to pay to run it during the hottest part of the year.
Efficient models at several price points, supported by technicians near the customer, offer a practical route through both constraints. Wider access and rising use underpin India's 7.3% forecast CAGR from 2026 to 2036, while household budgets, available power and the local service network determine how quickly purchases become completed installations. Poor sizing or commissioning can undo the benefit that justified a better unit. Manufacturers that make the first job reliable have a stronger basis for a lasting service relationship and a later replacement order.
What sustains HVAC demand in Germany?
Germany's heating contractor can no longer leave heat pumps outside a normal replacement discussion. EHPA reports that German heat-pump sales rose by 50% in 2025 and reached half of national space-heating equipment sales. [8] The change gives manufacturers a larger place in the contractor's heating offer, but each sale still has to work in the customer's building. A suitable model must meet the heat requirement and connect to the distribution system without turning a necessary replacement into an open-ended building project.
Half of annual heating sales does not mean half of the systems already installed in buildings. That distinction leaves room for further replacement orders rather than setting a ceiling at the reported sales share. It also changes how a supplier should pursue the business. The relevant question is whether a particular building can receive a suitable heating product with predictable work, not whether the national sales mix has reached a headline percentage. Output, hydraulic integration and commissioning support all affect the contractor's willingness to propose the change.
In July 2026, Germany's environment ministry said heat pumps were increasingly sought in existing buildings and linked their economics to energy costs and continued support. [16] Converting that interest into completed projects supports the 6.7% CAGR forecast for 2026 to 2036. Manufacturers need to make sizing and integration predictable and provide a dependable response after the first winter. Annual sales can still move with financing and policy conditions. A supplier whose support continues after equipment leaves the warehouse is better placed to secure the replacement work through those changes.
What shapes HVAC demand in France?
A French heating quotation can depend on the renovation route before the owner chooses a model. Service Public states that, from 1 September 2026, the major-renovation route of MaPrimeRénov' cannot support an individual house retaining gas heating after the work. A heat pump with fossil-fuel backup also cannot be financed under the stated provision. [17] A contractor therefore needs to establish the applicable route and eligible heating arrangement before the customer commits. Help with that choice can save a supplier from revising the offer after an application has begun.
There is a large replacement market behind these decisions. France remained Europe's largest heat-pump market by units in 2025, with 528,000 sales, despite a decline that year, according to EHPA. [8] Replacement and renovation in that heating market support the 6.1% CAGR forecast from 2026 to 2036. The weaker annual result does not remove the installed base, but it warns against assuming an even order pattern. Changes in support can alter both the timing of work and the types of system bought.
The house still sets the practical limits. Space, heat distribution and the extent of renovation determine which eligible system can be installed and how much work accompanies it. Suppliers that help contractors identify suitable configurations can make the process more predictable without treating every home as the same project. Spare parts and service across existing models matter as well. When an owner postpones full replacement and keeps the current system for another season, dependable support preserves the customer relationship until a larger project can proceed.
What supports HVAC demand in the United Kingdom?
An application for heating support is not yet an installed heat pump. The United Kingdom's Boiler Upgrade Scheme statistics separately track applications and voucher redemptions for eligible low-carbon heating in domestic and small non-domestic buildings. Those figures are provisional and may be revised. [18] For a manufacturer monitoring replacement demand, the distinction separates interest in the scheme from a later stage in converting it into equipment in a building. Existing homes create an identifiable route to purchase, but the supplier still needs to understand how the project moves through it.
Installer requirements make that conversion a commercial issue. The scheme's April 2026 guidance sets conditions for applications from its stated commencement date and for the heat pump's ability to provide the property's space heating. [19] Supporting a compliant system offer, with a building assessment rather than nominal capacity alone, is part of the 5.5% CAGR outlook for UK HVAC from 2026 to 2036. The contractor's explanation of the work and completion of the records can determine whether a household proceeds. The forecast concerns a decade of replacement decisions; it does not predict the same annual growth in applications or redemptions.
Work on existing emitters, controls and outdoor-unit location also has to appear in the quotation. A customer may accept the technology but delay installation when the programme or total cost remains unclear. An appropriate model range, trained installers and dependable after-sales support help a supplier carry the project through those decisions. The opportunity consequently extends beyond supplying the unit to making the complete installation understandable and manageable for its owner.
What is leading HVAC demand in the United States?
Available HVAC stock only helps a US contractor if the unit can be used on the proposed job. The EPA's May 2026 reconsideration covers specific subsectors rather than removing every Technology Transitions restriction. [12] A distributor needs to identify the model, its manufacture or import timing and the applicable installation provision before committing it. Accurate records protect the value of stock by connecting an available unit to a permissible project; a general assurance about refrigerants cannot do that work.
Replacement of systems already serving homes and commercial buildings provides a separate basis for the United States' 4.9% CAGR forecast from 2026 to 2036. Heat pumps continued to outsell gas boilers in 2025 despite lower annual sales, according to the IEA. [5] When cooling equipment needs replacement, the owner can consider a reversible system at the same decision point. The installer still has to establish whether it can meet the building's heating needs as well. A weaker year for heat-pump sales is therefore compatible with a longer outlook that covers several HVAC equipment types and buying cycles.
The final test is the system's performance after installation. The Department of Energy identifies correct sizing, refrigerant charge and duct condition as relevant factors. [7] Suppliers that combine compliant equipment with practical contractor support and service coverage can use the replacement channel to reach the same building stock repeatedly. New construction adds another source of orders, with its own timing. Neither channel removes the need to commission the system correctly: the owner buys dependable heating and cooling, rather than the rated performance of an isolated unit.
What shapes HVAC demand in Brazil?
A retailer in Brazil can use an air conditioner's energy label to explain a higher equipment price with a model-specific comparison. Inmetro's Brazilian labelling programme lets buyers compare registered units by model, capacity, power and efficiency classification. Its revised label uses annual energy consumption and a method intended to distinguish inverter performance more clearly. [20] This gives cooling purchases and replacement decisions a practical operating-cost argument, rather than a broad promise that any efficient model will suit any household.
That distinction matters to Brazil's 4.4% CAGR forecast from 2026 to 2036. Although this is the lowest rate among the profiled countries, it does not mean every cooling category grows slowly. First installation, replacement and maintenance serve different needs. A price-sensitive first buyer may compare a different offer from an owner replacing equipment for better operation. Changing the selected capacity also changes the purchase and likely energy use, so the label comparison still has to fit the installation.
Clear model information and access to a competent installer help turn the running-cost argument into a completed sale. A manufacturer that advertises efficiency but leaves sizing or service uncertain can lose to a familiar alternative available through a local contractor. A useful range of capacities, understandable comparisons and parts support after installation give suppliers a stronger position across these decisions. Keeping the equipment maintainable in the customer's locality matters to repeat business as much as the initial explanation of a lower electricity bill. The offer has to remain workable after it leaves the retail display.
Who are the notable companies in the HVAC Market?
Carrier, Daikin, Bosch and Johnson Controls illustrate different positions in HVAC supply. Their portfolios overlap in some buildings, but the business sold and the service responsibility matter more than a single broad label.
Carrier's commercial range includes chillers, airside systems, controls and packaged equipment. [14] That gives a building owner a route to compare equipment and control functions within one supplier's offer. Daikin's May 2026 Polish factory adds residential heat-pump production in Europe. [2] FMI finds that this position supports the installer channel serving heating replacement, where local product availability and technical support affect the completion of each job.
Bosch completed the acquisition of the residential and light-commercial HVAC businesses from Johnson Controls and the Johnson Controls-Hitachi venture in 2025. [21] Johnson Controls' subsequent filing treats substantially all of its former residential and light-commercial HVAC businesses as discontinued operations. [22] Buyers should therefore identify the present business and brand support behind an offer. FMI's view is that competition separates household and light-commercial channels from larger building systems and continuing services. Comparing a residential heat pump with a central chiller package without those roles would obscure the capabilities the customer actually needs.
Key Developments in the HVAC Market
- On 21 May 2026, Daikin Europe inaugurated its approximately EUR 300 million heat-pump production facility in Poland's Łódź region. The plant primarily produces residential heating systems for the European market. [2]
Key Players in the HVAC Market
- Carrier
- Daikin
- Bosch
- Johnson Controls
HVAC Market Report Scope
Table 6: Report Scope for the HVAC Market, 2026 to 2036
| Coverage field | Report scope |
|---|---|
| Market definition | Revenue associated with heating, ventilation and air-conditioning equipment serving buildings and industrial users. |
| Product boundaries | Heating equipment, ventilation equipment, and air conditioning and cooling equipment; fuels and electricity consumed during operation are excluded. |
| Quantitative units | USD billion for market value; percentages for segment shares and forecast CAGR. |
| Forecast period | 2026 to 2036, with 2025 as the preceding reference and the 2035 forecast also shown. |
| Equipment coverage | Heating equipment; ventilation equipment; air conditioning and cooling equipment. |
| Installation coverage | New construction; replacement and retrofit. |
| End users | Residential, commercial and industrial users. |
| Country analysis | China, India, Germany, France, United Kingdom, United States and Brazil. These profiles do not define the boundaries of global revenue. |
| Geographic coverage | Seven regions, with country profiles within North America, Latin America, Western Europe, East Asia, and South Asia and Pacific; other regions remain in global coverage. |
| Competitive coverage | Equipment supply, installer support, refrigerant compliance, commercial controls and service responsibilities. |
Source: Future Market Insights, HVAC Market Report, 2026 to 2036.
HVAC Market Research Methodology
The market-value series, heating-equipment share and country forecasts are considered alongside public evidence on equipment demand. Material from energy agencies, government bodies, the heat-pump industry association and manufacturers supplies evidence on replacement, installation and regulation. FMI's installation and end-user assessment uses the underlying segment structure and checks its commercial interpretation against replacement and building-use evidence. Company activities are checked against their stated dates and business scope; heat-pump statistics are kept distinct from the wider HVAC market.
HVAC Market by Segments
HVAC Market segmented by Equipment Type:
- Heating equipment
- Ventilation equipment
- Air conditioning and cooling equipment
HVAC Market segmented by Installation:
- New construction
- Replacement and retrofit
HVAC Market segmented by End User:
- Residential
- Commercial
- Industrial
HVAC Market by Region
- North America
- United States
- Canada
- Latin America
- Brazil
- Mexico
- Argentina
- Chile
- Western Europe
- Germany
- France
- United Kingdom
- Italy
- Spain
- Benelux
- Nordics
- Eastern Europe
- Poland
- Czech Republic
- Romania
- Hungary
- East Asia
- China
- Japan
- South Korea
- Taiwan
- South Asia and Pacific
- India
- Singapore
- Other ASEAN countries
- Australia and New Zealand
- Middle East and Africa
- GCC Countries
- South Africa
- Türkiye
- Israel
Research Sources and Bibliography
- [1] ENERGY STAR. Clean Heating and Cooling. Accessed 31 October 2026.
- [2] Daikin Europe. Daikin inaugurates new heat pump production site in Poland. 21 May 2026.
- [3] International Energy Agency. Heat Pump Monitor 2026: Key findings. 2026.
- [4] US Census Bureau. 13.2 Million Households Were Uncomfortably Hot for 24 Hours or More in 2023. 4 September 2025.
- [5] International Energy Agency. Global Energy Review 2026: Technology, Heat pumps. 2026.
- [6] Government of Canada. Heat pumps: selection, sizing and installation guidance. Accessed 31 October 2026.
- [7] US Department of Energy. Purchasing Energy-Efficient Residential Air-Source Heat Pumps. Accessed 31 October 2026.
- [8] European Heat Pump Association. Market data: 2025 sales. Accessed 31 October 2026.
- [9] US Department of Energy, Building America Solution Center. Heat Pump Replacement: Home Improvement Expert checklist. Accessed 31 October 2026.
- [10] International Energy Agency. India's electricity demand grows at night: Managing rising cooling demand. 2026.
- [11] International Energy Agency. World Energy Outlook 2025: Executive summary. 2025.
- [12] US Environmental Protection Agency. Regulatory Actions for Technology Transitions, including May 2026 reconsideration. Accessed 31 October 2026.
- [13] Northeast Energy Efficiency Partnerships, hosted by US Department of Energy. Guide to Sizing and Selecting Air-Source Heat Pumps in Cold Climates. Revised 8 April 2020.
- [14] Carrier. Commercial HVAC Products and Solutions. Accessed 31 October 2026.
- [15] State Council Information Office, China. Trade-in program drives smart, green cooling upgrade across China. 3 August 2026.
- [16] German Federal Environment Ministry. Wärmepumpen: effizient, ausgereift und wirtschaftlich. 8 July 2026.
- [17] Service Public, France. MaPrimeRénov', including provisions from 1 September 2026. Accessed 31 October 2026.
- [18] UK Department for Energy Security and Net Zero. Boiler Upgrade Scheme statistics collection, September 2026 release. 29 October 2026.
- [19] Ofgem. Boiler Upgrade Scheme Installer Guidance V5. 28 April 2026.
- [20] Inmetro, Brazil. Condicionadores de ar: Programa Brasileiro de Etiquetagem, registered products and new label. Accessed 31 October 2026.
- [21] Bosch Home Comfort Group. Questions and Answers on the acquisition of residential and light-commercial HVAC businesses from Johnson Controls and Hitachi. 1 August 2025.
- [22] Johnson Controls International plc. FY2026 First Quarter Form 10-Q, discontinued operations. 2026.
Table of Content
Table of Content
- Key Takeaways
- Market Size and CAGR
- Top Growth Driver
- Fastest Growing Segment
- Leading Region
- Key Companies
- Emerging Opportunities
- Executive Summary
- Global Market Outlook
- Demand-side Trends
- Supply-side Trends
- Technology Roadmap Analysis
- Analysis and Recommendations
- Analyst Perspective (What is happening? Why now? What should investors know?)
- Key Questions Answered
- How large is the market?
- What is the CAGR?
- What are key trends?
- Which region dominates?
- Who are the leaders?
Read More...
- Market Overview
- Market Coverage / Taxonomy
- Market Definition / Scope / Limitations
- Research Methodology
- Chapter Orientation
- Analytical Lens and Working Hypotheses
- Market Structure, Signals, and Trend Drivers
- Benchmarking and Cross-market Comparability
- Market Sizing, Forecasting, and Opportunity Mapping
- Research Design and Evidence Framework
- Desk Research Programme (Secondary Evidence)
- Expert Input and Fieldwork (Primary Evidence)
- Tooling, Models, and Reference Databases
- Data Engineering and Model Build
- Quality Assurance and Audit Trail
- Market Background
- Market Dynamics (Drivers, Restraints, Opportunity, Trends)
- Scenario Forecast (Optimistic, Likely, Conservative)
- Impact Analysis
- AI Impact
- Sustainability Impact
- Regulatory Impact
- Technology Impact
- Consumer / Buyer Analysis
- Purchase Drivers
- Adoption Barriers
- Buyer Journey
- Opportunity Map Analysis
- Product Life Cycle Analysis
- Supply Chain Analysis
- Investment Feasibility Matrix
- Value Chain Analysis
- PESTLE and Porter's Analysis
- Regulatory Landscape
- Regional Parent Market Outlook
- Production and Consumption Statistics
- Import and Export Statistics
- Global Market Analysis and Forecast, 2021 to 2036
- Historical Market Size Value (USD Billion) Analysis, 2021 to 2025
- Current and Future Market Size Value (USD Billion) Projections, 2026 to 2036
- Y-o-Y Growth Trend Analysis
- Absolute $ Opportunity Analysis
- Global Market Pricing Analysis, 2021 to 2036
- Global Market Analysis and Forecast, By Equipment Type, 2021 to 2036
- Introduction / Key Findings
- Historical Market Size Value (USD Billion) Analysis By Equipment Type, 2021 to 2025
- Current and Future Market Size Value (USD Billion) Analysis and Forecast By Equipment Type, 2026 to 2036
- Heating equipment
- Ventilation equipment
- Air conditioning and cooling equipment
- Y-o-Y Growth Trend Analysis By Equipment Type, 2021 to 2025
- Absolute $ Opportunity Analysis By Equipment Type, 2026 to 2036
- Global Market Analysis and Forecast, By Installation, 2021 to 2036
- Introduction / Key Findings
- Historical Market Size Value (USD Billion) Analysis By Installation, 2021 to 2025
- Current and Future Market Size Value (USD Billion) Analysis and Forecast By Installation, 2026 to 2036
- New construction
- Replacement and retrofit
- Y-o-Y Growth Trend Analysis By Installation, 2021 to 2025
- Absolute $ Opportunity Analysis By Installation, 2026 to 2036
- Global Market Analysis and Forecast, By End User, 2021 to 2036
- Introduction / Key Findings
- Historical Market Size Value (USD Billion) Analysis By End User, 2021 to 2025
- Current and Future Market Size Value (USD Billion) Analysis and Forecast By End User, 2026 to 2036
- Residential
- Commercial
- Industrial
- Y-o-Y Growth Trend Analysis By End User, 2021 to 2025
- Absolute $ Opportunity Analysis By End User, 2026 to 2036
- Global Market Analysis and Forecast, By Region, 2021 to 2036
- Introduction
- Historical Market Size Value (USD Billion) Analysis By Region, 2021 to 2025
- Current Market Size Value (USD Billion) Analysis and Forecast By Region, 2026 to 2036
- North America
- Latin America
- Western Europe
- Eastern Europe
- East Asia
- South Asia and Pacific
- Middle East and Africa
- Market Attractiveness Analysis By Region
- North America Market Analysis and Forecast, By Country, 2021 to 2036
- Historical Market Size Value (USD Billion) Trend Analysis By Market Taxonomy, 2021 to 2025
- Market Size Value (USD Billion) Forecast By Market Taxonomy, 2026 to 2036
- By Country
- United States
- Canada
- By Equipment Type
- By Installation
- By End User
- By Country
- Market Attractiveness Analysis
- By Country
- By Equipment Type
- By Installation
- By End User
- Key Takeaways
- Latin America Market Analysis and Forecast, By Country
- Historical Market Size Value (USD Billion) Trend Analysis By Market Taxonomy, 2021 to 2025
- Market Size Value (USD Billion) Forecast By Market Taxonomy, 2026 to 2036
- By Country
- Brazil
- Mexico
- Argentina
- Chile
- By Equipment Type
- By Installation
- By End User
- By Country
- Market Attractiveness Analysis
- By Country
- By Equipment Type
- By Installation
- By End User
- Key Takeaways
- Western Europe Market Analysis and Forecast, By Country
- Historical Market Size Value (USD Billion) Trend Analysis By Market Taxonomy, 2021 to 2025
- Market Size Value (USD Billion) Forecast By Market Taxonomy, 2026 to 2036
- By Country
- Germany
- France
- United Kingdom
- Italy
- Spain
- Benelux
- Nordics
- By Equipment Type
- By Installation
- By End User
- By Country
- Market Attractiveness Analysis
- By Country
- By Equipment Type
- By Installation
- By End User
- Key Takeaways
- Eastern Europe Market Analysis and Forecast, By Country
- Historical Market Size Value (USD Billion) Trend Analysis By Market Taxonomy, 2021 to 2025
- Market Size Value (USD Billion) Forecast By Market Taxonomy, 2026 to 2036
- By Country
- Poland
- Czech Republic
- Romania
- Hungary
- By Equipment Type
- By Installation
- By End User
- By Country
- Market Attractiveness Analysis
- By Country
- By Equipment Type
- By Installation
- By End User
- Key Takeaways
- East Asia Market Analysis and Forecast, By Country
- Historical Market Size Value (USD Billion) Trend Analysis By Market Taxonomy, 2021 to 2025
- Market Size Value (USD Billion) Forecast By Market Taxonomy, 2026 to 2036
- By Country
- China
- Japan
- South Korea
- Taiwan
- By Equipment Type
- By Installation
- By End User
- By Country
- Market Attractiveness Analysis
- By Country
- By Equipment Type
- By Installation
- By End User
- Key Takeaways
- South Asia and Pacific Market Analysis and Forecast, By Country
- Historical Market Size Value (USD Billion) Trend Analysis By Market Taxonomy, 2021 to 2025
- Market Size Value (USD Billion) Forecast By Market Taxonomy, 2026 to 2036
- By Country
- India
- Singapore
- Other ASEAN countries
- Australia and New Zealand
- By Equipment Type
- By Installation
- By End User
- By Country
- Market Attractiveness Analysis
- By Country
- By Equipment Type
- By Installation
- By End User
- Key Takeaways
- Middle East and Africa Market Analysis and Forecast, By Country
- Historical Market Size Value (USD Billion) Trend Analysis By Market Taxonomy, 2021 to 2025
- Market Size Value (USD Billion) Forecast By Market Taxonomy, 2026 to 2036
- By Country
- GCC Countries
- South Africa
- Türkiye
- Israel
- By Equipment Type
- By Installation
- By End User
- By Country
- Market Attractiveness Analysis
- By Country
- By Equipment Type
- By Installation
- By End User
- Key Takeaways
- Key Countries Market Analysis
- United States
- Pricing Analysis
- Market Share Analysis, 2025
- By Equipment Type
- By Installation
- By End User
- Canada
- Pricing Analysis
- Market Share Analysis, 2025
- By Equipment Type
- By Installation
- By End User
- Mexico
- Pricing Analysis
- Market Share Analysis, 2025
- By Equipment Type
- By Installation
- By End User
- Brazil
- Pricing Analysis
- Market Share Analysis, 2025
- By Equipment Type
- By Installation
- By End User
- Chile
- Pricing Analysis
- Market Share Analysis, 2025
- By Equipment Type
- By Installation
- By End User
- Germany
- Pricing Analysis
- Market Share Analysis, 2025
- By Equipment Type
- By Installation
- By End User
- United Kingdom
- Pricing Analysis
- Market Share Analysis, 2025
- By Equipment Type
- By Installation
- By End User
- Italy
- Pricing Analysis
- Market Share Analysis, 2025
- By Equipment Type
- By Installation
- By End User
- Spain
- Pricing Analysis
- Market Share Analysis, 2025
- By Equipment Type
- By Installation
- By End User
- France
- Pricing Analysis
- Market Share Analysis, 2025
- By Equipment Type
- By Installation
- By End User
- India
- Pricing Analysis
- Market Share Analysis, 2025
- By Equipment Type
- By Installation
- By End User
- Australia and New Zealand
- Pricing Analysis
- Market Share Analysis, 2025
- By Equipment Type
- By Installation
- By End User
- China
- Pricing Analysis
- Market Share Analysis, 2025
- By Equipment Type
- By Installation
- By End User
- Japan
- Pricing Analysis
- Market Share Analysis, 2025
- By Equipment Type
- By Installation
- By End User
- South Korea
- Pricing Analysis
- Market Share Analysis, 2025
- By Equipment Type
- By Installation
- By End User
- Poland
- Pricing Analysis
- Market Share Analysis, 2025
- By Equipment Type
- By Installation
- By End User
- Hungary
- Pricing Analysis
- Market Share Analysis, 2025
- By Equipment Type
- By Installation
- By End User
- Türkiye
- Pricing Analysis
- Market Share Analysis, 2025
- By Equipment Type
- By Installation
- By End User
- South Africa
- Pricing Analysis
- Market Share Analysis, 2025
- By Equipment Type
- By Installation
- By End User
- United States
- Market Structure Analysis
- Competition Dashboard
- Competition Benchmarking
- Market Share Analysis of Top Players
- By Regional
- By Equipment Type
- By Installation
- By End User
- Emerging Startups
- Innovation Benchmarking
- Competition Analysis
- Competition Deep Dive
- Carrier
- Overview
- Product Portfolio
- Profitability by Market Segments
- Sales Footprint
- Strategy Overview
- Marketing Strategy
- Product Strategy
- Channel Strategy
- Daikin
- Bosch
- Johnson Controls
- Carrier
- Case Studies
- Success Stories
- Recent Developments
- Competition Deep Dive
- Assumptions & Acronyms Used
List of Tables
- Table 1: Global Market Value (USD Billion) Forecast by Region, 2021 to 2036
- Table 2: Global Market Value (USD Billion) Forecast by Equipment Type, 2021 to 2036
- Table 3: Global Market Value (USD Billion) Forecast by Installation, 2021 to 2036
- Table 4: Global Market Value (USD Billion) Forecast by End User, 2021 to 2036
- Table 5: North America Market Value (USD Billion) Forecast by Country, 2021 to 2036
- Table 6: North America Market Value (USD Billion) Forecast by Equipment Type, 2021 to 2036
- Table 7: North America Market Value (USD Billion) Forecast by Installation, 2021 to 2036
- Table 8: North America Market Value (USD Billion) Forecast by End User, 2021 to 2036
- Table 9: Latin America Market Value (USD Billion) Forecast by Country, 2021 to 2036
- Table 10: Latin America Market Value (USD Billion) Forecast by Equipment Type, 2021 to 2036
- Table 11: Latin America Market Value (USD Billion) Forecast by Installation, 2021 to 2036
- Table 12: Latin America Market Value (USD Billion) Forecast by End User, 2021 to 2036
- Table 13: Western Europe Market Value (USD Billion) Forecast by Country, 2021 to 2036
- Table 14: Western Europe Market Value (USD Billion) Forecast by Equipment Type, 2021 to 2036
- Table 15: Western Europe Market Value (USD Billion) Forecast by Installation, 2021 to 2036
- Table 16: Western Europe Market Value (USD Billion) Forecast by End User, 2021 to 2036
- Table 17: Eastern Europe Market Value (USD Billion) Forecast by Country, 2021 to 2036
- Table 18: Eastern Europe Market Value (USD Billion) Forecast by Equipment Type, 2021 to 2036
- Table 19: Eastern Europe Market Value (USD Billion) Forecast by Installation, 2021 to 2036
- Table 20: Eastern Europe Market Value (USD Billion) Forecast by End User, 2021 to 2036
- Table 21: East Asia Market Value (USD Billion) Forecast by Country, 2021 to 2036
- Table 22: East Asia Market Value (USD Billion) Forecast by Equipment Type, 2021 to 2036
- Table 23: East Asia Market Value (USD Billion) Forecast by Installation, 2021 to 2036
- Table 24: East Asia Market Value (USD Billion) Forecast by End User, 2021 to 2036
- Table 25: South Asia and Pacific Market Value (USD Billion) Forecast by Country, 2021 to 2036
- Table 26: South Asia and Pacific Market Value (USD Billion) Forecast by Equipment Type, 2021 to 2036
- Table 27: South Asia and Pacific Market Value (USD Billion) Forecast by Installation, 2021 to 2036
- Table 28: South Asia and Pacific Market Value (USD Billion) Forecast by End User, 2021 to 2036
- Table 29: Middle East and Africa Market Value (USD Billion) Forecast by Country, 2021 to 2036
- Table 30: Middle East and Africa Market Value (USD Billion) Forecast by Equipment Type, 2021 to 2036
- Table 31: Middle East and Africa Market Value (USD Billion) Forecast by Installation, 2021 to 2036
- Table 32: Middle East and Africa Market Value (USD Billion) Forecast by End User, 2021 to 2036
List of Figures
- Figure 1: Global Market Pricing Analysis
- Figure 2: Global Market Value (USD Billion) Forecast 2021-2036
- Figure 3: Global Market Value Share and BPS Analysis by Equipment Type, 2026 and 2036
- Figure 4: Global Market Y-o-Y Growth Comparison by Equipment Type, 2026-2036
- Figure 5: Global Market Attractiveness Analysis by Equipment Type
- Figure 6: Global Market Value Share and BPS Analysis by Installation, 2026 and 2036
- Figure 7: Global Market Y-o-Y Growth Comparison by Installation, 2026-2036
- Figure 8: Global Market Attractiveness Analysis by Installation
- Figure 9: Global Market Value Share and BPS Analysis by End User, 2026 and 2036
- Figure 10: Global Market Y-o-Y Growth Comparison by End User, 2026-2036
- Figure 11: Global Market Attractiveness Analysis by End User
- Figure 12: Global Market Value (USD Billion) Share and BPS Analysis by Region, 2026 and 2036
- Figure 13: Global Market Y-o-Y Growth Comparison by Region, 2026-2036
- Figure 14: Global Market Attractiveness Analysis by Region
- Figure 15: North America Market Incremental Dollar Opportunity, 2026-2036
- Figure 16: Latin America Market Incremental Dollar Opportunity, 2026-2036
- Figure 17: Western Europe Market Incremental Dollar Opportunity, 2026-2036
- Figure 18: Eastern Europe Market Incremental Dollar Opportunity, 2026-2036
- Figure 19: East Asia Market Incremental Dollar Opportunity, 2026-2036
- Figure 20: South Asia and Pacific Market Incremental Dollar Opportunity, 2026-2036
- Figure 21: Middle East and Africa Market Incremental Dollar Opportunity, 2026-2036
- Figure 22: North America Market Value Share and BPS Analysis by Country, 2026 and 2036
- Figure 23: North America Market Value Share and BPS Analysis by Equipment Type, 2026 and 2036
- Figure 24: North America Market Y-o-Y Growth Comparison by Equipment Type, 2026-2036
- Figure 25: North America Market Attractiveness Analysis by Equipment Type
- Figure 26: North America Market Value Share and BPS Analysis by Installation, 2026 and 2036
- Figure 27: North America Market Y-o-Y Growth Comparison by Installation, 2026-2036
- Figure 28: North America Market Attractiveness Analysis by Installation
- Figure 29: North America Market Value Share and BPS Analysis by End User, 2026 and 2036
- Figure 30: North America Market Y-o-Y Growth Comparison by End User, 2026-2036
- Figure 31: North America Market Attractiveness Analysis by End User
- Figure 32: Latin America Market Value Share and BPS Analysis by Country, 2026 and 2036
- Figure 33: Latin America Market Value Share and BPS Analysis by Equipment Type, 2026 and 2036
- Figure 34: Latin America Market Y-o-Y Growth Comparison by Equipment Type, 2026-2036
- Figure 35: Latin America Market Attractiveness Analysis by Equipment Type
- Figure 36: Latin America Market Value Share and BPS Analysis by Installation, 2026 and 2036
- Figure 37: Latin America Market Y-o-Y Growth Comparison by Installation, 2026-2036
- Figure 38: Latin America Market Attractiveness Analysis by Installation
- Figure 39: Latin America Market Value Share and BPS Analysis by End User, 2026 and 2036
- Figure 40: Latin America Market Y-o-Y Growth Comparison by End User, 2026-2036
- Figure 41: Latin America Market Attractiveness Analysis by End User
- Figure 42: Western Europe Market Value Share and BPS Analysis by Country, 2026 and 2036
- Figure 43: Western Europe Market Value Share and BPS Analysis by Equipment Type, 2026 and 2036
- Figure 44: Western Europe Market Y-o-Y Growth Comparison by Equipment Type, 2026-2036
- Figure 45: Western Europe Market Attractiveness Analysis by Equipment Type
- Figure 46: Western Europe Market Value Share and BPS Analysis by Installation, 2026 and 2036
- Figure 47: Western Europe Market Y-o-Y Growth Comparison by Installation, 2026-2036
- Figure 48: Western Europe Market Attractiveness Analysis by Installation
- Figure 49: Western Europe Market Value Share and BPS Analysis by End User, 2026 and 2036
- Figure 50: Western Europe Market Y-o-Y Growth Comparison by End User, 2026-2036
- Figure 51: Western Europe Market Attractiveness Analysis by End User
- Figure 52: Eastern Europe Market Value Share and BPS Analysis by Country, 2026 and 2036
- Figure 53: Eastern Europe Market Value Share and BPS Analysis by Equipment Type, 2026 and 2036
- Figure 54: Eastern Europe Market Y-o-Y Growth Comparison by Equipment Type, 2026-2036
- Figure 55: Eastern Europe Market Attractiveness Analysis by Equipment Type
- Figure 56: Eastern Europe Market Value Share and BPS Analysis by Installation, 2026 and 2036
- Figure 57: Eastern Europe Market Y-o-Y Growth Comparison by Installation, 2026-2036
- Figure 58: Eastern Europe Market Attractiveness Analysis by Installation
- Figure 59: Eastern Europe Market Value Share and BPS Analysis by End User, 2026 and 2036
- Figure 60: Eastern Europe Market Y-o-Y Growth Comparison by End User, 2026-2036
- Figure 61: Eastern Europe Market Attractiveness Analysis by End User
- Figure 62: East Asia Market Value Share and BPS Analysis by Country, 2026 and 2036
- Figure 63: East Asia Market Value Share and BPS Analysis by Equipment Type, 2026 and 2036
- Figure 64: East Asia Market Y-o-Y Growth Comparison by Equipment Type, 2026-2036
- Figure 65: East Asia Market Attractiveness Analysis by Equipment Type
- Figure 66: East Asia Market Value Share and BPS Analysis by Installation, 2026 and 2036
- Figure 67: East Asia Market Y-o-Y Growth Comparison by Installation, 2026-2036
- Figure 68: East Asia Market Attractiveness Analysis by Installation
- Figure 69: East Asia Market Value Share and BPS Analysis by End User, 2026 and 2036
- Figure 70: East Asia Market Y-o-Y Growth Comparison by End User, 2026-2036
- Figure 71: East Asia Market Attractiveness Analysis by End User
- Figure 72: South Asia and Pacific Market Value Share and BPS Analysis by Country, 2026 and 2036
- Figure 73: South Asia and Pacific Market Value Share and BPS Analysis by Equipment Type, 2026 and 2036
- Figure 74: South Asia and Pacific Market Y-o-Y Growth Comparison by Equipment Type, 2026-2036
- Figure 75: South Asia and Pacific Market Attractiveness Analysis by Equipment Type
- Figure 76: South Asia and Pacific Market Value Share and BPS Analysis by Installation, 2026 and 2036
- Figure 77: South Asia and Pacific Market Y-o-Y Growth Comparison by Installation, 2026-2036
- Figure 78: South Asia and Pacific Market Attractiveness Analysis by Installation
- Figure 79: South Asia and Pacific Market Value Share and BPS Analysis by End User, 2026 and 2036
- Figure 80: South Asia and Pacific Market Y-o-Y Growth Comparison by End User, 2026-2036
- Figure 81: South Asia and Pacific Market Attractiveness Analysis by End User
- Figure 82: Middle East and Africa Market Value Share and BPS Analysis by Country, 2026 and 2036
- Figure 83: Middle East and Africa Market Value Share and BPS Analysis by Equipment Type, 2026 and 2036
- Figure 84: Middle East and Africa Market Y-o-Y Growth Comparison by Equipment Type, 2026-2036
- Figure 85: Middle East and Africa Market Attractiveness Analysis by Equipment Type
- Figure 86: Middle East and Africa Market Value Share and BPS Analysis by Installation, 2026 and 2036
- Figure 87: Middle East and Africa Market Y-o-Y Growth Comparison by Installation, 2026-2036
- Figure 88: Middle East and Africa Market Attractiveness Analysis by Installation
- Figure 89: Middle East and Africa Market Value Share and BPS Analysis by End User, 2026 and 2036
- Figure 90: Middle East and Africa Market Y-o-Y Growth Comparison by End User, 2026-2036
- Figure 91: Middle East and Africa Market Attractiveness Analysis by End User
- Figure 92: Global Market - Tier Structure Analysis
- Figure 93: Global Market - Company Share Analysis
Frequently Asked Questions
What is the size and forecast of the HVAC Market?
The market is USD 347.66 billion in 2026, compared with USD 328.6 billion in 2025, and is forecast to reach USD 611.00 billion by 2036 at a 5.8% CAGR.
Which equipment type leads the HVAC Market?
Heating equipment holds 36.2% of the 2026 market by equipment type in FMI's assessment.
Which installation category and end user lead the HVAC Market?
Replacement and retrofit hold 54.9% by installation, while residential users hold 41.7% by end user in FMI's 2026 assessment.
Which profiled country has the highest HVAC growth forecast?
China has the highest profiled CAGR at 7.8% from 2026 to 2036, followed by India at 7.3%.
How do refrigerant rules affect an HVAC replacement order?
US EPA provisions vary by product and subsector. A contractor needs the applicable model and manufacture or import information before committing equipment to an installation. [12]
Preview the report firsthand - request a free sample
Get SampleGet the brochure for pricing and purchase details.
Get PDF
