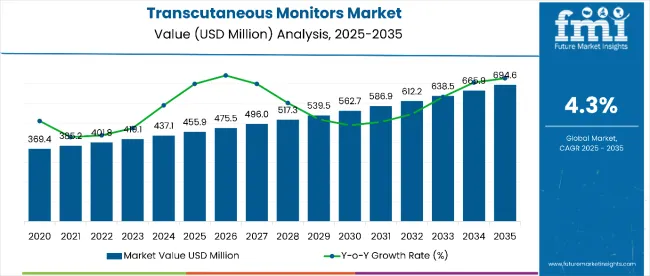
The global sales of transcutaneous monitors are estimated to be worth USD 455.9 million in 2025 and anticipated to reach a value of USD 694.6 million by 2035. Sales are projected to rise at a CAGR of 4.3% over the forecast period between 2025 and 2035. The revenue generated by transcutaneous monitors in 2024 was USD 437.1 million.
The widespread acceptance of transcutaneous monitors in NICUs is the most critical growth driver in the market. Premature and critically ill neonates often have respiratory and metabolic issues, which require constant and precise monitoring of oxygen (PtcO₂) and carbon dioxide (PtcCO₂).
Transcutaneous monitors, being non-invasive, minimize the discomfort and risks associated with frequent blood gas sampling, thus becoming a crucial tool in neonatal care.
The major factor for their increased adoption in NICUs is the ability to provide continuous, real-time monitoring and thus to immediately detect signs of respiratory distress or metabolic imbalances.
This becomes a vital need for a preterm infant who might be highly susceptible to certain conditions like hypoxia and hypercapnia. For instance, neonatal devices such as the Radiometer TCM5 FLEX are devised with a gentle heating system that does not irritate the skin but at the same time gives a higher degree of precision in measurements.
| Attributes | Key Insights |
|---|---|
| Historical Size, 2024 | USD 437.1 million |
| Estimated Size, 2025 | USD 455.9 million |
| Projected Size, 2035 | USD 694.6 million |
| Value-based CAGR (2025 to 2035) | 4.3% |
Transcutaneous monitors offer specific advantages for neonates, including low-temperature probes and compact designs that are tailored to their specific needs. Masimo Neonatal Transcutaneous Monitors, for example, have algorithms specifically designed to be highly sensitive to avoid errors in fragile preterm infants. Improving patient outcomes and minimizing clinician workload are all factors that enhance adoption into NICUs.
The increasing rate of preterm births worldwide, especially among developing countries that are engaged in the expansion of the NICU, adds demand to these monitors. More so, governments and their health institutions are keenly investing in neonatal technology care, thus promoting good market growth.
The high adoption rate among NICUs for transcutaneous monitors indicates how greatly they contribute to improved outcomes in neonates and influence the demand and development that is being witnessed in the health field.
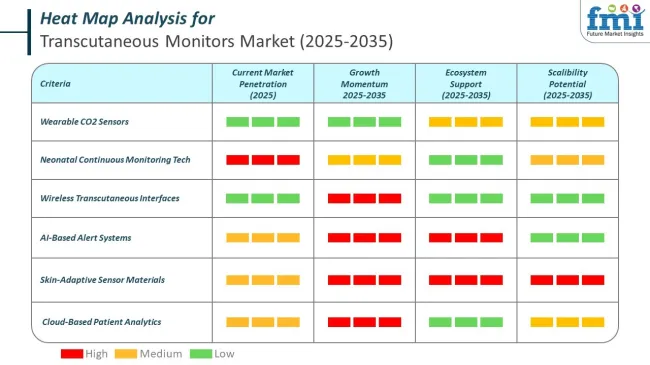
As smart automation continues to mature, its role in the transcutaneous monitors market will expand. Machine learning models will provide healthcare providers with predictive analytics, offering deeper insights into a patient's condition before critical events occur, ultimately boosting sales in the industry.
Smart algorithms will not only process patient data but also use past health trends to predict potential risks, allowing clinicians to make proactive decisions. The power of AI to predict patient conditions will transform how monitoring devices are used in both emergency rooms and home settings.
The leading companies in the transcutaneous monitors market are integrating automation to enhance patient monitoring accuracy and efficiency. Here’s how they’re advancing automation:
The below table presents the expected CAGR for the global growth of transcutaneous monitors sales over several semi-annual periods spanning from 2025 to 2035. In the first half (H1) of the decade from 2024 to 2035, the business is predicted to surge at a CAGR of 5.0%, followed by a slightly lower growth rate of 4.7% in the second half (H2) of the same decade.
| Particular | Value CAGR |
|---|---|
| H1 (2024 to 2034) | 5.0% |
| H2 (2024 to 2034) | 4.7% |
| H1 (2025 to 2035) | 4.3% |
| H2 (2025 to 2035) | 3.8% |
Moving into the subsequent period, from H1 2025 to H2 2035, the CAGR is projected to decrease slightly to 4.3% in the first half and decrease moderately at 3.8% in the second half. In the first half (H1) the market witnessed a decrease of 70.00 BPS while in the second half (H2), the market witnessed an increase of 90.00 BPS.
Customizable and Multi-Parameter Monitoring Options Are Increasing Adoption of Transcutaneous Monitors.
Transcutaneous monitors are now capable of offering modular designs and capabilities for multi-parameter measurement. These developments are helping to deal with the rising demand from healthcare providers for flexible devices that should be able to handle multiple clinical scenarios.
Modern transcutaneous monitors not only measure oxygen (PtcO₂) and carbon dioxide (PtcCO₂) levels but also integrate additional parameters such as pulse oximetry (SpO₂), hemoglobin concentration, and even pH levels, making them indispensable in critical care and neonatal units.
For instance, the SenTec Digital Monitoring System (SDMS) is one of the best examples of a configurable transcutaneous monitor. This monitor enables the user to track PtcCO₂ along with SpO₂, catering to patients suffering from respiratory disorders or long-term ventilation.
The modular design makes it possible for clinicians to tailor the device to the specific needs of patients, thus increasing its utility in ICUs and emergency settings.
The same thing goes with Masimo multi-parameter transcutaneous devices. For example, the Masimo Root contains all those parameters such as total hemoglobin (SpHb) and oxygen reserve index (ORI), giving an entire overview of a patient's respiratory and circulatory status.
This flexibility becomes crucial in improving clinical workflows and reduces the need for various standalone devices, making for optimal space and cost saving.
As healthcare providers increasingly look for devices that provide versatility and cost-effectiveness, demand for customizable and multi-parameter transcutaneous monitors will increase, driving innovation and adoption in this market.
Non-Invasive and Continuous Monitoring is favoring Sales over the Forecast Years
Among the most significant drivers propelling the adoption of transcutaneous monitors in the healthcare market is their non-invasive and continuous monitoring capabilities. Transcutaneous monitors measure oxygen (PtcO₂) and carbon dioxide (PtcCO₂) levels through the skin, unlike traditional methods such as arterial blood gas (ABG) analysis, which require invasive sampling.
This non-invasive approach eliminates patient discomfort, reduces the risk of infection, and preserves critical blood volume, particularly in neonates and critically ill patients.
Continuous monitoring can be set to give real-time data, so a trend and anomalies can be spotted in real-time. It is essential especially in NICUs where preterm infants easily succumb to respiratory and metabolic imbalances.
The examples of this kind of advantages are given through devices like the Radiometer TCM5 FLEX. It delivers accurate, uninterrupted streams of data that enable the clinician to make timely interventions and lessen the frequency of manual testing.
The increasing trend for non-invasive technologies, along with the greater focus on patient-centric care, makes transcutaneous monitors a necessity in modern health care. Their ability to enhance patient comfort, safety, and clinical efficiency contributes to their growing adoption both in hospitals and home care.
Advancements in Multi-Parameter Monitoring is creating Opportunities for Future growth
The growing demand for comprehensive monitoring solutions creates a significant opportunity for manufacturers to develop advanced multi-parameter transcutaneous monitors. Healthcare providers are increasingly looking for products that can monitor various parameters simultaneously, thus efficiently and more accurately taking care of their patients, especially in ICU, NICU, emergency departments, and more.
Manufacturers can meet this demand and therefore offer healthcare systems with multisolution devices by integrating pulse oximetry, hemoglobin measurement, and temperature measurement into the same device.
Multi-parameter transcutaneous monitors enhance clinical workflows in their ability to reduce the need for many devices, minimize setup time, and reduce patient discomfort.
In critical environments, such as those occurring during surgeries or during management of neonatal and critically ill patients, these features are highly valuable because such settings require rapid decision-making. Added value in device utility in clinical settings is further brought through the use of such high-end features as wireless connectivity, real-time analytics for data, and compatibility with hospital information systems.
With healthcare becoming increasingly digital, multi-parameter devices that align with the telemedicine and home healthcare trends will be a lucrative market. Innovations in this direction will not only help manufacturers keep pace with evolving clinical needs but also make them leaders in the rapidly advancing field of patient monitoring solutions.
Competition from Wearable Modalities Posing as a Significant Growth Barrier over the Forecast Period.
A key restraint for the market for transcutaneous monitors, especially in non-critical care and home health, is competition from wearables. Wearable health monitoring, such as smartwatches and fitness trackers, have become very popular owing to their affordability, simplicity, and wide availability. They provide basic monitoring functionality like heart rate, SpO₂, and respiratory rate, which are exactly some of the same features of a transcutaneous monitor.
For instance, Apple Watch and Fitbit have SpO₂ sensors, so that one can monitor the oxygen levels non-invasively, making these products more desirable for people who are interested in monitoring their health day-to-day.
Also, Whoop, which is a fitness-centric wearable, allows continuous heart rate variability and respiratory rate monitoring, thereby positioning itself as a complete health tool. These wearables are made user-friendly, requiring minimal technical expertise, and allow the user to monitor data in real-time.
In contrast, transcutaneous monitors, although more accurate for clinical use, tend to carry higher upfront costs, and require specialized training for healthcare professionals, and are generally more appropriate for a medical environment. Therefore, the wearables' simplicity and lower cost make them a first choice for home healthcare and personal monitoring where transcutaneous monitors are less likely to be used.
As the wearable technology market expands, especially in consumer health and wellness, transcutaneous monitors face increasing pressure to compete with these easily accessible alternatives, especially for non-acute conditions.
The global transcutaneous monitors industry recorded a CAGR of 4.1% during the historical period between 2020 and 2024. The growth of transcutaneous monitors industry was positive as it reached a value of USD 437.1 million in 2024 from USD 369.4 million in 2020.
The market for transcutaneous monitors is witnessing steady growth as patients require non-invasive and continuous monitoring in the most critical care settings, specifically in NICUs and ICUs. Historically, the market was driven by advancements in sensor technologies, which have dramatically enhanced the accuracy and reliability of transcutaneous devices.
Over the last ten years, devices have evolved from simple models measuring oxygen levels to more advanced systems that can monitor multiple parameters like carbon dioxide, pulse oximetry, and even haemoglobin levels.
Further outlook about market growth can be said where factors like increased adoption of non-invasive monitoring of patients in home care setups, increasing prevalence of chronic diseases, and aging will favor continuous development of the market. Future Demand increases along with more integrated telemedicine platforms through development in wearable technologies for its ability to offer real-time and remote patient monitoring abilities.
Transcutaneous monitors will become more functional and attractive with future technologies including integration with artificial intelligence (AI) for predictive analytics, wireless connectivity, and multi-parameter capabilities. In the realm of sensor miniaturization and increased efficiency of battery usage, devices will be more portable and cost-effective, promoting wider use in clinical and home health settings.
Tier 1 companies comprise market leaders with a significant market share of 29.1% in global market. These companies form strategic alliances and acquisitions to enhance their product portfolio and integrate advanced technologies. Major companies in tier 1 include GE Healthcare, Philips Healthcare, Hill Rom Services Inc., and Medtronic.
Tier 2 companies include mid-size players with revenue of USD 50 to 100 million having presence in specific regions and highly influencing the local market and holds around 35.5% market share. They typically pursue partnerships with academic institutions and research organizations to leverage emerging technologies and expedite product development.
These companies often emphasize agility and adaptability, allowing them to quickly bring new treatments to market, additionally targeting specific types medical conditions. Additionally, they focus on cost-effective production methods to offer competitive pricing. Prominent companies in tier 2 include Radiometer Medical Apsa and SenTec AG.
Finally, Tier 3 companies, such as Perimed AB and Criticare Technologies, Inc. They specialize in specific products and cater to niche markets, adding diversity to the industry.
Overall, while Tier 1 companies are the primary drivers of the market, Tier 2 and 3 companies also make significant contributions, ensuring the transcutaneous monitors sales remains dynamic and competitive.
The section below covers the industry analysis for the transcutaneous monitors for different countries. Market demand analysis on key countries in several regions of the globe, including North America, Latin America, East Asia, South Asia & Pacific, Western Europe, Eastern Europe and Middle East & Africa, is provided.
The United States is anticipated to remain at the forefront in North America, with higher market share through 2035. In South Asia & Pacific, India is projected to witness a CAGR of 4.0% by 2035.
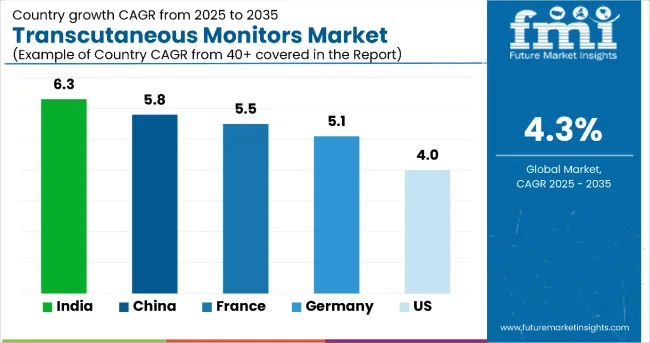
| Countries | Value CAGR (2025 to 2035) |
|---|---|
| United States | 4.0% |
| Germany | 5.1% |
| China | 5.8% |
| France | 5.5% |
| India | 6.3% |
| Spain | 4.9% |
| Australia & New Zealand | 5.2% |
| South Korea | 5.9% |
The sales of United States for transcutaneous monitors is poised to exhibit a CAGR of 4.0% between 2025 and 2035. Currently, it holds the highest share in the North American market.
The strong presence of industry leaders like Masimo, Radiometer, and Sentec in the USA market highly contributes to market growth, as these manufacturers are key players in advanced technological advancement, producing superior, precise transcutaneous monitoring that is applied over a myriad of medical ranges - from high-acuity patient care environments to neonates.
Their presence ensures wide availability and adoption across healthcare facilities in the USA Additionally, their potential to continually innovate and make improvements to the functionality of devices, including multi-parameter monitoring and wireless connectivity capabilities, places them well positioned to address changing needs by healthcare providers.
Their strong brand recognition and extensive distribution networks in the USA would significantly contribute to the growth of the market and widespread use of transcutaneous monitors in clinical settings.
The sales of Germany’s transcutaneous monitors is poised to exhibit a CAGR of 5.8% between 2025 and 2035. Currently, it holds the highest share in the Western Europe market, and the trend is expected to continue during the forecast period.
With an established healthcare system, known for its high standards and quality, which has been gradually adopting advanced medical technologies, including non-invasive monitoring solutions. Germany's efforts toward modernizing its healthcare infrastructure have helped the devices, including transcutaneous monitors, gain ground in improving patient care, especially in critical and neonatal care.
Government incentives, coupled with a sound regulatory environment for medical devices, have attracted not only domestic but also international companies to the German market.
The resultant is the production and marketing of high-quality, reliable transcutaneous monitors that satisfy all European standards. This growth in demand for sophisticated healthcare solutions has also fueled innovation in the German medical device industry, especially concerning wireless connectivity, multi-parameter monitoring, and EHR integration.
The sales of transcutaneous monitors in India is poised to exhibit a CAGR of 6.3% between 2025 and 2035. Currently, it holds the highest share in the South Asia & Pacific market, and the trend is expected to continue during the forecast period.
With the neonatal mortality rate considered the highest among all major economies, much focus has been centered on enhancing neonatal and pediatric care. This, among others, boosts the demand for more developed medical devices, which includes a transcutaneous monitor.
These devices are an indispensable unit in neonatal intensive care and monitor certain vital parameters continuously yet non-invasively to measure gases like oxygen and carbon dioxide for sustaining fragile health in newborn and infant populations.
To meet this neonatal health challenge, the government has launched numerous initiatives and healthcare programs while investing in NICU infrastructures equipped with state-of-the-art medical equipment. For instance, such initiatives are very instrumental in accelerating the adoption rate of transcutaneous monitors in hospitals across India.
These monitors will certainly add to better quality in neonatal care since they allow the delivery of accurate, and at the same time, unobtrusive monitoring; this improves survival rates and all other overall healthcare outcomes among neonates in the Indian context.
By Channel Type, the Multi-Channel Segment Accounts for 70.4% of the Market Share
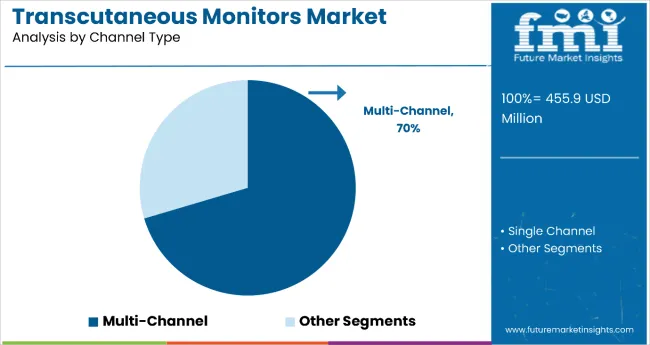
The multi-channel segment holds the dominant position with 70.4% of the market share in the channel type category within the transcutaneous monitors market. This leadership is driven by multi-channel devices' superior capability to simultaneously monitor multiple vital parameters including oxygen levels, carbon dioxide, pulse rate, and hemoglobin saturation in real-time.
Multi-channel transcutaneous monitors are highly favored in critical care environments such as neonatal intensive care units (NICUs) and intensive care units (ICUs) where healthcare providers require comprehensive, continuous monitoring of multiple vital signs for effective patient management.
The segment's dominance is reinforced by multi-channel monitors' enhanced decision-making capabilities that improve patient outcomes through comprehensive data collection and analysis. The integration of advanced technologies including wireless connectivity and data analytics makes multi-channel monitors more versatile and efficient in complex medical scenarios.
As healthcare settings become increasingly complex and patients require comprehensive monitoring solutions, the multi-channel segment is positioned to maintain its market leadership through continued innovation in sensor technology and data integration capabilities that support improved clinical workflow and patient care.
By End User, the Hospitals Segment Accounts for 24.9% of the Market Share
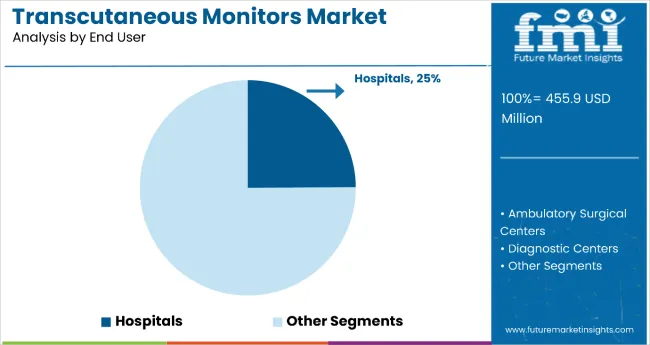
Hospitals represent the leading end-user segment with 24.9% of the market share within the transcutaneous monitors market. This leadership is attributed to hospitals' critical requirement for continuous and accurate patient monitoring across multiple departments including ICUs, NICUs, emergency wards, and surgical wards where non-invasive monitoring is essential for effective patient management.
Hospitals require reliable monitoring devices that can measure vital signs such as oxygen and carbon dioxide levels, which are critical for managing patients with respiratory, cardiovascular, and neurological conditions.
The segment's dominance is reinforced by the increasing demand for advanced monitoring technologies in hospitals, coupled with the rising trend of chronic diseases and critical care cases that necessitate sophisticated monitoring solutions.
Transcutaneous monitors provide hospitals with real-time data that enhances patient outcomes and treatment protocols, supporting the healthcare sector's shift toward patient-centric care. As hospitals continue to prioritize non-invasive monitoring technologies that improve patient comfort while maintaining clinical accuracy, the hospitals segment is expected to maintain its leading position through continued adoption of advanced transcutaneous monitoring systems that support comprehensive patient care and clinical excellence.
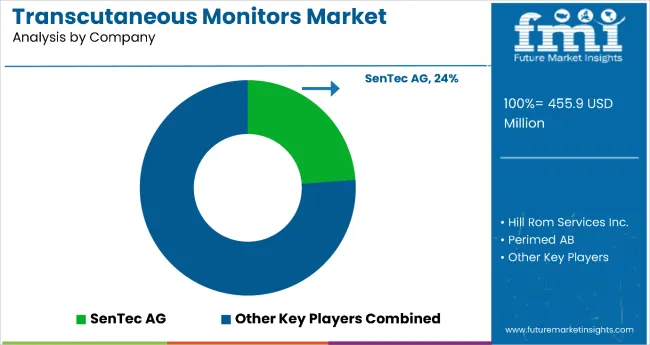
The market players are using strategies to stay competitive, such as product differentiation through innovative formulations, strategic partnerships with healthcare providers for distribution. Another key strategic focus of these companies is to actively look for strategic partners to bolster their product portfolios and expand their global market presence.
| Report Attributes | Details |
|---|---|
| Current Total Market Size (2025) | USD 455.9 million |
| Projected Market Size (2035) | USD 694.6 million |
| CAGR (2025 to 2035) | 4.3% |
| Base Year for Estimation | 2024 |
| Historical Period | 2020 to 2024 |
| Projections Period | 2025 to 2035 |
| Report Parameter | Revenue in USD million |
| By Channel Type | Single Channel, Multi-Channel |
| By End User | Hospitals, Ambulatory Surgical Centers, Diagnostic Centers, Home Care Settings |
| Regions Covered | North America, Latin America, Western Europe, Eastern Europe, South Asia and Pacific, East Asia, Middle East and Africa |
| Countries Covered | United States, Japan, Germany, India, United Kingdom, France, Italy, Brazil, Canada, South Korea, Australia, Spain, Netherlands, Saudi Arabia, Switzerland |
| Key Players | Medline Industries Inc., GE Healthcare, Philips Healthcare, Hill Rom Services Inc., Medtronic, Radiometer Medical Aps, SenTec AG, Perimed AB, Criticare Technologies, Inc., Masimo. |
| Additional Attributes | Key trends include the adoption of customizable and multi-parameter monitoring options, increasing adoption in NICUs, and advancements in non-invasive monitoring technologies. |
| Customization and Pricing | Available upon request |
In terms of channel type, the industry is divided into- single channel and multi-channel.
In terms of end user, the industry is segregated into- Hospitals, ambulatory surgical centers, diagnostic centers, and home care settings.
Key countries of North America, Latin America, Western Europe, Eastern Europe, South Asia and Pacific, East Asia and Middle East and Africa (MEA) have been covered in the report.
The global transcutaneous monitors market is projected to witness CAGR of 4.3% between 2025 and 2035.
The global sales of transcutaneous monitors stood at USD 437.1 million in 2024.
The global transcutaneous monitors market is anticipated to reach USD 694.6 million by 2035 end.
India is set to record the highest CAGR of 6.3% in the assessment period.
The key players operating in the global transcutaneous monitors market include GE Healthcare, Philips Healthcare, Hill Rom Services Inc., Medtronic, Radiometer Medical Aps, SenTec AG, Perimed AB, Criticare Technologies, Inc., Masimo, Perimed AB and Criticare Technologies, Inc.


Full Research Suite comprises of:
Market outlook & trends analysis
Interviews & case studies
Strategic recommendations
Vendor profiles & capabilities analysis
5-year forecasts
8 regions and 60+ country-level data splits
Market segment data splits
12 months of continuous data updates
DELIVERED AS:
PDF EXCEL ONLINE
Transcutaneous Oximetry Systems Market
Transcutaneous Bilirubinometers Market
In-Ear Monitors (IEMs) Market Analysis - Size, Share, and Forecast 2025 to 2035
Gaming Monitors Market Analysis - Size, Share & Forecast 2025 to 2035
Surgical Monitors Market Analysis - Industry Insights & Forecast 2025 to 2035
OTC Glucose Monitors Market Size and Share Forecast Outlook 2025 to 2035
Cholesterol Monitors Market Size and Share Forecast Outlook 2025 to 2035
Rubber Frame Monitors Market Size and Share Forecast Outlook 2025 to 2035
Ambient Dust Monitors Market Analysis - Size, Share, and Forecast Outlook 2025 to 2035
Muscle Oxygen Monitors Market Size and Share Forecast Outlook 2025 to 2035
Aluminum Frame Monitors Market Size and Share Forecast Outlook 2025 to 2035
VOC Sensors and Monitors Market Analysis - Size, Growth, and Forecast 2025 to 2035
Tunnel Visibility Monitors Market Analysis - Size, Share, and Forecast Outlook 2025 to 2035
Neonatal and Fetal Monitors Market Size and Share Forecast Outlook 2025 to 2035
Rugged Air Quality Monitors Market Insights - Growth & Forecast 2025 to 2035
Wrist Blood Pressure Monitors Market
Automotive Blind Spot Monitors Market
Multi-channel Remote ECG Monitors Market Trends - Growth & Forecast 2025 to 2035
Portable Multi-Parameter Monitors Market
Next Generation Blood Gas Monitors System Market

Thank you!
You will receive an email from our Business Development Manager. Please be sure to check your SPAM/JUNK folder too.
Chat With
MaRIA