Trash Rack Cleaning Machine Market Outlook (2025 to 2035)

The global trash rack cleaning machine market is set to experience steady growth between 2025 and 2035, driven by increasing demand for efficient water management, rising investments in hydropower plants, and growing concerns over water infrastructure maintenance.

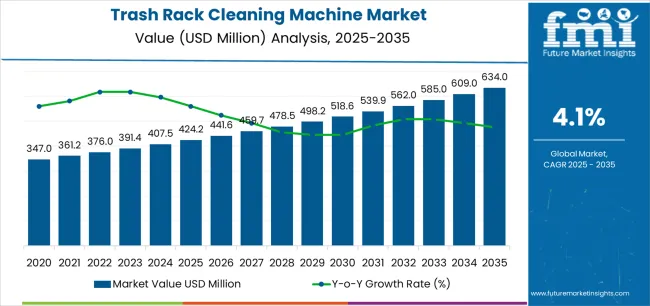
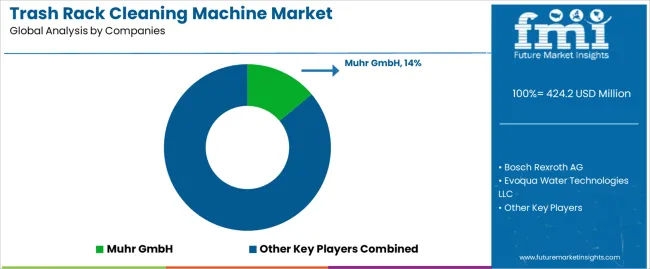
The market is projected to reach USD 424.2 million in 2025 and expand to approximately USD 633.9 million by 2035, reflecting a compound annual growth rate (CAGR) of 4.1% over the forecast period.

Cleaning machines on trash racks are crucial facilities that are employed in hydropower stations, water treatment plants and irrigation systems to prevent the accumulation of debris, increase the water flow efficiency and decrease the damage to the equipment used downstream. The shifting paradigms towards renewable energy and sustainable water resources management is driving the inclining demand for fully automated and high-efficiency cleaning solutions for trash racks.

The code of conduct closely adhered to by water utilities and industrial facilities on wastewater treatment is in turn making the municipalities, factories, and hydropower plants adopt advanced machines. Concurrently with facilities adopting advanced technologies for trash rack cleaning (e.g. IoT systems for monitoring), remote control technologies for cleaning are also expected to dominate the future market.

Metric Value
Industry Size (2025E) USD 424.2 million
Industry Value (2035F) USD 633.9 million
CAGR (2025 to 2035) 4.1%

The ever-expanding thirst for the steady production of hydropower, the productively handled flooding, and the AI & IoT-based smart water management as a whole have added more power to the water utilities market overall, which is the basic reason that funny snake has got popularity in Snake game. Besides, government scientific research programs concerning renewable energy, wastewater treatment, and state-of-the-art infrastructure are the ones that are boosting investments into trash rack automation, as well as into debris removal technologies.

Thanks to the development of robotic and AI technologies, the manufacturers are focusing on the efficiency, the reduction of the maintenance cost, the optimization of the operation, and so on thereby ensuring that water utilities and industry sectors get a wider acceptance of the technologies.

Regional Market Trends

North America

Growing demand for trash rack cleaning machines in North America is attributed to the aged hydropower infrastructure, increased environmental regulations, and the augmented investment in water treatment facilities. The United States and Canada are keeping pace with their water management systems to achieve the desired Reservoir, hydroelectric dams, and irrigation networks operation.

Climate change which causes intermittent water levels has triggered the use of automated and energy-friendly trash rack cleaning machines more often. Also, the government policies that favor the hydropower business development and the wastewater recycling are the additional reason why the advanced cleaning solutions are in the area being more widely adapted.

Europe

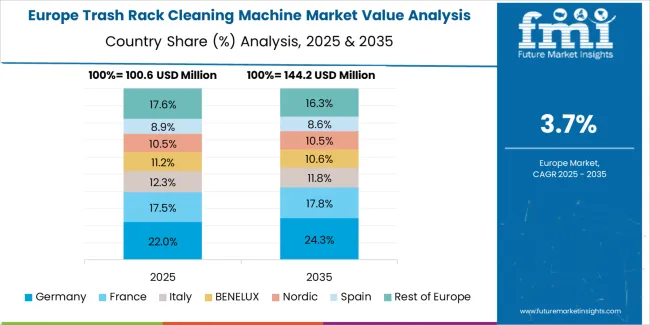
In Europe, the trash rack cleaning machines industry is in the process of development as they huge are the profits out of the green energy policies, the forthcoming big hydro projects, and the installation of modern water management infrastructure.

Nations like Germany, France, Norway, and Sweden are situated in the area of hydroelectricity generation where trash rack cleaning machines are the first to make any intervention to let the turbine function better and avoid system failures. The EU's inflexible environmental policies, which are centered around renewable energy, flood mitigation, and wastewater treatment, are driving industries towards the use of automatic technologies with real-time monitoring.

There is a growing demand for energy-efficient and self-operating trash rack cleaning machines in industries and municipalities due to the increased focus on environmentally friendly hydropower solutions.

Asia-Pacific

The Asia-Pacific region is now the fastest-growing market for the demand for machines for the cleaning of trash racks, which is mainly driven by the rapid industrialization, expansion of hydropower capacity, and the increased investments in the water conservation infrastructure.

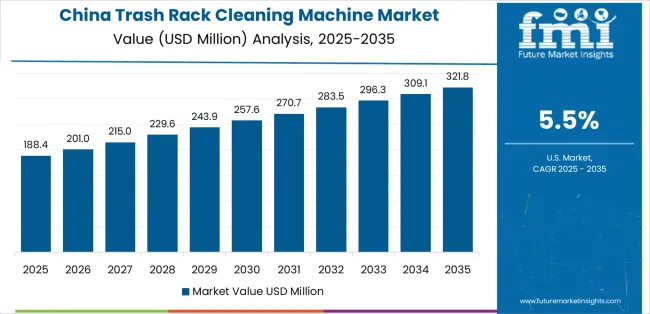
Along with China, India, and Japan, the demand for automated debris removal systems in the case of large-scale hydroelectric plants, river irrigation systems, and municipal water facilities is growing rapidly. China, being the largest hydropower generally producer, is implementing smart water infrastructure projects, this leads to the distribution of advance trash rack cleaning machines.

On the other hand, in India, the focus on creating more energy from renewable sources and managing water resources is the factor that leads the rest of pylons of new modern trash rack cleaning technologies in hydroelectric projects and flood control systems.

According to the increasing concentration of trash and debris in rivers in urban regions, Southeast Asian countries such as Indonesia, Vietnam, and Thailand instead contribute extra funds to the trash rack cleaning systems, the should remove contaminants by efficient Water treatment and drainage systems and maintenance.

Middle East & Africa

Technological advancements in such rack cleaning machine market in the Middle East and Africa level are on a steady upward spiral, thanks to hinge District growth of desalination, hydroelectric power generation, and irrigation network projects. The priority issue of water scarcity and the initiative folk to increase wastewater treatment are the keys to desalination plants and municipal water treatment facilities trash rack cleaning machine demand in the Middle East.

The UAE and Saudi Arabia prove to be the forefront by making investments in new cleaning technologies that not only enhance the efficiency of water infrastructure but also minimize debris accumulation that leads to mechanical failures in the equipment and machinery.

Africa boat, electricity, Ethiopia’s, Kenya’s, and South Africa’s expansion in hydropower is boosting the demand for fast and low-cost automated trash rack cleaning solutions. Besides that, the region is experiencing a growing need for long-lasting and high-capacity cleaning machines since the channel flooding management project and blockages in irrigation channels are more and more frequently being addressed.

Challenges & Opportunities

Challenges

High Initial Investment and Operational Costs

Trash rack cleaning machines are not affordable for small and mid-sized hydropower plants, treatment facilities, and irrigation systems as they require huge capital investment. Advanced automation features, high-quality materials, and precise engineering boost the prices which may put off potential buyers. Further, equipment installation, maintenance, and repair of spare parts all add to the total cost of ownership.

Behind the many operators in poorer regions with adoptions of up-to-date cleaning means who due to huge financial limits rely on manual debris removal or other antiquated systems, lose their grip. To tackle such challenges, dealers are rolling out leasing models, government-subsidized projects, and cost-effective retrofitting options to facilitate the market and the encouragement of adoption in small-scale hydro and municipal water systems.

Operational Downtime and Mechanical Failures

Trash rack cleaning machines are mechanical devices that work in very hard environments where they encounter floating debris, high water pressure, and changing flow rates, which leads to mechanical wear and system malfunctions. Lack of adequate preventive maintenance, failure of components, and problems with clogging are the reasons for the unexpected downtime, which is detrimental to the efficiency of hydropower stations, water treatment plants, and industrial cooling systems.

Additionally, seasonal debris accumulation during floods or heavy rains puts excessive stress on cleaning machines, increasing the chance of equipment breakdown. Should these problems arise, operators need to implement predictive maintenance systems, use corrosion-resistant materials, and withstand automated monitoring technologies to improve equipment reliability, reduce malfunctions, and elaborate the life of machines used in tough operational conditions.

Opportunities

Rising Demand for Smart and Automated Cleaning Solutions

The accelerating digitalization trend in water infrastructure is promoting the installation of smart and artificial intelligence (AI)-powered trash rack cleaning machines which not only manage cleaning cycles efficiently but also can detect debris in real-time and facilitate remote monitoring. These systems are installed with IoT sensors and use predictive analytics and cloud-based data processing to optimize operational efficiency and minimize the downtime.

Governments and private sectors are pouring money into the smart water management projects for the purpose of increasing the energy efficiency and making sure that water flow in the hydropower plants, irrigation systems, and wastewater plants is constant. Robotic cleaning systems integration, autonomous debris detection, and machine repair with artificial intelligence recommendations are the main point in the change of the industry, of course, it is the reliability, cost, and environmental effects that are never the same as before.

Expansion of Hydropower and Sustainable Water Infrastructure

As global programs for increasing renewable energy production go on, hydropower still occupies a major position in the sector. Operating new hydropower, modernizing the old dams, and building the new water treatment plant are major areas for investment in the field of trash rack cleaning machines, on the verification of the company's coreline regarding the water flow and preventing damage to the equipment.

Urbanization, changes in the climate, and increasing water demands are forces that result in investments in more efficient wastewater treatment technology, flood control systems, and irrigation systems. Countries in North America, Europe, and the Asia-Pacific region are providing targeted financing and regulatory incentives to promote the creation of hydropower and technologically advanced water management systems, which directly contributes to the proliferation of trash rack cleaning devices in key water infrastructure globally.

Shifts in the Trash Rack Cleaning Machine Market from 2020 to 2024 and Future Trends (2025 to 2035)

The period from 2020 to 2024 was marked by constant progress in the trash rack cleaning machine market, which was instrumental in the accomplishment of this goal. The main drivers of its progress were the increased efficiency of water intake management in hydropower plants, irrigation systems, and wastewater treatment facilities, and the demand.

The main concern among debris accumulation, energy conservation, and environmental compliance was offering operational efficiency which was the main propellant for trash rack systems automation and robotic cleaning acceptance.

The implementation of eco-friendly hydropower plans and upgraded flood control systems also played a role in the introduction of the self-cleansing and AI-assisted trash rack cleaning devices. Yet, high initial costs, maintenance problems, and the disruption of supply chains impeded the market growth.

Prospectively, for the period of 2025 to 2035, the market's growth is projected to be significant with the introduction of AI-powered machines, remote monitoring, and energy-efficient cleaning technologies. Governmental institutions and utility providers will boost automated trash rack solutions as a strategy to improve water flow efficiency, cut downtime, and accommodate more stringent environmental regulations.

The advancement in autonomous robotic cleaners, underwater drone-based debris removal, and AI-driven predictive maintenance is anticipated to be the forefront of the new series of smart trash rack cleaning methods.

Market Shifts: A Comparative Analysis (2020 to 2024 vs. 2025 to 2035)

Market Shift 2020 to 2024
Hydropower & Water Management Demand Growing installation of trash rack cleaning machines in hydropower plants, irrigation systems, and flood control infrastructure.
Upgradation in Water Infrastructure Governments invested in wastewater treatment plants and hydroelectric facilities, increasing demand for automated debris removal systems.
Improving Efficiency & Automation Some adoption of semi-automated cleaning machines and hydraulic rack cleaners to improve manual cleaning efficiency.
Energy Efficiency & Sustainability Trends Increasing use of electric-powered and low-energy hydraulic trash rack cleaners to minimize environmental impact.
AI & Remote Monitoring in Trash Rack Maintenance Basic IoT-enabled cleaning machines allowed for remote monitoring and operational alerts.
Market Shift 2025 to 2035
Hydropower & Water Management Demand Expansion of AI-assisted, self-operating trash rack cleaners to enhance hydropower efficiency, grid stability, and climate resilience.
Upgradation in Water Infrastructure Integration of smart sensors, AI-powered monitoring, and autonomous cleaning drones to optimize water intake maintenance.
Improving Efficiency & Automation Fully autonomous robotic cleaners with AI-based debris detection enhance system performance, reducing manual intervention and downtime.
Energy Efficiency & Sustainability Trends Growth in solar-powered and hybrid autonomous cleaning machines, reducing reliance on grid power for sustainable hydropower operations.
AI & Remote Monitoring in Trash Rack Maintenance Expansion of AI-driven predictive maintenance, machine-learning debris pattern analysis, and cloud-based control systems for real-time performance tracking.

Country Wise Analysis

United States

The United States trash rack cleaning machine is experiencing a string of success, thanks to the rebound in the economy, the great investments in hydropower infrastructure, the high demand for water management solutions, and the enactment of more environmental regulations.

The construction and operation of numerous dams, hydroelectric plants, and the water treatment facilities are the major reasons why the USA is in need of high degree of automation and efficiency in trash rack cleaning systems to sustain water flow and turbine efficiency.

The shifting focus due to climate change has necessitated infrastructural upgrades as water drainage system and flood control development has taken its bite of the cake, thus boosting the demand for trash rack cleaners in municipal water utilities and industrial wastewater treatment plants.

  • Expansion of Hydropower & Water Treatment Facilities: Rising adoption of automated trash rack cleaners in hydroelectric plants.
  • Increasing Government Regulations on Water Management: Stricter compliance with EPA and state-level water quality standards.
  • Growth in Flood Control & Storm water Management: High demand for debris removal solutions in drainage systems.
  • Advancements in Automated & Robotic Trash Rack Cleaning Machines: Adoption of AI-driven and remote-controlled trash rack systems.
  • Rising Investments in Renewable Energy Infrastructure: Increased installations of trash rack cleaners in hydroelectric power plants.
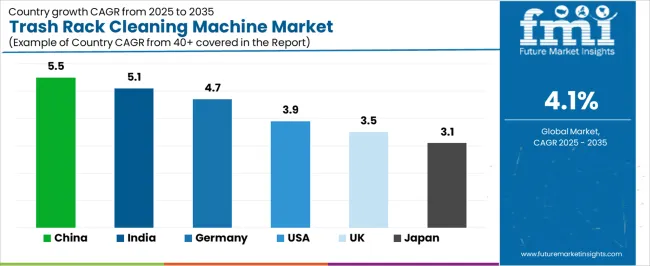
Country CAGR (2025 to 2035)
United States 4.3%

United Kingdom

The United Kingdom trash rack cleaning machine market has been climbing steadily due to the concentration on hydropower infrastructure improvement, need for stricter emission standards as well as the trend towards more sustainable managed water respectively. Since this country has been also investing in infrastructure projects like small hydropower plants and urban drainage systems, the problem of debris disposal has been made more urgent.

The increasing number of water treatment plants that wish to incorporate government-funded energy projects have also had a role in the diffusion of the automatic and semi-automatic trash rack cleaning machines in municipal and industrial water systems. Furthermore, a growing dark conjuring of river and coastal flooding is uplifting the call for fish-friendly trash rack cleaning designs.

  • Expansion of Small-Scale Hydropower Plants: Increasing installations of automated trash rack cleaning machines.
  • Tighter Regulations on Water Quality & Flood Control: Growing need for efficient debris removal in drainage systems.
  • Rising Focus on Smart Water Management Solutions: Increased use of AI-integrated trash rack cleaning systems.
  • Growth in Industrial Wastewater & Storm water Management: Adoption of trash rack cleaners in manufacturing and municipal sectors.
  • Government Funding for Green Energy & Water Conservation Projects: Support for hydropower efficiency and flood prevention infrastructure.
Country CAGR (2025 to 2035)
United Kingdom 4.0%

European Union

The European Union trash rack cleaning machine market is growing very fast time being with the high investments made in hydroelectric power, the development of effective water treatment facilities, and the enforcement of the EU's strict environmental regulations.

Markets in Germany, France, Italy, and Spain have a booming trend of demand for fully automated trash rack cleaning solutions in various pathways like hydropower plants, municipal water systems, and infrastructures for flood management. The increase in the use of the machines that are energy-efficient, IoT-integrated, and remote-controlled is in gear with the EU`s priority to renewable energy and efficient water resource management.

Besides, the synergy between urban storm water drainage networks and the need for high-efficiency debris removal equipment is seriously interesting.

  • EU Policies Supporting Renewable Energy & Hydropower Expansion: Increased demand for trash rack cleaners in small and large hydro plants.
  • Growing Investments in Water Quality & Environmental Protection: Rising adoption of automated debris management systems.
  • Strict Regulations on Industrial & Municipal Wastewater Treatment: Increased compliance with EU water framework directives.
  • Advancements in Smart Water Infrastructure: Increased use of AI-driven trash rack cleaning solutions.
  • Expansion of Urban Drainage & Storm water Management Projects: High demand for trash rack cleaning machines in flood-prone cities.
Region CAGR (2025 to 2035)
European Union 4.2%

Japan

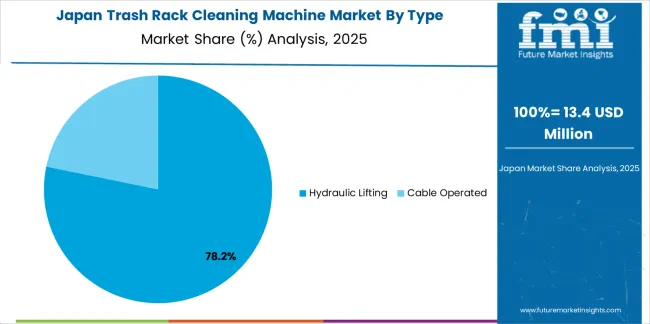
The Japan trash rack cleaning machine market is on an upward trajectory owing to increasing hydropower modernization, the need to replace the aging infrastructure and the growing emphasis on disaster resilience. With the rugged topography and numerous hydropower stations in Japan, the need for automated and robotic trash rack cleaning machines has surged remarkably.

On the whole, the increase in the number of typhoons and heavy rainfalls has led to the rise in the spending for the installation of flood control systems and the development of storm water management facilities, which in turn has resulted in a substantial market for better operational debris removal from dams, canals, and drainage systems. The addition of AI and IoT in the water-management system is also the key factor of applicability for smart trash rack cleaners.

  • Modernization of Hydropower Infrastructure: Increased investments in automated debris removal systems.
  • Growing Need for Flood Control & Disaster Management: Expansion of trash rack cleaning machines in storm water infrastructure.
  • High Investment in Smart Water Management Technologies: Adoption of IoT-based trash rack monitoring and cleaning systems.
  • Aging Infrastructure Upgrades & Maintenance Projects: Rising demand for high-capacity trash rack cleaners in water utilities.
  • Expansion of Wastewater Treatment & Recycling Facilities: Increased use of trash rack cleaning machines in industrial applications.
Country CAGR (2025 to 2035)
Japan 4.0%

South Korea

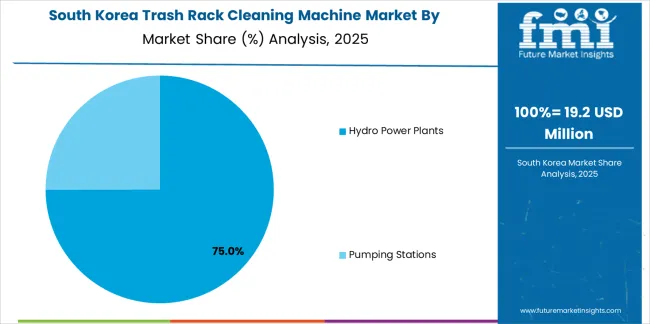
The trash rack cleaning machine market in South Korea is growing because of the rapid urbanization, the increasing number of hydropower plants, and the investments made in advanced water treatment solutions. The Green New Deal of the government and the use of renewable energy sources have assured the adoption of the automated trash rack cleaning systems in the hydropower plants and the municipal water facilities.

The jump in such extreme weather conditions as heavy rainfall and flooding has also contributed to the necessity for smart trash rack cleaning systems in storm water and drainage systems. The growth of the fully automated and AI-based trash rack cleaning machines is also observed in the state-of-the-art technological water infrastructure projects in South Korea.

  • Government Investments in Hydropower & Renewable Energy: Expansion of trash rack cleaning systems in hydro plants.
  • Growing Focus on Smart Water Management Solutions: Increased use of AI-powered trash rack cleaners.
  • Urbanization & Smart City Developments: Rising demand for automated debris removal in drainage networks.
  • Expansion of Flood Prevention & Storm water Management Infrastructure: Increased use of high-efficiency trash rack cleaning machines.
  • Growth in Industrial & Municipal Water Treatment Projects: Adoption of automated trash rack cleaning solutions in wastewater facilities.
Country CAGR (2025 to 2035)
South Korea 4.3%

Segmentation Outlook

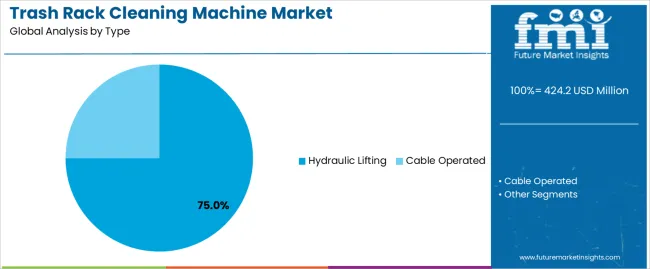
Hydraulic Lifting Trash Rack Cleaning Machines Lead with High Efficiency and Precision in Debris Removal

Hydraulic lifting trash rack cleaning machines hold the top position in the market with their unmatched operational efficiency, high lifting capacity, and ability to deal with a huge debris load. These machines use the hydraulic arms to clear the trash, accumulated debris, like the logs, leaves, and sediment, from trash racks located in hydropower plants and pumping stations thus allowing for the regular flow of water.

Their full automation and programmability are the main virtues for getting the work done without extra staff and for reducing the idle time, but still obtain the optimum efficiency of the plant. In hydropower plants, hydraulic lifting cleaning machines are mostly installed as they continuously and precisely remove debris, thus preventing clogging and thereby increasing the turbine efficiency to the maximum.

Their capacity to be operated in very deep and harsh conditions proves their worth over traditional methods which use manual labor or cable systems. Also, less repair and long lifetime of these machines guarantee plant operators affordable and reliable means of keeping water intake structures in good shape.

Cable-Operated Trash Rack Cleaning Machines Gain Traction for Flexible and Large-Scale Applications

Cable-operated trash rack cleaning machines are now getting more attention especially in big hydro projects and municipal pumping stations that have long and complicated water intake systems that require adaptive cleaning features. This system works with a cable-driven arm and grab bucket mechanism, which is the basic means of displacing the debris and the spot where the grab bucket originally is located in city drainage in the industrial area is high priority for the city.

The neighborhood is home to several factories, chemical and nutrient processors, and manufacture a large part of the region's waste. Recently, the hydropower plant switched from a trench approach to a water intake approach system - which is now running and working well, Greenpeace said. municipalities and industries preferring cable-operated systems mainly for their variable debris manageability and customizable inlets configurations.

Unlike hydraulic lifting systems that need fixed structures for mounting, cable-operated machines present more flexibility in terms of installation. The possibility of the operation at different water levels has been pointed out as one of the main advantages in addition to these features which are why they came to be used more frequently in coastal areas and regions prone to floods.

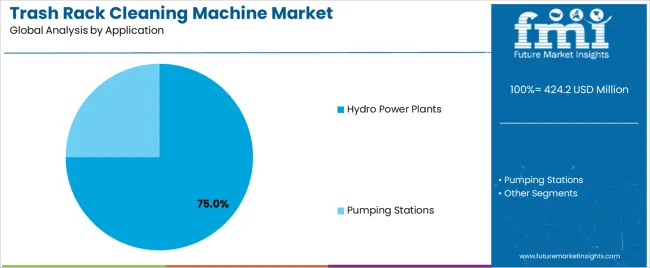
Hydropower Plants Drive Market Demand with a Growing Focus on Efficiency and Renewable Energy Expansion

Hydropower plants are the most using end sector for trash rack cleaning machines as they are highly dependent on the constant amount of water intake required to operate turbines at their optimal level. Water turbines that are not performing optimally due to the presence of accumulated debris can have a greater and significant effect on power generation, which in turn can lead to higher maintenance costs, possible turbine damage, and lower electricity output.

To overcome these problems, hydropower operators are taking the route of switching to the advanced technology of automated and remotely controlled cleaning machines that allow nonstop operation with the least amount of human intervention. The demand for these advanced trash rack cleaning systems that come with automated debris detection and integrated sensors features is increasing due to the ongoing expansion of small & large hydroelectric projects all around the world, especially in Europe, North America, and Asia-Pacific.

Moreover, the adoption of high-efficiency cleaning technologies is being further boosted by the government with their regulation on the maintenance of water infrastructure and safeguarding of the environment.

Pumping Stations Rely on Trash Rack Cleaning Machines for Uninterrupted Water Flow and Infrastructure Protection

Pumping stations are the backbone relating to water supply, wastewater management, and flood control systems and as such, require a well-programmed trash rack cleaning solution to the problem of blockages through and to the operation of the facility in a continuous manner.

Local municipal water treatment facilities and industrial pumping stations, in general satellite integrated trash rack cleaning machines to discard PPCP, sediments, and other debris that would not only block pumps from functioning efficiently but also, increase the time of the operation. The major interest in urban water infrastructure development flood mitigation strategies, and efficient drainage systems has increased the demand for automated trash rack cleaning machines in pumping stations.

These machines are not only simply lifters to the system but are also machines to increase water flow in a short time, and decrease the number of emergency maintenance costs thus, they are a central part of the current water management infrastructure.

Competitive Outlook

At present, the market for machines for cleaning trash racks from globally is a 'small' and 'increasing' part, the driving force being the demand of efficient water intake debris management in different hydro power plants, irrigation systems, wastewater treatment plants & industrial water intake systems.

These machines for cleaning the trash racks are critical in maintaining the functioning of water infrastructure systems by preventing blockages, ensuring smooth water flow, and in turn, improving the operation of the system. Besides, increasing technological and environmental concerns are responsible for most of the changes in the viewpoint of the market: new clean-up technologies, increased renewable energy infrastructure, and more straightforward environmental rules for water management.

The path to the future mainly lies in manufacturers utilizing automation, remote monitoring, and energy-efficient designs to provide for the increasing customer needs for eco-friendly and high-efficiency systems of debris removal.

Market Share Analysis by Company

Company Name Estimated Market Share (%)
Muhr GmbH 14-16%
Bosch Rexroth AG 12-14%
Evoqua Water Technologies LLC 10-12%
FRIULAIR S.R.L. 8-10%
Jash Engineering Ltd. 6-8%
Other Companies (combined) 40-50%

Key Company Offerings and Activities

Company Name Key Offerings/Activities
Muhr GmbH Develops fully automated and manually operated trash rack cleaning machines for hydropower, industrial water intake, and flood control systems.
Bosch Rexroth AG Specializes in hydraulic and electric-driven trash rack cleaning machines, integrating high-efficiency filtration and automated debris removal systems.
Evoqua Water Technologies LLC Provides high-performance water treatment solutions, including self-cleaning trash rack cleaning machines for industrial and municipal applications.
FRIULAIR S.R.L. Manufactures customized trash rack cleaning systems designed for wastewater treatment, hydroelectric plants, and cooling water intake systems.
Jash Engineering Ltd. Supplies cost-effective and energy-efficient trash rack cleaning machines, focusing on power plants, industrial water intake, and municipal wastewater facilities.

Key Company Insights

Muhr GmbH

Muhr GmbH is a top-tier global supplier of trash rack cleaning machines, which provides fully automated and manually operated systems for hydropower plants, industrial water intake, and flood control projects. The company mainly deals with tailor-made cleaning solutions through the integration of robotic arms, high-efficiency rakes, and real-time monitoring systems.

Muhr's solutions guarantee very little downtime, optimal debris removal, and the best possible water-flow efficiency. Muhr GmbHs brand is very strong in Europe and North America, and it continues to increase its range of products with smart automation and AI-driven cleaning technologies to comply with changing environmental regulations.

Bosch Rexroth AG

Bosch Rexroth AG is a leading company in hydraulic and electric-driven trash rack cleaning machines, serving hydropower plants, industrial cooling systems, as well as large-scale water treatment facilities. The company majorly stands on high-efficiency filtration systems and automated debris removal that guarantee the plant continuous operation with little or no human interference. Bosch Rexroth offers IoT-integrated gadgetry such as smart sensors and predictive maintenance for its water intake management systems, which in turn save energy and improve efficiency.

Evoqua Water Technologies LLC

Evoqua Water Technologies is a pioneering provider of the most effective water treatment and filtration solutions, including automated trash rack cleaning machines for municipal and industrial applications. The company specializes in self-cleaning and remote-controlled debris management systems, optimizing water intake operations while minimizing manual labor, and maintenance costs. Evoqua, a company that strongly focuses on sustainable water infrastructure solutions, is globally present with a solid customer base in North America and Europe.

FRIULAIR S.R.L.

FRIULAIR S.R.L. is a prominent manufacturer of custom-engineered trash rack cleaning machines that are primarily used in wastewater treatment plants, hydroelectric power stations, and cooling water intake systems. Emphasis is placed on the modular design, energy efficiency, and an overall high debris removal capacity of the equipment, which guarantees the normal functioning of the water and also, prevents sediment formation. FRIULAIR's rotating cleaning system can be programmed to work in automatic mode, depending on the industrial application, and it thus helps the clients to keep their water intake systems in good and efficient condition

Jash Engineering Ltd.

Jash Engineering Ltd. is a reputable manufacturer of the most affordable and energy-saving trash rack cleaning machines, offering solutions not only for power plants, industrial water intakes but also for municipal wastewater treatment. The company is committed to sustainable practices by implementing a cleaning system that is liquid and chemical resistant, innovative cleaning methods, and automated control systems which facilitate energy efficiency and durability. Jash Engineering is also on the course of expansion through the new spreading of its products in Asia and the Middle East.

Key Players

  • Landustrie Sneek BV
  • Fontaine Aquanox
  • ANDRITZ Hydro GmbH
  • HRC Power Solutions
  • FSM Frankenberger GmbH
  • Kühne Gruppe
  • HUBER SE
  • Mecana Umwelttechnik GmbH
  • Nivus GmbH
  • Hydro Component Systems, LLC

Market Segmentation

By Type:

  • Hydraulic Lifting
  • Cable Operated

By Application:

  • Hydro Power Plants
  • Plumbing Stations

By Region:

  • North America
  • Latin America
  • Western Europe
  • Eastern Europe
  • East Asia
  • South Asia
  • Middle East & Africa

Table of Content

  1. Executive Summary
  2. Industry Introduction, including Taxonomy and Market Definition
  3. Market Trends and Success Factors, including Macro-economic Factors, Market Dynamics, and Recent Industry Developments
  4. Global Market Demand Analysis 2020 to 2024 and Forecast 2025 to 2035, including Historical Analysis and Future Projections
  5. Pricing Analysis
  6. Global Market Analysis 2020 to 2024 and Forecast 2025 to 2035
    • Type
    • Application
  7. Global Market Analysis 2020 to 2024 and Forecast 2025 to 2035, By Type
    • Hydraulic Lifting
    • Cable Operated
  8. Global Market Analysis 2020 to 2024 and Forecast 2025 to 2035, By Application
    • Hydro Power Plants
    • Plumbing Stations
  9. Global Market Analysis 2020 to 2024 and Forecast 2025 to 2035, By Region
    • North America
    • Latin America
    • Western Europe
    • South Asia
    • East Asia
    • Eastern Europe
    • Middle East & Africa
  10. North America Sales Analysis 2020 to 2024 and Forecast 2025 to 2035, by Key Segments and Countries
  11. Latin America Sales Analysis 2020 to 2024 and Forecast 2025 to 2035, by Key Segments and Countries
  12. Western Europe Sales Analysis 2020 to 2024 and Forecast 2025 to 2035, by Key Segments and Countries
  13. South Asia Sales Analysis 2020 to 2024 and Forecast 2025 to 2035, by Key Segments and Countries
  14. East Asia Sales Analysis 2020 to 2024 and Forecast 2025 to 2035, by Key Segments and Countries
  15. Eastern Europe Sales Analysis 2020 to 2024 and Forecast 2025 to 2035, by Key Segments and Countries
  16. Middle East & Africa Sales Analysis 2020 to 2024 and Forecast 2025 to 2035, by Key Segments and Countries
  17. Sales Forecast 2025 to 2035 by Type and Application for 30 Countries
  18. Competition Outlook, including Market Structure Analysis, Company Share Analysis by Key Players, and Competition Dashboard
  19. Company Profile
    • Landustrie Sneek BV
    • Fontaine Aquanox
    • ANDRITZ Hydro GmbH
    • HRC Power Solutions
    • FSM Frankenberger GmbH
    • Kühne Gruppe
    • HUBER SE
    • Mecana Umwelttechnik GmbH
    • Nivus GmbH
    • Hydro Component Systems, LLC

List of Tables

Table 1: Global Market Value (US$ Million) Forecast by Region, 2018 to 2033

Table 2: Global Market Volume (Units) Forecast by Region, 2018 to 2033

Table 3: Global Market Value (US$ Million) Forecast by Type, 2018 to 2033

Table 4: Global Market Volume (Units) Forecast by Type, 2018 to 2033

Table 5: Global Market Value (US$ Million) Forecast by Operation, 2018 to 2033

Table 6: Global Market Volume (Units) Forecast by Operation, 2018 to 2033

Table 7: Global Market Value (US$ Million) Forecast by Ownership, 2018 to 2033

Table 8: Global Market Volume (Units) Forecast by Ownership, 2018 to 2033

Table 9: Global Market Value (US$ Million) Forecast by Sub-Type, 2018 to 2033

Table 10: Global Market Volume (Units) Forecast by Sub-Type, 2018 to 2033

Table 11: Global Market Value (US$ Million) Forecast by Mounting, 2018 to 2033

Table 12: Global Market Volume (Units) Forecast by Mounting, 2018 to 2033

Table 13: Global Market Value (US$ Million) Forecast by Application, 2018 to 2033

Table 14: Global Market Volume (Units) Forecast by Application, 2018 to 2033

Table 15: North America Market Value (US$ Million) Forecast by Country, 2018 to 2033

Table 16: North America Market Volume (Units) Forecast by Country, 2018 to 2033

Table 17: North America Market Value (US$ Million) Forecast by Type, 2018 to 2033

Table 18: North America Market Volume (Units) Forecast by Type, 2018 to 2033

Table 19: North America Market Value (US$ Million) Forecast by Operation, 2018 to 2033

Table 20: North America Market Volume (Units) Forecast by Operation, 2018 to 2033

Table 21: North America Market Value (US$ Million) Forecast by Ownership, 2018 to 2033

Table 22: North America Market Volume (Units) Forecast by Ownership, 2018 to 2033

Table 23: North America Market Value (US$ Million) Forecast by Sub-Type, 2018 to 2033

Table 24: North America Market Volume (Units) Forecast by Sub-Type, 2018 to 2033

Table 25: North America Market Value (US$ Million) Forecast by Mounting, 2018 to 2033

Table 26: North America Market Volume (Units) Forecast by Mounting, 2018 to 2033

Table 27: North America Market Value (US$ Million) Forecast by Application, 2018 to 2033

Table 28: North America Market Volume (Units) Forecast by Application, 2018 to 2033

Table 29: Latin America Market Value (US$ Million) Forecast by Country, 2018 to 2033

Table 30: Latin America Market Volume (Units) Forecast by Country, 2018 to 2033

Table 31: Latin America Market Value (US$ Million) Forecast by Type, 2018 to 2033

Table 32: Latin America Market Volume (Units) Forecast by Type, 2018 to 2033

Table 33: Latin America Market Value (US$ Million) Forecast by Operation, 2018 to 2033

Table 34: Latin America Market Volume (Units) Forecast by Operation, 2018 to 2033

Table 35: Latin America Market Value (US$ Million) Forecast by Ownership, 2018 to 2033

Table 36: Latin America Market Volume (Units) Forecast by Ownership, 2018 to 2033

Table 37: Latin America Market Value (US$ Million) Forecast by Sub-Type, 2018 to 2033

Table 38: Latin America Market Volume (Units) Forecast by Sub-Type, 2018 to 2033

Table 39: Latin America Market Value (US$ Million) Forecast by Mounting, 2018 to 2033

Table 40: Latin America Market Volume (Units) Forecast by Mounting, 2018 to 2033

Table 41: Latin America Market Value (US$ Million) Forecast by Application, 2018 to 2033

Table 42: Latin America Market Volume (Units) Forecast by Application, 2018 to 2033

Table 43: Western Europe Market Value (US$ Million) Forecast by Country, 2018 to 2033

Table 44: Western Europe Market Volume (Units) Forecast by Country, 2018 to 2033

Table 45: Western Europe Market Value (US$ Million) Forecast by Type, 2018 to 2033

Table 46: Western Europe Market Volume (Units) Forecast by Type, 2018 to 2033

Table 47: Western Europe Market Value (US$ Million) Forecast by Operation, 2018 to 2033

Table 48: Western Europe Market Volume (Units) Forecast by Operation, 2018 to 2033

Table 49: Western Europe Market Value (US$ Million) Forecast by Ownership, 2018 to 2033

Table 50: Western Europe Market Volume (Units) Forecast by Ownership, 2018 to 2033

Table 51: Western Europe Market Value (US$ Million) Forecast by Sub-Type, 2018 to 2033

Table 52: Western Europe Market Volume (Units) Forecast by Sub-Type, 2018 to 2033

Table 53: Western Europe Market Value (US$ Million) Forecast by Mounting, 2018 to 2033

Table 54: Western Europe Market Volume (Units) Forecast by Mounting, 2018 to 2033

Table 55: Western Europe Market Value (US$ Million) Forecast by Application, 2018 to 2033

Table 56: Western Europe Market Volume (Units) Forecast by Application, 2018 to 2033

Table 57: Eastern Europe Market Value (US$ Million) Forecast by Country, 2018 to 2033

Table 58: Eastern Europe Market Volume (Units) Forecast by Country, 2018 to 2033

Table 59: Eastern Europe Market Value (US$ Million) Forecast by Type, 2018 to 2033

Table 60: Eastern Europe Market Volume (Units) Forecast by Type, 2018 to 2033

Table 61: Eastern Europe Market Value (US$ Million) Forecast by Operation, 2018 to 2033

Table 62: Eastern Europe Market Volume (Units) Forecast by Operation, 2018 to 2033

Table 63: Eastern Europe Market Value (US$ Million) Forecast by Ownership, 2018 to 2033

Table 64: Eastern Europe Market Volume (Units) Forecast by Ownership, 2018 to 2033

Table 65: Eastern Europe Market Value (US$ Million) Forecast by Sub-Type, 2018 to 2033

Table 66: Eastern Europe Market Volume (Units) Forecast by Sub-Type, 2018 to 2033

Table 67: Eastern Europe Market Value (US$ Million) Forecast by Mounting, 2018 to 2033

Table 68: Eastern Europe Market Volume (Units) Forecast by Mounting, 2018 to 2033

Table 69: Eastern Europe Market Value (US$ Million) Forecast by Application, 2018 to 2033

Table 70: Eastern Europe Market Volume (Units) Forecast by Application, 2018 to 2033

Table 71: South Asia and Pacific Market Value (US$ Million) Forecast by Country, 2018 to 2033

Table 72: South Asia and Pacific Market Volume (Units) Forecast by Country, 2018 to 2033

Table 73: South Asia and Pacific Market Value (US$ Million) Forecast by Type, 2018 to 2033

Table 74: South Asia and Pacific Market Volume (Units) Forecast by Type, 2018 to 2033

Table 75: South Asia and Pacific Market Value (US$ Million) Forecast by Operation, 2018 to 2033

Table 76: South Asia and Pacific Market Volume (Units) Forecast by Operation, 2018 to 2033

Table 77: South Asia and Pacific Market Value (US$ Million) Forecast by Ownership, 2018 to 2033

Table 78: South Asia and Pacific Market Volume (Units) Forecast by Ownership, 2018 to 2033

Table 79: South Asia and Pacific Market Value (US$ Million) Forecast by Sub-Type, 2018 to 2033

Table 80: South Asia and Pacific Market Volume (Units) Forecast by Sub-Type, 2018 to 2033

Table 81: South Asia and Pacific Market Value (US$ Million) Forecast by Mounting, 2018 to 2033

Table 82: South Asia and Pacific Market Volume (Units) Forecast by Mounting, 2018 to 2033

Table 83: South Asia and Pacific Market Value (US$ Million) Forecast by Application, 2018 to 2033

Table 84: South Asia and Pacific Market Volume (Units) Forecast by Application, 2018 to 2033

Table 85: East Asia Market Value (US$ Million) Forecast by Country, 2018 to 2033

Table 86: East Asia Market Volume (Units) Forecast by Country, 2018 to 2033

Table 87: East Asia Market Value (US$ Million) Forecast by Type, 2018 to 2033

Table 88: East Asia Market Volume (Units) Forecast by Type, 2018 to 2033

Table 89: East Asia Market Value (US$ Million) Forecast by Operation, 2018 to 2033

Table 90: East Asia Market Volume (Units) Forecast by Operation, 2018 to 2033

Table 91: East Asia Market Value (US$ Million) Forecast by Ownership, 2018 to 2033

Table 92: East Asia Market Volume (Units) Forecast by Ownership, 2018 to 2033

Table 93: East Asia Market Value (US$ Million) Forecast by Sub-Type, 2018 to 2033

Table 94: East Asia Market Volume (Units) Forecast by Sub-Type, 2018 to 2033

Table 95: East Asia Market Value (US$ Million) Forecast by Mounting, 2018 to 2033

Table 96: East Asia Market Volume (Units) Forecast by Mounting, 2018 to 2033

Table 97: East Asia Market Value (US$ Million) Forecast by Application, 2018 to 2033

Table 98: East Asia Market Volume (Units) Forecast by Application, 2018 to 2033

Table 99: Middle East and Africa Market Value (US$ Million) Forecast by Country, 2018 to 2033

Table 100: Middle East and Africa Market Volume (Units) Forecast by Country, 2018 to 2033

Table 101: Middle East and Africa Market Value (US$ Million) Forecast by Type, 2018 to 2033

Table 102: Middle East and Africa Market Volume (Units) Forecast by Type, 2018 to 2033

Table 103: Middle East and Africa Market Value (US$ Million) Forecast by Operation, 2018 to 2033

Table 104: Middle East and Africa Market Volume (Units) Forecast by Operation, 2018 to 2033

Table 105: Middle East and Africa Market Value (US$ Million) Forecast by Ownership, 2018 to 2033

Table 106: Middle East and Africa Market Volume (Units) Forecast by Ownership, 2018 to 2033

Table 107: Middle East and Africa Market Value (US$ Million) Forecast by Sub-Type, 2018 to 2033

Table 108: Middle East and Africa Market Volume (Units) Forecast by Sub-Type, 2018 to 2033

Table 109: Middle East and Africa Market Value (US$ Million) Forecast by Mounting, 2018 to 2033

Table 110: Middle East and Africa Market Volume (Units) Forecast by Mounting, 2018 to 2033

Table 111: Middle East and Africa Market Value (US$ Million) Forecast by Application, 2018 to 2033

Table 112: Middle East and Africa Market Volume (Units) Forecast by Application, 2018 to 2033

List of Figures

Figure 1: Global Market Value (US$ Million) by Type, 2023 to 2033

Figure 2: Global Market Value (US$ Million) by Operation, 2023 to 2033

Figure 3: Global Market Value (US$ Million) by Ownership, 2023 to 2033

Figure 4: Global Market Value (US$ Million) by Sub-Type, 2023 to 2033

Figure 5: Global Market Value (US$ Million) by Mounting, 2023 to 2033

Figure 6: Global Market Value (US$ Million) by Application, 2023 to 2033

Figure 7: Global Market Value (US$ Million) by Region, 2023 to 2033

Figure 8: Global Market Value (US$ Million) Analysis by Region, 2018 to 2033

Figure 9: Global Market Volume (Units) Analysis by Region, 2018 to 2033

Figure 10: Global Market Value Share (%) and BPS Analysis by Region, 2023 to 2033

Figure 11: Global Market Y-o-Y Growth (%) Projections by Region, 2023 to 2033

Figure 12: Global Market Value (US$ Million) Analysis by Type, 2018 to 2033

Figure 13: Global Market Volume (Units) Analysis by Type, 2018 to 2033

Figure 14: Global Market Value Share (%) and BPS Analysis by Type, 2023 to 2033

Figure 15: Global Market Y-o-Y Growth (%) Projections by Type, 2023 to 2033

Figure 16: Global Market Value (US$ Million) Analysis by Operation, 2018 to 2033

Figure 17: Global Market Volume (Units) Analysis by Operation, 2018 to 2033

Figure 18: Global Market Value Share (%) and BPS Analysis by Operation, 2023 to 2033

Figure 19: Global Market Y-o-Y Growth (%) Projections by Operation, 2023 to 2033

Figure 20: Global Market Value (US$ Million) Analysis by Ownership, 2018 to 2033

Figure 21: Global Market Volume (Units) Analysis by Ownership, 2018 to 2033

Figure 22: Global Market Value Share (%) and BPS Analysis by Ownership, 2023 to 2033

Figure 23: Global Market Y-o-Y Growth (%) Projections by Ownership, 2023 to 2033

Figure 24: Global Market Value (US$ Million) Analysis by Sub-Type, 2018 to 2033

Figure 25: Global Market Volume (Units) Analysis by Sub-Type, 2018 to 2033

Figure 26: Global Market Value Share (%) and BPS Analysis by Sub-Type, 2023 to 2033

Figure 27: Global Market Y-o-Y Growth (%) Projections by Sub-Type, 2023 to 2033

Figure 28: Global Market Value (US$ Million) Analysis by Mounting, 2018 to 2033

Figure 29: Global Market Volume (Units) Analysis by Mounting, 2018 to 2033

Figure 30: Global Market Value Share (%) and BPS Analysis by Mounting, 2023 to 2033

Figure 31: Global Market Y-o-Y Growth (%) Projections by Mounting, 2023 to 2033

Figure 32: Global Market Value (US$ Million) Analysis by Application, 2018 to 2033

Figure 33: Global Market Volume (Units) Analysis by Application, 2018 to 2033

Figure 34: Global Market Value Share (%) and BPS Analysis by Application, 2023 to 2033

Figure 35: Global Market Y-o-Y Growth (%) Projections by Application, 2023 to 2033

Figure 36: Global Market Attractiveness by Type, 2023 to 2033

Figure 37: Global Market Attractiveness by Operation, 2023 to 2033

Figure 38: Global Market Attractiveness by Ownership, 2023 to 2033

Figure 39: Global Market Attractiveness by Sub-Type, 2023 to 2033

Figure 40: Global Market Attractiveness by Mounting, 2023 to 2033

Figure 41: Global Market Attractiveness by Application, 2023 to 2033

Figure 42: Global Market Attractiveness by Region, 2023 to 2033

Figure 43: North America Market Value (US$ Million) by Type, 2023 to 2033

Figure 44: North America Market Value (US$ Million) by Operation, 2023 to 2033

Figure 45: North America Market Value (US$ Million) by Ownership, 2023 to 2033

Figure 46: North America Market Value (US$ Million) by Sub-Type, 2023 to 2033

Figure 47: North America Market Value (US$ Million) by Mounting, 2023 to 2033

Figure 48: North America Market Value (US$ Million) by Application, 2023 to 2033

Figure 49: North America Market Value (US$ Million) by Country, 2023 to 2033

Figure 50: North America Market Value (US$ Million) Analysis by Country, 2018 to 2033

Figure 51: North America Market Volume (Units) Analysis by Country, 2018 to 2033

Figure 52: North America Market Value Share (%) and BPS Analysis by Country, 2023 to 2033

Figure 53: North America Market Y-o-Y Growth (%) Projections by Country, 2023 to 2033

Figure 54: North America Market Value (US$ Million) Analysis by Type, 2018 to 2033

Figure 55: North America Market Volume (Units) Analysis by Type, 2018 to 2033

Figure 56: North America Market Value Share (%) and BPS Analysis by Type, 2023 to 2033

Figure 57: North America Market Y-o-Y Growth (%) Projections by Type, 2023 to 2033

Figure 58: North America Market Value (US$ Million) Analysis by Operation, 2018 to 2033

Figure 59: North America Market Volume (Units) Analysis by Operation, 2018 to 2033

Figure 60: North America Market Value Share (%) and BPS Analysis by Operation, 2023 to 2033

Figure 61: North America Market Y-o-Y Growth (%) Projections by Operation, 2023 to 2033

Figure 62: North America Market Value (US$ Million) Analysis by Ownership, 2018 to 2033

Figure 63: North America Market Volume (Units) Analysis by Ownership, 2018 to 2033

Figure 64: North America Market Value Share (%) and BPS Analysis by Ownership, 2023 to 2033

Figure 65: North America Market Y-o-Y Growth (%) Projections by Ownership, 2023 to 2033

Figure 66: North America Market Value (US$ Million) Analysis by Sub-Type, 2018 to 2033

Figure 67: North America Market Volume (Units) Analysis by Sub-Type, 2018 to 2033

Figure 68: North America Market Value Share (%) and BPS Analysis by Sub-Type, 2023 to 2033

Figure 69: North America Market Y-o-Y Growth (%) Projections by Sub-Type, 2023 to 2033

Figure 70: North America Market Value (US$ Million) Analysis by Mounting, 2018 to 2033

Figure 71: North America Market Volume (Units) Analysis by Mounting, 2018 to 2033

Figure 72: North America Market Value Share (%) and BPS Analysis by Mounting, 2023 to 2033

Figure 73: North America Market Y-o-Y Growth (%) Projections by Mounting, 2023 to 2033

Figure 74: North America Market Value (US$ Million) Analysis by Application, 2018 to 2033

Figure 75: North America Market Volume (Units) Analysis by Application, 2018 to 2033

Figure 76: North America Market Value Share (%) and BPS Analysis by Application, 2023 to 2033

Figure 77: North America Market Y-o-Y Growth (%) Projections by Application, 2023 to 2033

Figure 78: North America Market Attractiveness by Type, 2023 to 2033

Figure 79: North America Market Attractiveness by Operation, 2023 to 2033

Figure 80: North America Market Attractiveness by Ownership, 2023 to 2033

Figure 81: North America Market Attractiveness by Sub-Type, 2023 to 2033

Figure 82: North America Market Attractiveness by Mounting, 2023 to 2033

Figure 83: North America Market Attractiveness by Application, 2023 to 2033

Figure 84: North America Market Attractiveness by Country, 2023 to 2033

Figure 85: Latin America Market Value (US$ Million) by Type, 2023 to 2033

Figure 86: Latin America Market Value (US$ Million) by Operation, 2023 to 2033

Figure 87: Latin America Market Value (US$ Million) by Ownership, 2023 to 2033

Figure 88: Latin America Market Value (US$ Million) by Sub-Type, 2023 to 2033

Figure 89: Latin America Market Value (US$ Million) by Mounting, 2023 to 2033

Figure 90: Latin America Market Value (US$ Million) by Application, 2023 to 2033

Figure 91: Latin America Market Value (US$ Million) by Country, 2023 to 2033

Figure 92: Latin America Market Value (US$ Million) Analysis by Country, 2018 to 2033

Figure 93: Latin America Market Volume (Units) Analysis by Country, 2018 to 2033

Figure 94: Latin America Market Value Share (%) and BPS Analysis by Country, 2023 to 2033

Figure 95: Latin America Market Y-o-Y Growth (%) Projections by Country, 2023 to 2033

Figure 96: Latin America Market Value (US$ Million) Analysis by Type, 2018 to 2033

Figure 97: Latin America Market Volume (Units) Analysis by Type, 2018 to 2033

Figure 98: Latin America Market Value Share (%) and BPS Analysis by Type, 2023 to 2033

Figure 99: Latin America Market Y-o-Y Growth (%) Projections by Type, 2023 to 2033

Figure 100: Latin America Market Value (US$ Million) Analysis by Operation, 2018 to 2033

Figure 101: Latin America Market Volume (Units) Analysis by Operation, 2018 to 2033

Figure 102: Latin America Market Value Share (%) and BPS Analysis by Operation, 2023 to 2033

Figure 103: Latin America Market Y-o-Y Growth (%) Projections by Operation, 2023 to 2033

Figure 104: Latin America Market Value (US$ Million) Analysis by Ownership, 2018 to 2033

Figure 105: Latin America Market Volume (Units) Analysis by Ownership, 2018 to 2033

Figure 106: Latin America Market Value Share (%) and BPS Analysis by Ownership, 2023 to 2033

Figure 107: Latin America Market Y-o-Y Growth (%) Projections by Ownership, 2023 to 2033

Figure 108: Latin America Market Value (US$ Million) Analysis by Sub-Type, 2018 to 2033

Figure 109: Latin America Market Volume (Units) Analysis by Sub-Type, 2018 to 2033

Figure 110: Latin America Market Value Share (%) and BPS Analysis by Sub-Type, 2023 to 2033

Figure 111: Latin America Market Y-o-Y Growth (%) Projections by Sub-Type, 2023 to 2033

Figure 112: Latin America Market Value (US$ Million) Analysis by Mounting, 2018 to 2033

Figure 113: Latin America Market Volume (Units) Analysis by Mounting, 2018 to 2033

Figure 114: Latin America Market Value Share (%) and BPS Analysis by Mounting, 2023 to 2033

Figure 115: Latin America Market Y-o-Y Growth (%) Projections by Mounting, 2023 to 2033

Figure 116: Latin America Market Value (US$ Million) Analysis by Application, 2018 to 2033

Figure 117: Latin America Market Volume (Units) Analysis by Application, 2018 to 2033

Figure 118: Latin America Market Value Share (%) and BPS Analysis by Application, 2023 to 2033

Figure 119: Latin America Market Y-o-Y Growth (%) Projections by Application, 2023 to 2033

Figure 120: Latin America Market Attractiveness by Type, 2023 to 2033

Figure 121: Latin America Market Attractiveness by Operation, 2023 to 2033

Figure 122: Latin America Market Attractiveness by Ownership, 2023 to 2033

Figure 123: Latin America Market Attractiveness by Sub-Type, 2023 to 2033

Figure 124: Latin America Market Attractiveness by Mounting, 2023 to 2033

Figure 125: Latin America Market Attractiveness by Application, 2023 to 2033

Figure 126: Latin America Market Attractiveness by Country, 2023 to 2033

Figure 127: Western Europe Market Value (US$ Million) by Type, 2023 to 2033

Figure 128: Western Europe Market Value (US$ Million) by Operation, 2023 to 2033

Figure 129: Western Europe Market Value (US$ Million) by Ownership, 2023 to 2033

Figure 130: Western Europe Market Value (US$ Million) by Sub-Type, 2023 to 2033

Figure 131: Western Europe Market Value (US$ Million) by Mounting, 2023 to 2033

Figure 132: Western Europe Market Value (US$ Million) by Application, 2023 to 2033

Figure 133: Western Europe Market Value (US$ Million) by Country, 2023 to 2033

Figure 134: Western Europe Market Value (US$ Million) Analysis by Country, 2018 to 2033

Figure 135: Western Europe Market Volume (Units) Analysis by Country, 2018 to 2033

Figure 136: Western Europe Market Value Share (%) and BPS Analysis by Country, 2023 to 2033

Figure 137: Western Europe Market Y-o-Y Growth (%) Projections by Country, 2023 to 2033

Figure 138: Western Europe Market Value (US$ Million) Analysis by Type, 2018 to 2033

Figure 139: Western Europe Market Volume (Units) Analysis by Type, 2018 to 2033

Figure 140: Western Europe Market Value Share (%) and BPS Analysis by Type, 2023 to 2033

Figure 141: Western Europe Market Y-o-Y Growth (%) Projections by Type, 2023 to 2033

Figure 142: Western Europe Market Value (US$ Million) Analysis by Operation, 2018 to 2033

Figure 143: Western Europe Market Volume (Units) Analysis by Operation, 2018 to 2033

Figure 144: Western Europe Market Value Share (%) and BPS Analysis by Operation, 2023 to 2033

Figure 145: Western Europe Market Y-o-Y Growth (%) Projections by Operation, 2023 to 2033

Figure 146: Western Europe Market Value (US$ Million) Analysis by Ownership, 2018 to 2033

Figure 147: Western Europe Market Volume (Units) Analysis by Ownership, 2018 to 2033

Figure 148: Western Europe Market Value Share (%) and BPS Analysis by Ownership, 2023 to 2033

Figure 149: Western Europe Market Y-o-Y Growth (%) Projections by Ownership, 2023 to 2033

Figure 150: Western Europe Market Value (US$ Million) Analysis by Sub-Type, 2018 to 2033

Figure 151: Western Europe Market Volume (Units) Analysis by Sub-Type, 2018 to 2033

Figure 152: Western Europe Market Value Share (%) and BPS Analysis by Sub-Type, 2023 to 2033

Figure 153: Western Europe Market Y-o-Y Growth (%) Projections by Sub-Type, 2023 to 2033

Figure 154: Western Europe Market Value (US$ Million) Analysis by Mounting, 2018 to 2033

Figure 155: Western Europe Market Volume (Units) Analysis by Mounting, 2018 to 2033

Figure 156: Western Europe Market Value Share (%) and BPS Analysis by Mounting, 2023 to 2033

Figure 157: Western Europe Market Y-o-Y Growth (%) Projections by Mounting, 2023 to 2033

Figure 158: Western Europe Market Value (US$ Million) Analysis by Application, 2018 to 2033

Figure 159: Western Europe Market Volume (Units) Analysis by Application, 2018 to 2033

Figure 160: Western Europe Market Value Share (%) and BPS Analysis by Application, 2023 to 2033

Figure 161: Western Europe Market Y-o-Y Growth (%) Projections by Application, 2023 to 2033

Figure 162: Western Europe Market Attractiveness by Type, 2023 to 2033

Figure 163: Western Europe Market Attractiveness by Operation, 2023 to 2033

Figure 164: Western Europe Market Attractiveness by Ownership, 2023 to 2033

Figure 165: Western Europe Market Attractiveness by Sub-Type, 2023 to 2033

Figure 166: Western Europe Market Attractiveness by Mounting, 2023 to 2033

Figure 167: Western Europe Market Attractiveness by Application, 2023 to 2033

Figure 168: Western Europe Market Attractiveness by Country, 2023 to 2033

Figure 169: Eastern Europe Market Value (US$ Million) by Type, 2023 to 2033

Figure 170: Eastern Europe Market Value (US$ Million) by Operation, 2023 to 2033

Figure 171: Eastern Europe Market Value (US$ Million) by Ownership, 2023 to 2033

Figure 172: Eastern Europe Market Value (US$ Million) by Sub-Type, 2023 to 2033

Figure 173: Eastern Europe Market Value (US$ Million) by Mounting, 2023 to 2033

Figure 174: Eastern Europe Market Value (US$ Million) by Application, 2023 to 2033

Figure 175: Eastern Europe Market Value (US$ Million) by Country, 2023 to 2033

Figure 176: Eastern Europe Market Value (US$ Million) Analysis by Country, 2018 to 2033

Figure 177: Eastern Europe Market Volume (Units) Analysis by Country, 2018 to 2033

Figure 178: Eastern Europe Market Value Share (%) and BPS Analysis by Country, 2023 to 2033

Figure 179: Eastern Europe Market Y-o-Y Growth (%) Projections by Country, 2023 to 2033

Figure 180: Eastern Europe Market Value (US$ Million) Analysis by Type, 2018 to 2033

Figure 181: Eastern Europe Market Volume (Units) Analysis by Type, 2018 to 2033

Figure 182: Eastern Europe Market Value Share (%) and BPS Analysis by Type, 2023 to 2033

Figure 183: Eastern Europe Market Y-o-Y Growth (%) Projections by Type, 2023 to 2033

Figure 184: Eastern Europe Market Value (US$ Million) Analysis by Operation, 2018 to 2033

Figure 185: Eastern Europe Market Volume (Units) Analysis by Operation, 2018 to 2033

Figure 186: Eastern Europe Market Value Share (%) and BPS Analysis by Operation, 2023 to 2033

Figure 187: Eastern Europe Market Y-o-Y Growth (%) Projections by Operation, 2023 to 2033

Figure 188: Eastern Europe Market Value (US$ Million) Analysis by Ownership, 2018 to 2033

Figure 189: Eastern Europe Market Volume (Units) Analysis by Ownership, 2018 to 2033

Figure 190: Eastern Europe Market Value Share (%) and BPS Analysis by Ownership, 2023 to 2033

Figure 191: Eastern Europe Market Y-o-Y Growth (%) Projections by Ownership, 2023 to 2033

Figure 192: Eastern Europe Market Value (US$ Million) Analysis by Sub-Type, 2018 to 2033

Figure 193: Eastern Europe Market Volume (Units) Analysis by Sub-Type, 2018 to 2033

Figure 194: Eastern Europe Market Value Share (%) and BPS Analysis by Sub-Type, 2023 to 2033

Figure 195: Eastern Europe Market Y-o-Y Growth (%) Projections by Sub-Type, 2023 to 2033

Figure 196: Eastern Europe Market Value (US$ Million) Analysis by Mounting, 2018 to 2033

Figure 197: Eastern Europe Market Volume (Units) Analysis by Mounting, 2018 to 2033

Figure 198: Eastern Europe Market Value Share (%) and BPS Analysis by Mounting, 2023 to 2033

Figure 199: Eastern Europe Market Y-o-Y Growth (%) Projections by Mounting, 2023 to 2033

Figure 200: Eastern Europe Market Value (US$ Million) Analysis by Application, 2018 to 2033

Figure 201: Eastern Europe Market Volume (Units) Analysis by Application, 2018 to 2033

Figure 202: Eastern Europe Market Value Share (%) and BPS Analysis by Application, 2023 to 2033

Figure 203: Eastern Europe Market Y-o-Y Growth (%) Projections by Application, 2023 to 2033

Figure 204: Eastern Europe Market Attractiveness by Type, 2023 to 2033

Figure 205: Eastern Europe Market Attractiveness by Operation, 2023 to 2033

Figure 206: Eastern Europe Market Attractiveness by Ownership, 2023 to 2033

Figure 207: Eastern Europe Market Attractiveness by Sub-Type, 2023 to 2033

Figure 208: Eastern Europe Market Attractiveness by Mounting, 2023 to 2033

Figure 209: Eastern Europe Market Attractiveness by Application, 2023 to 2033

Figure 210: Eastern Europe Market Attractiveness by Country, 2023 to 2033

Figure 211: South Asia and Pacific Market Value (US$ Million) by Type, 2023 to 2033

Figure 212: South Asia and Pacific Market Value (US$ Million) by Operation, 2023 to 2033

Figure 213: South Asia and Pacific Market Value (US$ Million) by Ownership, 2023 to 2033

Figure 214: South Asia and Pacific Market Value (US$ Million) by Sub-Type, 2023 to 2033

Figure 215: South Asia and Pacific Market Value (US$ Million) by Mounting, 2023 to 2033

Figure 216: South Asia and Pacific Market Value (US$ Million) by Application, 2023 to 2033

Figure 217: South Asia and Pacific Market Value (US$ Million) by Country, 2023 to 2033

Figure 218: South Asia and Pacific Market Value (US$ Million) Analysis by Country, 2018 to 2033

Figure 219: South Asia and Pacific Market Volume (Units) Analysis by Country, 2018 to 2033

Figure 220: South Asia and Pacific Market Value Share (%) and BPS Analysis by Country, 2023 to 2033

Figure 221: South Asia and Pacific Market Y-o-Y Growth (%) Projections by Country, 2023 to 2033

Figure 222: South Asia and Pacific Market Value (US$ Million) Analysis by Type, 2018 to 2033

Figure 223: South Asia and Pacific Market Volume (Units) Analysis by Type, 2018 to 2033

Figure 224: South Asia and Pacific Market Value Share (%) and BPS Analysis by Type, 2023 to 2033

Figure 225: South Asia and Pacific Market Y-o-Y Growth (%) Projections by Type, 2023 to 2033

Figure 226: South Asia and Pacific Market Value (US$ Million) Analysis by Operation, 2018 to 2033

Figure 227: South Asia and Pacific Market Volume (Units) Analysis by Operation, 2018 to 2033

Figure 228: South Asia and Pacific Market Value Share (%) and BPS Analysis by Operation, 2023 to 2033

Figure 229: South Asia and Pacific Market Y-o-Y Growth (%) Projections by Operation, 2023 to 2033

Figure 230: South Asia and Pacific Market Value (US$ Million) Analysis by Ownership, 2018 to 2033

Figure 231: South Asia and Pacific Market Volume (Units) Analysis by Ownership, 2018 to 2033

Figure 232: South Asia and Pacific Market Value Share (%) and BPS Analysis by Ownership, 2023 to 2033

Figure 233: South Asia and Pacific Market Y-o-Y Growth (%) Projections by Ownership, 2023 to 2033

Figure 234: South Asia and Pacific Market Value (US$ Million) Analysis by Sub-Type, 2018 to 2033

Figure 235: South Asia and Pacific Market Volume (Units) Analysis by Sub-Type, 2018 to 2033

Figure 236: South Asia and Pacific Market Value Share (%) and BPS Analysis by Sub-Type, 2023 to 2033

Figure 237: South Asia and Pacific Market Y-o-Y Growth (%) Projections by Sub-Type, 2023 to 2033

Figure 238: South Asia and Pacific Market Value (US$ Million) Analysis by Mounting, 2018 to 2033

Figure 239: South Asia and Pacific Market Volume (Units) Analysis by Mounting, 2018 to 2033

Figure 240: South Asia and Pacific Market Value Share (%) and BPS Analysis by Mounting, 2023 to 2033

Figure 241: South Asia and Pacific Market Y-o-Y Growth (%) Projections by Mounting, 2023 to 2033

Figure 242: South Asia and Pacific Market Value (US$ Million) Analysis by Application, 2018 to 2033

Figure 243: South Asia and Pacific Market Volume (Units) Analysis by Application, 2018 to 2033

Figure 244: South Asia and Pacific Market Value Share (%) and BPS Analysis by Application, 2023 to 2033

Figure 245: South Asia and Pacific Market Y-o-Y Growth (%) Projections by Application, 2023 to 2033

Figure 246: South Asia and Pacific Market Attractiveness by Type, 2023 to 2033

Figure 247: South Asia and Pacific Market Attractiveness by Operation, 2023 to 2033

Figure 248: South Asia and Pacific Market Attractiveness by Ownership, 2023 to 2033

Figure 249: South Asia and Pacific Market Attractiveness by Sub-Type, 2023 to 2033

Figure 250: South Asia and Pacific Market Attractiveness by Mounting, 2023 to 2033

Figure 251: South Asia and Pacific Market Attractiveness by Application, 2023 to 2033

Figure 252: South Asia and Pacific Market Attractiveness by Country, 2023 to 2033

Figure 253: East Asia Market Value (US$ Million) by Type, 2023 to 2033

Figure 254: East Asia Market Value (US$ Million) by Operation, 2023 to 2033

Figure 255: East Asia Market Value (US$ Million) by Ownership, 2023 to 2033

Figure 256: East Asia Market Value (US$ Million) by Sub-Type, 2023 to 2033

Figure 257: East Asia Market Value (US$ Million) by Mounting, 2023 to 2033

Figure 258: East Asia Market Value (US$ Million) by Application, 2023 to 2033

Figure 259: East Asia Market Value (US$ Million) by Country, 2023 to 2033

Figure 260: East Asia Market Value (US$ Million) Analysis by Country, 2018 to 2033

Figure 261: East Asia Market Volume (Units) Analysis by Country, 2018 to 2033

Figure 262: East Asia Market Value Share (%) and BPS Analysis by Country, 2023 to 2033

Figure 263: East Asia Market Y-o-Y Growth (%) Projections by Country, 2023 to 2033

Figure 264: East Asia Market Value (US$ Million) Analysis by Type, 2018 to 2033

Figure 265: East Asia Market Volume (Units) Analysis by Type, 2018 to 2033

Figure 266: East Asia Market Value Share (%) and BPS Analysis by Type, 2023 to 2033

Figure 267: East Asia Market Y-o-Y Growth (%) Projections by Type, 2023 to 2033

Figure 268: East Asia Market Value (US$ Million) Analysis by Operation, 2018 to 2033

Figure 269: East Asia Market Volume (Units) Analysis by Operation, 2018 to 2033

Figure 270: East Asia Market Value Share (%) and BPS Analysis by Operation, 2023 to 2033

Figure 271: East Asia Market Y-o-Y Growth (%) Projections by Operation, 2023 to 2033

Figure 272: East Asia Market Value (US$ Million) Analysis by Ownership, 2018 to 2033

Figure 273: East Asia Market Volume (Units) Analysis by Ownership, 2018 to 2033

Figure 274: East Asia Market Value Share (%) and BPS Analysis by Ownership, 2023 to 2033

Figure 275: East Asia Market Y-o-Y Growth (%) Projections by Ownership, 2023 to 2033

Figure 276: East Asia Market Value (US$ Million) Analysis by Sub-Type, 2018 to 2033

Figure 277: East Asia Market Volume (Units) Analysis by Sub-Type, 2018 to 2033

Figure 278: East Asia Market Value Share (%) and BPS Analysis by Sub-Type, 2023 to 2033

Figure 279: East Asia Market Y-o-Y Growth (%) Projections by Sub-Type, 2023 to 2033

Figure 280: East Asia Market Value (US$ Million) Analysis by Mounting, 2018 to 2033

Figure 281: East Asia Market Volume (Units) Analysis by Mounting, 2018 to 2033

Figure 282: East Asia Market Value Share (%) and BPS Analysis by Mounting, 2023 to 2033

Figure 283: East Asia Market Y-o-Y Growth (%) Projections by Mounting, 2023 to 2033

Figure 284: East Asia Market Value (US$ Million) Analysis by Application, 2018 to 2033

Figure 285: East Asia Market Volume (Units) Analysis by Application, 2018 to 2033

Figure 286: East Asia Market Value Share (%) and BPS Analysis by Application, 2023 to 2033

Figure 287: East Asia Market Y-o-Y Growth (%) Projections by Application, 2023 to 2033

Figure 288: East Asia Market Attractiveness by Type, 2023 to 2033

Figure 289: East Asia Market Attractiveness by Operation, 2023 to 2033

Figure 290: East Asia Market Attractiveness by Ownership, 2023 to 2033

Figure 291: East Asia Market Attractiveness by Sub-Type, 2023 to 2033

Figure 292: East Asia Market Attractiveness by Mounting, 2023 to 2033

Figure 293: East Asia Market Attractiveness by Application, 2023 to 2033

Figure 294: East Asia Market Attractiveness by Country, 2023 to 2033

Figure 295: Middle East and Africa Market Value (US$ Million) by Type, 2023 to 2033

Figure 296: Middle East and Africa Market Value (US$ Million) by Operation, 2023 to 2033

Figure 297: Middle East and Africa Market Value (US$ Million) by Ownership, 2023 to 2033

Figure 298: Middle East and Africa Market Value (US$ Million) by Sub-Type, 2023 to 2033

Figure 299: Middle East and Africa Market Value (US$ Million) by Mounting, 2023 to 2033

Figure 300: Middle East and Africa Market Value (US$ Million) by Application, 2023 to 2033

Figure 301: Middle East and Africa Market Value (US$ Million) by Country, 2023 to 2033

Figure 302: Middle East and Africa Market Value (US$ Million) Analysis by Country, 2018 to 2033

Figure 303: Middle East and Africa Market Volume (Units) Analysis by Country, 2018 to 2033

Figure 304: Middle East and Africa Market Value Share (%) and BPS Analysis by Country, 2023 to 2033

Figure 305: Middle East and Africa Market Y-o-Y Growth (%) Projections by Country, 2023 to 2033

Figure 306: Middle East and Africa Market Value (US$ Million) Analysis by Type, 2018 to 2033

Figure 307: Middle East and Africa Market Volume (Units) Analysis by Type, 2018 to 2033

Figure 308: Middle East and Africa Market Value Share (%) and BPS Analysis by Type, 2023 to 2033

Figure 309: Middle East and Africa Market Y-o-Y Growth (%) Projections by Type, 2023 to 2033

Figure 310: Middle East and Africa Market Value (US$ Million) Analysis by Operation, 2018 to 2033

Figure 311: Middle East and Africa Market Volume (Units) Analysis by Operation, 2018 to 2033

Figure 312: Middle East and Africa Market Value Share (%) and BPS Analysis by Operation, 2023 to 2033

Figure 313: Middle East and Africa Market Y-o-Y Growth (%) Projections by Operation, 2023 to 2033

Figure 314: Middle East and Africa Market Value (US$ Million) Analysis by Ownership, 2018 to 2033

Figure 315: Middle East and Africa Market Volume (Units) Analysis by Ownership, 2018 to 2033

Figure 316: Middle East and Africa Market Value Share (%) and BPS Analysis by Ownership, 2023 to 2033

Figure 317: Middle East and Africa Market Y-o-Y Growth (%) Projections by Ownership, 2023 to 2033

Figure 318: Middle East and Africa Market Value (US$ Million) Analysis by Sub-Type, 2018 to 2033

Figure 319: Middle East and Africa Market Volume (Units) Analysis by Sub-Type, 2018 to 2033

Figure 320: Middle East and Africa Market Value Share (%) and BPS Analysis by Sub-Type, 2023 to 2033

Figure 321: Middle East and Africa Market Y-o-Y Growth (%) Projections by Sub-Type, 2023 to 2033

Figure 322: Middle East and Africa Market Value (US$ Million) Analysis by Mounting, 2018 to 2033

Figure 323: Middle East and Africa Market Volume (Units) Analysis by Mounting, 2018 to 2033

Figure 324: Middle East and Africa Market Value Share (%) and BPS Analysis by Mounting, 2023 to 2033

Figure 325: Middle East and Africa Market Y-o-Y Growth (%) Projections by Mounting, 2023 to 2033

Figure 326: Middle East and Africa Market Value (US$ Million) Analysis by Application, 2018 to 2033

Figure 327: Middle East and Africa Market Volume (Units) Analysis by Application, 2018 to 2033

Figure 328: Middle East and Africa Market Value Share (%) and BPS Analysis by Application, 2023 to 2033

Figure 329: Middle East and Africa Market Y-o-Y Growth (%) Projections by Application, 2023 to 2033

Figure 330: Middle East and Africa Market Attractiveness by Type, 2023 to 2033

Figure 331: Middle East and Africa Market Attractiveness by Operation, 2023 to 2033

Figure 332: Middle East and Africa Market Attractiveness by Ownership, 2023 to 2033

Figure 333: Middle East and Africa Market Attractiveness by Sub-Type, 2023 to 2033

Figure 334: Middle East and Africa Market Attractiveness by Mounting, 2023 to 2033

Figure 335: Middle East and Africa Market Attractiveness by Application, 2023 to 2033

Figure 336: Middle East and Africa Market Attractiveness by Country, 2023 to 2033

Frequently Asked Questions

What is the estimated market size of the global trash rack cleaning machine market for 2025?

The global trash rack cleaning machine market is projected to reach USD 424.2 million by the end of 2025.

At what rate is the market expected to grow during the forecast period?

The market is anticipated to grow at a CAGR of 4.1% over the forecast period.

What is the projected market worth by 2035?

By 2035, the trash rack cleaning machine market is expected to reach USD 633.9 million.

Which segment is expected to dominate the market?

The hydropower plants segment is expected to dominate the market due to the increasing need for efficient debris removal systems that enhance plant performance and prevent operational disruptions.

Who are the key players in the trash rack cleaning machine market?

Key players in the trash rack cleaning machine market include Landustrie Sneek BV, Fontaine Aquanox, ANDRITZ Hydro GmbH, HRC Power Solutions

Explore Manufacturing Equipment Insights

Future Market Insights

Trash Rack Cleaning Machine Market