Trim Tabs Market Size and Share Forecast Outlook 2025 to 2035

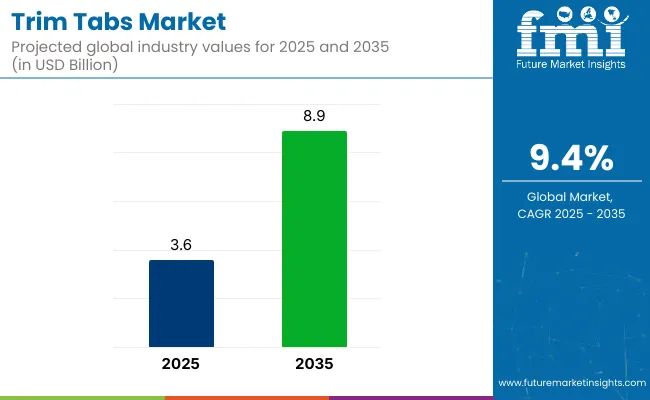
The global trim tabs market is expected to grow from USD 3.6 billion in 2025 to USD 8.9 billion by 2035, reflecting a CAGR of 9.4%. This growth is driven by the increasing demand for trim tabs in the marine, automotive, and aerospace industries.
Quick Stats for Trim Tabs Market

  • Market Value (2025): USD 3.6 billion
  • Forecast Value (2035): USD 8.9 billion
  • Forecast CAGR: 9.4%
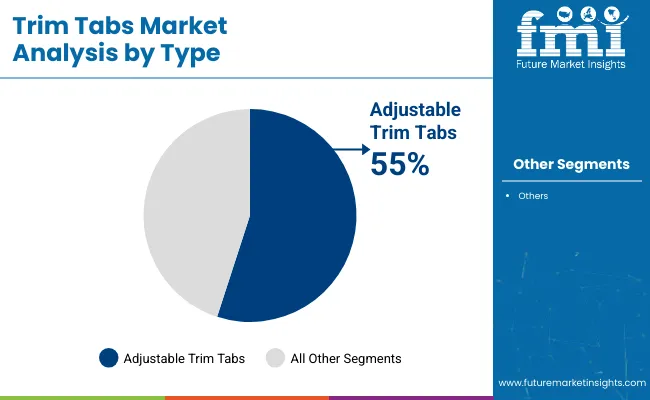
  • Type Leader in 2025: Adjustable Trim Tabs (55% market share)
  • Top End User Segment:Commercial (42% share)
  • Key Growth Region: Western Europe (UK is the fastest-growing market with an 8.5% CAGR)

Trim Tabs Market

Metric Value
Industry Size (2025E) USD 3.6 billion
Industry Value (2035F) USD 8.9 billion
CAGR (2025 to 2035) 9.4%

The rising popularity of high-performance boats, yachts, and other watercrafts, along with advancements in trim tab technologies, such as improved materials for better durability and enhanced fuel efficiency, are contributing to market expansion. Additionally, the growing focus on optimizing vehicle stability and reducing drag is further fueling the demand for trim tabs, especially in the recreational and commercial marine sectors.

Innovation in this market is primarily focused on enhancing performance, durability, and efficiency. Manufacturers are developing trim tabs with advanced materials, such as corrosion-resistant alloys and carbon composites, to improve longevity and reduce weight.

Additionally, innovations in automation and digital control systems allow for more precise adjustments, enhancing stability and fuel efficiency in various vehicles, particularly in marine and aerospace applications. These innovations aim to provide smoother rides, better fuel consumption, and increased control in challenging environments, meeting the growing demands of both recreational and commercial sectors.

Trim tabs hold approximately 20% to 25% share in the marine control systems market, as they play a critical role in optimizing vessel trim and stability. In the boat accessories market, they account for around 10% to 15%, being widely used in both OEM and aftermarket applications.

Within the broader marine equipment market, their share is about 5% to 7%, given the inclusion of engines, electronics, and structural components. In the recreational boating market, trim tabs represent 4% to 6%, especially in speedboats and personal crafts. Their share in the commercial marine vessels market is lower, at 2% to 3%, due to limited applicability.

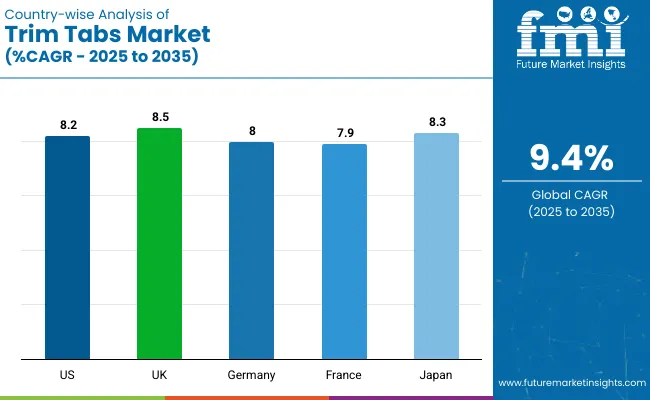
The UK is expected to be the fastest-growing market for trim tabs, with a projected CAGR of 8.5%. Adjustable trim tabs will dominate the type segment, holding 55% of the market share by 2025. The marine application segment will lead with a 55% share. The USA and Germany are also expected to experience notable growth, with projected CAGRs of 8.2% and 8%, respectively.

Analyzing Trim Tabs Market by Top Investment Segments

The trim tabs market is segmented into type, control type, end users, application, and region. By type, the market is bifurcated into fixed trim tabs and adjustable trim tabs. In terms of control type, the market is categorized into mechanical, electrical, and hydraulic. Based on end users, the market is segmented into personal, commercial, military, and sports.

By application, the market is bifurcated into aviation and marine. Regionally, the market is classified into North America, Latin America, Western Europe, Eastern Europe, East Asia, South Asia Pacific, and the Middle East & Africa.

Adjustable Trim Tabs to Lead the Type Segment with 55% Market Share

Adjustable trim tabs are expected to capture 55% of the market share by 2025. These trim tabs offer increased flexibility, allowing users to modify trim based on specific conditions, leading to improved vessel performance.
  • Adjustable trim tabs are highly valued for their versatility, providing superior control in varying sea conditions.
  • They are particularly popular in recreational and commercial marine applications, where customizability for different load conditions is crucial.

Trim Tabs Market Analysis By Type

Hydraulic Control Trim Tabs to Lead the Control Type Segment with 42% Market Share

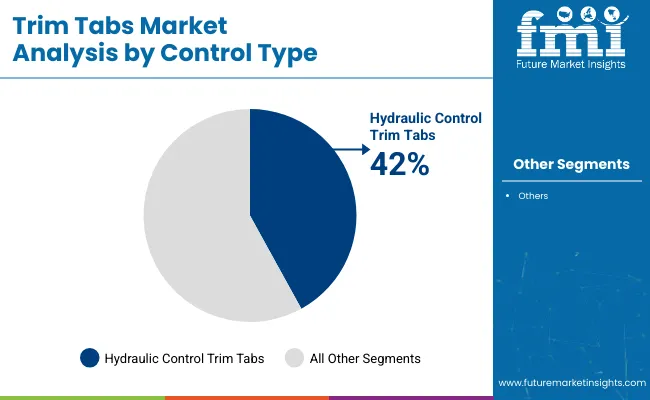
Hydraulic trim tabs are projected to dominate the control type segment, accounting for 42% of the global market share by 2025. Hydraulic systems are known for their efficiency, precise control, and ability to handle heavy loads.
  • They are highly preferred in large vessels, particularly in the marine and commercial sectors, where high performance and reliability are crucial.
  • Hydraulic systems enable smooth and responsive control, improving vessel performance in various sea conditions.

Trim Tabs Market Analysis By Control Type

Commercial to Lead the End User Segment with 42% Market Share

The commercial end user segment is projected to account for 42% of the trim tabs market by 2025. These trim tabs are widely adopted in cargo vessels, ferries, and utility boats to optimize stability and efficiency during continuous marine operations.

  • Commercial trim tabs are engineered for heavy-duty use, delivering consistent performance in long-haul and high-load scenarios.
  • Demand is fueled by the need for fuel efficiency and enhanced safety across coastal and offshore commercial fleets.

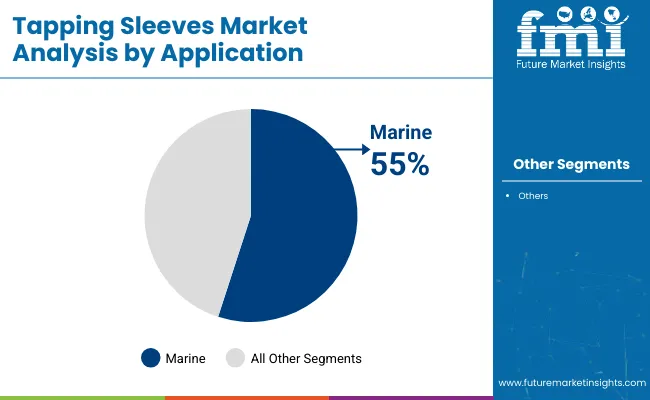
Marine to Lead the Application Segment with 55% Market Share

The marine application segment is expected to lead the global market, securing 55% of the market share by 2025. Trim tabs are integral in ensuring the stability and performance of vessels in the marine industry.
  • They are critical in enhancing the hydrodynamic efficiency of boats and ships, improving fuel economy and handling.
  • The increasing popularity of recreational boating and commercial maritime transportation is significantly boosting demand for marine trim tabs.

Trim Tabs Market Analysis By Application

Top Trim Tabs Market Dynamics

The global trim tabs market is experiencing steady growth, driven by the increasing demand for enhanced stability, fuel efficiency, and performance in marine, aviation, and automotive applications. Trim tabs play a vital role in optimizing vehicle handling, reducing drag, and improving fuel consumption.

Recent Trends in the Trim Tabs Market

  • The demand for adjustable trim tabs is rising, especially in the marine and aerospace sectors, as they offer greater control and customization for various operational conditions.
  • Advancements in materials and automation technology are improving the durability and performance of trim tabs, leading to their increased adoption in commercial and recreational vessels.

Challenges in the Trim Tabs Market

  • High installation and maintenance costs of advanced trim tab systems, particularly hydraulic and electric models, are limiting their widespread adoption in cost-sensitive markets.
  • The need for specialized knowledge and technical expertise to install and calibrate trim tabs presents a barrier, especially for smaller marine operators and recreational users.

Analyzing Top Countries Manufacturing and Distributing Trim Tabs

Country Wise Analysis Of Trim Tabs Market Cagr 2025 To 2035

The UK leads the trim tabs market with the highest projected CAGR of 8.5% from 2025 to 2035, driven by strong marine sector activity and sustainability focus. Japan follows at 8.3%, supported by precision demand in automotive and electronics. The USA is close behind with an 8.2% CAGR, fueled by marine and automotive innovation and green policies.

Germany sees an 8.0% CAGR, reflecting its engineering strength and robust automotive base. France records the slowest growth among the five at 7.9%, still benefiting from its marine tourism and vehicle efficiency efforts. Overall, advanced manufacturing and green tech adoption are key market drivers.

The report covers in-depth analysis of 40+ countries; five top-performing OECD countries are highlighted below.

USA Trim Tabs Market Analysis

The sales of trim tabs in the USA are expected to grow at a CAGR of 8.2% from 2025 to 2035. This growth is driven by strong demand from the marine and automotive sectors.

  • Strong demand for high-performance marine vessels and boats.
  • Increasing adoption of fuel-efficient technologies in the automotive and marine industries.
  • Government initiatives supporting advancements in vehicle technologies and sustainability efforts in marine applications.

Trim Tabs Sales Analysis in the UK

The UK trim tabs revenue is projected to grow at a CAGR of 8.5% from 2025 to 2035, supported by the country’s strong presence in the marine and aerospace sectors.

  • Rising demand for trim tabs in marine vessels and recreational boating.
  • Government support for the marine industry and emphasis on fuel-efficient solutions.
  • Strong focus on sustainability and fuel economy in both recreational and commercial sectors.

Germany Trim Tabs Market Analysis

Germany’s trim tabs demand is projected to grow at a CAGR of 8% from 2025 to 2035, driven by the country’s leadership in automotive and marine manufacturing.

  • High demand for trim tabs in commercial marine and automotive applications.
  • Germany’s emphasis on precision engineering and technological advancements in vehicle performance.
  • Strong presence of major automotive manufacturers driving innovation and demand for trim tabs in advanced vehicles.

Trim Tabs Demand Analysis in France

The French trim tabs market is expected to grow at a CAGR of 7.9% from 2025 to 2035, driven by the country's robust marine and automotive industries.

  • Increasing demand for trim tabs in commercial and recreational boats.
  • Government investments in the development of fuel-efficient and high-performance vehicles.
  • Rising focus on marine performance and optimization in the tourism and transportation sectors.

Japan Trim Tabs Market Analysis

Japan's trim tabs revenue is expected to grow at a CAGR of 8.3% from 2025 to 2035, driven by the demand for advanced precision testing tools in the automotive, consumer electronics, and telecommunications sectors.

  • Strong market presence of Japanese companies like Panasonic and Toshiba.
  • Government support for technological advancements in automotive and electronics sectors.
  • Rising demand for high-precision trim tabs in testing and quality control processes across industries.

Leading Trim Tabs Suppliers and Manufacturers

The trim tabs market is moderately consolidated, with leading players such as Volvo Penta, Bennett Marine Inc., Linear Devices Corporation (Lectrotab), Lenco Marine, and Aviat Aircraft, Inc. These companies dominate by offering advanced and high-performance trim tab solutions tailored to marine, automotive, and aviation applications.

For instance, Volvo Penta provides high-performance marine trim tabs designed to enhance stability and fuel efficiency in recreational and commercial vessels, while Bennett Marine Inc. is known for its versatile adjustable and fixed trim tabs for precise control in boating applications.

Linear Devices Corporation (Lectrotab) leads with electric and hydraulic systems ideal for a variety of boating needs, and Lenco Marine specializes in electric trim tabs that deliver responsive, smooth performance. Aviat Aircraft, Inc. offers specialized trim tab systems designed to improve aircraft stability and performance in the aviation sector.

Recent Trim Tabs Industry News

  • In March 2025, Yamaha Marine Systems Company, Inc., a subsidiary of Yamaha Motor Corporation, USA, acquired Bennett Marine, Inc. Bennett Marine will continue operations under the Yamaha Marine Group.
  • In July 2024, Aviat Networks, Inc. announced its acquisition of 4RF Limited, a leader in industrial wireless access solutions. 4RF specializes in narrowband radios, Private LTE, and 5G routers for critical infrastructure applications.

Trim Tabs Market Report Scope

Report Attributes Details
Market Size (2025) USD 3.6 billion
Projected Market Size (2035) USD 8.9 billion
CAGR (2025 to 2035) 9.4%
Base Year for Estimation 2024
Historical Period 2020 to 2024
Projections Period 2025 to 2035
Report Parameter USD billion for value/Volume in million units
Type Analyzed Fixed Trim Tabs, and Adjustable Trim Tabs
Control Type Analyzed Mechanical, Electrical, and Hydraulic
End Use rs Analyzed Personal, Commercial, Military, and Sports
Application Analyzed Aviation and Marine
Regions Covered North America, Latin America, Western Europe, Eastern Europe, East Asia, South Asia Pacific, Middle East & Africa
Countries Covered United States, Canada, United Kingdom, Germany, France, China, Japan, South Korea, Brazil, Australia
Key Players Influencing the Market Volvo Penta , Bennett Marine Inc., Linear Devices Corporation (Lectrotab), Lenco Marine, Aviat Aircraft, Inc., Trim Master Marine, Inc., McFarlane Aviation, Inc., Textron Aviation, LORD Corp., Livorsi Marine Inc.
Additional Attributes Dollar sales growth by product type, regional demand trends, competitive landscape, technological innovations

Key Segmentation

By Type:

  • Fixed Trim Tabs
  • Adjustable Trim Tabs

By Control Type:

  • Mechanical
  • Electrical
  • Hydraulic

By End Users:

  • Personal
  • Commercial
  • Military
  • Sports

By Application:

  • Aviation
  • Marine

By Region:

  • North America
  • Latin America
  • Western Europe
  • Eastern Europe
  • East Asia
  • South Asia Pacific
  • Middle East and Africa

Table of Content

  1. Executive Summary
    • Global Market Outlook
    • Demand-side Trends
    • Supply-side Trends
    • Technology Roadmap Analysis
    • Analysis and Recommendations
  2. Market Overview
    • Market Coverage / Taxonomy
    • Market Definition / Scope / Limitations
  3. Market Background
    • Market Dynamics
      • Drivers
      • Restraints
      • Opportunity
      • Trends
    • Scenario Forecast
      • Demand in Optimistic Scenario
      • Demand in Likely Scenario
      • Demand in Conservative Scenario
    • Opportunity Map Analysis
    • Product Life Cycle Analysis
    • Supply Chain Analysis
      • Supply Side Participants and their Roles
        • Producers
        • Mid-Level Participants (Traders/ Agents/ Brokers)
        • Wholesalers and Distributors
      • Value Added and Value Created at Node in the Supply Chain
      • List of Raw Material Suppliers
      • List of Existing and Potential Buyer’s
    • Investment Feasibility Matrix
    • Value Chain Analysis
      • Profit Margin Analysis
      • Wholesalers and Distributors
      • Retailers
    • PESTLE and Porter’s Analysis
    • Regulatory Landscape
      • By Key Regions
      • By Key Countries
    • Regional Parent Market Outlook
    • Production and Consumption Statistics
    • Import and Export Statistics
  4. Global Market Analysis 2020 to 2024 and Forecast, 2025 to 2035
    • Historical Market Size Value (USD Billion) & Volume (Million Units) Analysis, 2020 to 2024
    • Current and Future Market Size Value (USD Billion) & Volume (Million Units) Projections, 2025 to 2035
      • Y-o-Y Growth Trend Analysis
      • Absolute $ Opportunity Analysis
  5. Global Market Pricing Analysis 2020 to 2024 and Forecast 2025 to 2035
  6. Global Market Analysis 2020 to 2024 and Forecast 2025 to 2035, By Type
    • Introduction / Key Findings
    • Historical Market Size Value (USD Billion) & Volume (Million Units) Analysis By Type, 2020 to 2024
    • Current and Future Market Size Value (USD Billion) & Volume (Million Units) Analysis and Forecast By Type, 2025 to 2035
      • Fixed Trim Tabs
      • Adjustable Trim Tabs
    • Y-o-Y Growth Trend Analysis By Type, 2020 to 2024
    • Absolute $ Opportunity Analysis By Type, 2025 to 2035
  7. Global Market Analysis 2020 to 2024 and Forecast 2025 to 2035, By Control Type
    • Introduction / Key Findings
    • Historical Market Size Value (USD Billion) & Volume (Million Units) Analysis By Control Type, 2020 to 2024
    • Current and Future Market Size Value (USD Billion) & Volume (Million Units) Analysis and Forecast By Control Type, 2025 to 2035
      • Mechanical
      • Electrical
      • Hydraulic
    • Y-o-Y Growth Trend Analysis By Control Type, 2020 to 2024
    • Absolute $ Opportunity Analysis By Control Type, 2025 to 2035
  8. Global Market Analysis 2020 to 2024 and Forecast 2025 to 2035, By End Users
    • Introduction / Key Findings
    • Historical Market Size Value (USD Billion) & Volume (Million Units) Analysis By End Users, 2020 to 2024
    • Current and Future Market Size Value (USD Billion) & Volume (Million Units) Analysis and Forecast By End Users, 2025 to 2035
      • Personal
      • Commercial
      • Military
      • Sports
    • Y-o-Y Growth Trend Analysis By End Users, 2020 to 2024
    • Absolute $ Opportunity Analysis By End Users, 2025 to 2035
  9. Global Market Analysis 2020 to 2024 and Forecast 2025 to 2035, By Application
    • Introduction / Key Findings
    • Historical Market Size Value (USD Billion) & Volume (Million Units) Analysis By Application, 2020 to 2024
    • Current and Future Market Size Value (USD Billion) & Volume (Million Units) Analysis and Forecast By Application, 2025 to 2035
      • Aviation
      • Marine
    • Y-o-Y Growth Trend Analysis By Application, 2020 to 2024
    • Absolute $ Opportunity Analysis By Application, 2025 to 2035
  10. Global Market Analysis 2020 to 2024 and Forecast 2025 to 2035, By Region
    • Introduction
    • Historical Market Size Value (USD Billion) & Volume (Million Units) Analysis By Region, 2020 to 2024
    • Current Market Size Value (USD Billion) & Volume (Million Units) Analysis and Forecast By Region, 2025 to 2035
      • North America
      • Latin America
      • Western Europe
      • Eastern Europe
      • East Asia
      • South Asia & Pacific
      • Middle East and Africa
    • Market Attractiveness Analysis By Region
  11. North America Market Analysis 2020 to 2024 and Forecast 2025 to 2035, By Country
    • Historical Market Size Value (USD Billion) & Volume (Million Units) Trend Analysis By Market Taxonomy, 2020 to 2024
    • Market Size Value (USD Billion) & Volume (Million Units) Forecast By Market Taxonomy, 2025 to 2035
      • By Country
        • USA
        • Canada
        • Mexico
      • By Type
      • By Control Type
      • By End Users
      • By Application
    • Market Attractiveness Analysis
      • By Country
      • By Type
      • By Control Type
      • By End Users
      • By Application
    • Key Takeaways
  12. Latin America Market Analysis 2020 to 2024 and Forecast 2025 to 2035, By Country
    • Historical Market Size Value (USD Billion) & Volume (Million Units) Trend Analysis By Market Taxonomy, 2020 to 2024
    • Market Size Value (USD Billion) & Volume (Million Units) Forecast By Market Taxonomy, 2025 to 2035
      • By Country
        • Brazil
        • Argentina
        • Rest of LATAM
      • By Type
      • By Control Type
      • By End Users
      • By Application
    • Market Attractiveness Analysis
      • By Country
      • By Type
      • By Control Type
      • By End Users
      • By Application
    • Key Takeaways
  13. Western Europe Market Analysis 2020 to 2024 and Forecast 2025 to 2035, By Country
    • Historical Market Size Value (USD Billion) & Volume (Million Units) Trend Analysis By Market Taxonomy, 2020 to 2024
    • Market Size Value (USD Billion) & Volume (Million Units) Forecast By Market Taxonomy, 2025 to 2035
      • By Country
        • Germany
        • Italy
        • France
        • UK
        • Spain
        • BENELUX
        • Nordic
        • Rest of W.Europe
      • By Type
      • By Control Type
      • By End Users
      • By Application
    • Market Attractiveness Analysis
      • By Country
      • By Type
      • By Control Type
      • By End Users
      • By Application
    • Key Takeaways
  14. Eastern Europe Market Analysis 2020 to 2024 and Forecast 2025 to 2035, By Country
    • Historical Market Size Value (USD Billion) & Volume (Million Units) Trend Analysis By Market Taxonomy, 2020 to 2024
    • Market Size Value (USD Billion) & Volume (Million Units) Forecast By Market Taxonomy, 2025 to 2035
      • By Country
        • Russia
        • Hungary
        • Poland
        • Balkan & Baltics
        • Rest of E. Europe
      • By Type
      • By Control Type
      • By End Users
      • By Application
    • Market Attractiveness Analysis
      • By Country
      • By Type
      • By Control Type
      • By End Users
      • By Application
    • Key Takeaways
  15. East Asia Market Analysis 2020 to 2024 and Forecast 2025 to 2035, By Country
    • Historical Market Size Value (USD Billion) & Volume (Million Units) Trend Analysis By Market Taxonomy, 2020 to 2024
    • Market Size Value (USD Billion) & Volume (Million Units) Forecast By Market Taxonomy, 2025 to 2035
      • By Country
        • China
        • Japan
        • South Korea
      • By Type
      • By Control Type
      • By End Users
      • By Application
    • Market Attractiveness Analysis
      • By Country
      • By Type
      • By Control Type
      • By End Users
      • By Application
    • Key Takeaways
  16. South Asia & Pacific Market Analysis 2020 to 2024 and Forecast 2025 to 2035, By Country
    • Historical Market Size Value (USD Billion) & Volume (Million Units) Trend Analysis By Market Taxonomy, 2020 to 2024
    • Market Size Value (USD Billion) & Volume (Million Units) Forecast By Market Taxonomy, 2025 to 2035
      • By Country
        • India
        • Australia & New Zealand
        • ASEAN
        • Rest of SAP
      • By Type
      • By Control Type
      • By End Users
      • By Application
    • Market Attractiveness Analysis
      • By Country
      • By Type
      • By Control Type
      • By End Users
      • By Application
    • Key Takeaways
  17. Middle East and Africa Market Analysis 2020 to 2024 and Forecast 2025 to 2035, By Country
    • Historical Market Size Value (USD Billion) & Volume (Million Units) Trend Analysis By Market Taxonomy, 2020 to 2024
    • Market Size Value (USD Billion) & Volume (Million Units) Forecast By Market Taxonomy, 2025 to 2035
      • By Country
        • GCC Countries
        • Northern Africa
        • South Africa
        • Turkiye
        • Rest of MEA
      • By Type
      • By Control Type
      • By End Users
      • By Application
    • Market Attractiveness Analysis
      • By Country
      • By Type
      • By Control Type
      • By End Users
      • By Application
    • Key Takeaways
  18. Key Countries Market Analysis
    • USA
      • Pricing Analysis
      • Market Share Analysis, 2024
        • By Type
        • By Control Type
        • By End Users
        • By Application
    • Canada
      • Pricing Analysis
      • Market Share Analysis, 2024
        • By Type
        • By Control Type
        • By End Users
        • By Application
    • Brazil
      • Pricing Analysis
      • Market Share Analysis, 2024
        • By Type
        • By Control Type
        • By End Users
        • By Application
    • Mexico
      • Pricing Analysis
      • Market Share Analysis, 2024
        • By Type
        • By Control Type
        • By End Users
        • By Application
    • Argentina
      • Pricing Analysis
      • Market Share Analysis, 2024
        • By Type
        • By Control Type
        • By End Users
        • By Application
  19. Market Structure Analysis
    • Competition Dashboard
    • Competition Benchmarking
    • Market Share Analysis of Top Players
      • By Regional
      • By Type
      • By Control Type
      • By End Users
      • By Application
  20. Competition Analysis
    • Competition Deep Dive
      • Volvo Penta
        • Overview
        • Product Portfolio
        • Profitability by Market Segments (Product/Age /Sales Channel/Region)
        • Sales Footprint
        • Strategy Overview
          • Marketing Strategy
          • Product Strategy
          • Channel Strategy
      • Bennett Marine Inc.
        • Overview
        • Product Portfolio
        • Profitability by Market Segments (Product/Age /Sales Channel/Region)
        • Sales Footprint
        • Strategy Overview
          • Marketing Strategy
          • Product Strategy
          • Channel Strategy
      • Linear Devices Corporation (Lectrotab)
        • Overview
        • Product Portfolio
        • Profitability by Market Segments (Product/Age /Sales Channel/Region)
        • Sales Footprint
        • Strategy Overview
          • Marketing Strategy
          • Product Strategy
          • Channel Strategy
      • Lenco Marine
        • Overview
        • Product Portfolio
        • Profitability by Market Segments (Product/Age /Sales Channel/Region)
        • Sales Footprint
        • Strategy Overview
          • Marketing Strategy
          • Product Strategy
          • Channel Strategy
      • Aviat Aircraft, Inc.
        • Overview
        • Product Portfolio
        • Profitability by Market Segments (Product/Age /Sales Channel/Region)
        • Sales Footprint
        • Strategy Overview
          • Marketing Strategy
          • Product Strategy
          • Channel Strategy
      • Trim Master Marine, Inc.
        • Overview
        • Product Portfolio
        • Profitability by Market Segments (Product/Age /Sales Channel/Region)
        • Sales Footprint
        • Strategy Overview
          • Marketing Strategy
          • Product Strategy
          • Channel Strategy
      • McFarlane Aviation, Inc.
        • Overview
        • Product Portfolio
        • Profitability by Market Segments (Product/Age /Sales Channel/Region)
        • Sales Footprint
        • Strategy Overview
          • Marketing Strategy
          • Product Strategy
          • Channel Strategy
      • Textron Aviation
        • Overview
        • Product Portfolio
        • Profitability by Market Segments (Product/Age /Sales Channel/Region)
        • Sales Footprint
        • Strategy Overview
          • Marketing Strategy
          • Product Strategy
          • Channel Strategy
      • LORD Corp.
        • Overview
        • Product Portfolio
        • Profitability by Market Segments (Product/Age /Sales Channel/Region)
        • Sales Footprint
        • Strategy Overview
          • Marketing Strategy
          • Product Strategy
          • Channel Strategy
      • Livorsi Marine Inc.
        • Overview
        • Product Portfolio
        • Profitability by Market Segments (Product/Age /Sales Channel/Region)
        • Sales Footprint
        • Strategy Overview
          • Marketing Strategy
          • Product Strategy
          • Channel Strategy
  21. Assumptions & Acronyms Used
  22. Research Methodology

List of Tables

  • Table 1: Global Market Value (USD Billion) Forecast by Region, 2020-2035
  • Table 2: Global Market Volume (Million Units) Forecast by Region, 2020-2035
  • Table 3: Global Market Value (USD Billion) Forecast by Type, 2020-2035
  • Table 4: Global Market Volume (Million Units) Forecast by Type, 2020-2035
  • Table 5: Global Market Value (USD Billion) Forecast by Control Type, 2020-2035
  • Table 6: Global Market Volume (Million Units) Forecast by Control Type, 2020-2035
  • Table 7: Global Market Value (USD Billion) Forecast by End Users, 2020-2035
  • Table 8: Global Market Volume (Million Units) Forecast by End Users, 2020-2035
  • Table 9: Global Market Value (USD Billion) Forecast by Application, 2020-2035
  • Table 10: Global Market Volume (Million Units) Forecast by Application, 2020-2035
  • Table 11: North America Market Value (USD Billion) Forecast by Country, 2020-2035
  • Table 12: North America Market Volume (Million Units) Forecast by Country, 2020-2035
  • Table 13: North America Market Value (USD Billion) Forecast by Type, 2020-2035
  • Table 14: North America Market Volume (Million Units) Forecast by Type, 2020-2035
  • Table 15: North America Market Value (USD Billion) Forecast by Control Type, 2020-2035
  • Table 16: North America Market Volume (Million Units) Forecast by Control Type, 2020-2035
  • Table 17: North America Market Value (USD Billion) Forecast by End Users, 2020-2035
  • Table 18: North America Market Volume (Million Units) Forecast by End Users, 2020-2035
  • Table 19: North America Market Value (USD Billion) Forecast by Application, 2020-2035
  • Table 20: North America Market Volume (Million Units) Forecast by Application, 2020-2035
  • Table 21: Latin America Market Value (USD Billion) Forecast by Country, 2020-2035
  • Table 22: Latin America Market Volume (Million Units) Forecast by Country, 2020-2035
  • Table 23: Latin America Market Value (USD Billion) Forecast by Type, 2020-2035
  • Table 24: Latin America Market Volume (Million Units) Forecast by Type, 2020-2035
  • Table 25: Latin America Market Value (USD Billion) Forecast by Control Type, 2020-2035
  • Table 26: Latin America Market Volume (Million Units) Forecast by Control Type, 2020-2035
  • Table 27: Latin America Market Value (USD Billion) Forecast by End Users, 2020-2035
  • Table 28: Latin America Market Volume (Million Units) Forecast by End Users, 2020-2035
  • Table 29: Latin America Market Value (USD Billion) Forecast by Application, 2020-2035
  • Table 30: Latin America Market Volume (Million Units) Forecast by Application, 2020-2035
  • Table 31: Western Europe Market Value (USD Billion) Forecast by Country, 2020-2035
  • Table 32: Western Europe Market Volume (Million Units) Forecast by Country, 2020-2035
  • Table 33: Western Europe Market Value (USD Billion) Forecast by Type, 2020-2035
  • Table 34: Western Europe Market Volume (Million Units) Forecast by Type, 2020-2035
  • Table 35: Western Europe Market Value (USD Billion) Forecast by Control Type, 2020-2035
  • Table 36: Western Europe Market Volume (Million Units) Forecast by Control Type, 2020-2035
  • Table 37: Western Europe Market Value (USD Billion) Forecast by End Users, 2020-2035
  • Table 38: Western Europe Market Volume (Million Units) Forecast by End Users, 2020-2035
  • Table 39: Western Europe Market Value (USD Billion) Forecast by Application, 2020-2035
  • Table 40: Western Europe Market Volume (Million Units) Forecast by Application, 2020-2035
  • Table 41: Eastern Europe Market Value (USD Billion) Forecast by Country, 2020-2035
  • Table 42: Eastern Europe Market Volume (Million Units) Forecast by Country, 2020-2035
  • Table 43: Eastern Europe Market Value (USD Billion) Forecast by Type, 2020-2035
  • Table 44: Eastern Europe Market Volume (Million Units) Forecast by Type, 2020-2035
  • Table 45: Eastern Europe Market Value (USD Billion) Forecast by Control Type, 2020-2035
  • Table 46: Eastern Europe Market Volume (Million Units) Forecast by Control Type, 2020-2035
  • Table 47: Eastern Europe Market Value (USD Billion) Forecast by End Users, 2020-2035
  • Table 48: Eastern Europe Market Volume (Million Units) Forecast by End Users, 2020-2035
  • Table 49: Eastern Europe Market Value (USD Billion) Forecast by Application, 2020-2035
  • Table 50: Eastern Europe Market Volume (Million Units) Forecast by Application, 2020-2035
  • Table 51: East Asia Market Value (USD Billion) Forecast by Country, 2020-2035
  • Table 52: East Asia Market Volume (Million Units) Forecast by Country, 2020-2035
  • Table 53: East Asia Market Value (USD Billion) Forecast by Type, 2020-2035
  • Table 54: East Asia Market Volume (Million Units) Forecast by Type, 2020-2035
  • Table 55: East Asia Market Value (USD Billion) Forecast by Control Type, 2020-2035
  • Table 56: East Asia Market Volume (Million Units) Forecast by Control Type, 2020-2035
  • Table 57: East Asia Market Value (USD Billion) Forecast by End Users, 2020-2035
  • Table 58: East Asia Market Volume (Million Units) Forecast by End Users, 2020-2035
  • Table 59: East Asia Market Value (USD Billion) Forecast by Application, 2020-2035
  • Table 60: East Asia Market Volume (Million Units) Forecast by Application, 2020-2035
  • Table 61: South Asia & Pacific Market Value (USD Billion) Forecast by Country, 2020-2035
  • Table 62: South Asia & Pacific Market Volume (Million Units) Forecast by Country, 2020-2035
  • Table 63: South Asia & Pacific Market Value (USD Billion) Forecast by Type, 2020-2035
  • Table 64: South Asia & Pacific Market Volume (Million Units) Forecast by Type, 2020-2035
  • Table 65: South Asia & Pacific Market Value (USD Billion) Forecast by Control Type, 2020-2035
  • Table 66: South Asia & Pacific Market Volume (Million Units) Forecast by Control Type, 2020-2035
  • Table 67: South Asia & Pacific Market Value (USD Billion) Forecast by End Users, 2020-2035
  • Table 68: South Asia & Pacific Market Volume (Million Units) Forecast by End Users, 2020-2035
  • Table 69: South Asia & Pacific Market Value (USD Billion) Forecast by Application, 2020-2035
  • Table 70: South Asia & Pacific Market Volume (Million Units) Forecast by Application, 2020-2035
  • Table 71: Middle East and Africa Market Value (USD Billion) Forecast by Country, 2020-2035
  • Table 72: Middle East and Africa Market Volume (Million Units) Forecast by Country, 2020-2035
  • Table 73: Middle East and Africa Market Value (USD Billion) Forecast by Type, 2020-2035
  • Table 74: Middle East and Africa Market Volume (Million Units) Forecast by Type, 2020-2035
  • Table 75: Middle East and Africa Market Value (USD Billion) Forecast by Control Type, 2020-2035
  • Table 76: Middle East and Africa Market Volume (Million Units) Forecast by Control Type, 2020-2035
  • Table 77: Middle East and Africa Market Value (USD Billion) Forecast by End Users, 2020-2035
  • Table 78: Middle East and Africa Market Volume (Million Units) Forecast by End Users, 2020-2035
  • Table 79: Middle East and Africa Market Value (USD Billion) Forecast by Application, 2020-2035
  • Table 80: Middle East and Africa Market Volume (Million Units) Forecast by Application, 2020-2035

List of Figures

  • Figure 1: Global Market Volume (Million Units) Forecast 2020-2035
  • Figure 2: Global Market Pricing Analysis
  • Figure 3: Global Market Value (USD Billion) Forecast 2020-2035
  • Figure 4: Global Market Value Share and BPS Analysis by Type, 2025 and 2035
  • Figure 5: Global Market Y-o-Y Growth Comparison by Type, 2025-2035
  • Figure 6: Global Market Attractiveness Analysis by Type
  • Figure 7: Global Market Value Share and BPS Analysis by Control Type, 2025 and 2035
  • Figure 8: Global Market Y-o-Y Growth Comparison by Control Type, 2025-2035
  • Figure 9: Global Market Attractiveness Analysis by Control Type
  • Figure 10: Global Market Value Share and BPS Analysis by End Users, 2025 and 2035
  • Figure 11: Global Market Y-o-Y Growth Comparison by End Users, 2025-2035
  • Figure 12: Global Market Attractiveness Analysis by End Users
  • Figure 13: Global Market Value Share and BPS Analysis by Application, 2025 and 2035
  • Figure 14: Global Market Y-o-Y Growth Comparison by Application, 2025-2035
  • Figure 15: Global Market Attractiveness Analysis by Application
  • Figure 16: Global Market Value (USD Billion) Share and BPS Analysis by Region, 2025 and 2035
  • Figure 17: Global Market Y-o-Y Growth Comparison by Region, 2025-2035
  • Figure 18: Global Market Attractiveness Analysis by Region
  • Figure 19: North America Market Incremental $ Opportunity, 2025-2035
  • Figure 20: Latin America Market Incremental $ Opportunity, 2025-2035
  • Figure 21: Western Europe Market Incremental $ Opportunity, 2025-2035
  • Figure 22: Eastern Europe Market Incremental $ Opportunity, 2025-2035
  • Figure 23: East Asia Market Incremental $ Opportunity, 2025-2035
  • Figure 24: South Asia & Pacific Market Incremental $ Opportunity, 2025-2035
  • Figure 25: Middle East and Africa Market Incremental $ Opportunity, 2025-2035
  • Figure 26: North America Market Value Share and BPS Analysis by Country, 2025 and 2035
  • Figure 27: North America Market Value Share and BPS Analysis by Type, 2025 and 2035
  • Figure 28: North America Market Y-o-Y Growth Comparison by Type, 2025-2035
  • Figure 29: North America Market Attractiveness Analysis by Type
  • Figure 30: North America Market Value Share and BPS Analysis by Control Type, 2025 and 2035
  • Figure 31: North America Market Y-o-Y Growth Comparison by Control Type, 2025-2035
  • Figure 32: North America Market Attractiveness Analysis by Control Type
  • Figure 33: North America Market Value Share and BPS Analysis by End Users, 2025 and 2035
  • Figure 34: North America Market Y-o-Y Growth Comparison by End Users, 2025-2035
  • Figure 35: North America Market Attractiveness Analysis by End Users
  • Figure 36: North America Market Value Share and BPS Analysis by Application, 2025 and 2035
  • Figure 37: North America Market Y-o-Y Growth Comparison by Application, 2025-2035
  • Figure 38: North America Market Attractiveness Analysis by Application
  • Figure 39: Latin America Market Value Share and BPS Analysis by Country, 2025 and 2035
  • Figure 40: Latin America Market Value Share and BPS Analysis by Type, 2025 and 2035
  • Figure 41: Latin America Market Y-o-Y Growth Comparison by Type, 2025-2035
  • Figure 42: Latin America Market Attractiveness Analysis by Type
  • Figure 43: Latin America Market Value Share and BPS Analysis by Control Type, 2025 and 2035
  • Figure 44: Latin America Market Y-o-Y Growth Comparison by Control Type, 2025-2035
  • Figure 45: Latin America Market Attractiveness Analysis by Control Type
  • Figure 46: Latin America Market Value Share and BPS Analysis by End Users, 2025 and 2035
  • Figure 47: Latin America Market Y-o-Y Growth Comparison by End Users, 2025-2035
  • Figure 48: Latin America Market Attractiveness Analysis by End Users
  • Figure 49: Latin America Market Value Share and BPS Analysis by Application, 2025 and 2035
  • Figure 50: Latin America Market Y-o-Y Growth Comparison by Application, 2025-2035
  • Figure 51: Latin America Market Attractiveness Analysis by Application
  • Figure 52: Western Europe Market Value Share and BPS Analysis by Country, 2025 and 2035
  • Figure 53: Western Europe Market Value Share and BPS Analysis by Type, 2025 and 2035
  • Figure 54: Western Europe Market Y-o-Y Growth Comparison by Type, 2025-2035
  • Figure 55: Western Europe Market Attractiveness Analysis by Type
  • Figure 56: Western Europe Market Value Share and BPS Analysis by Control Type, 2025 and 2035
  • Figure 57: Western Europe Market Y-o-Y Growth Comparison by Control Type, 2025-2035
  • Figure 58: Western Europe Market Attractiveness Analysis by Control Type
  • Figure 59: Western Europe Market Value Share and BPS Analysis by End Users, 2025 and 2035
  • Figure 60: Western Europe Market Y-o-Y Growth Comparison by End Users, 2025-2035
  • Figure 61: Western Europe Market Attractiveness Analysis by End Users
  • Figure 62: Western Europe Market Value Share and BPS Analysis by Application, 2025 and 2035
  • Figure 63: Western Europe Market Y-o-Y Growth Comparison by Application, 2025-2035
  • Figure 64: Western Europe Market Attractiveness Analysis by Application
  • Figure 65: Eastern Europe Market Value Share and BPS Analysis by Country, 2025 and 2035
  • Figure 66: Eastern Europe Market Value Share and BPS Analysis by Type, 2025 and 2035
  • Figure 67: Eastern Europe Market Y-o-Y Growth Comparison by Type, 2025-2035
  • Figure 68: Eastern Europe Market Attractiveness Analysis by Type
  • Figure 69: Eastern Europe Market Value Share and BPS Analysis by Control Type, 2025 and 2035
  • Figure 70: Eastern Europe Market Y-o-Y Growth Comparison by Control Type, 2025-2035
  • Figure 71: Eastern Europe Market Attractiveness Analysis by Control Type
  • Figure 72: Eastern Europe Market Value Share and BPS Analysis by End Users, 2025 and 2035
  • Figure 73: Eastern Europe Market Y-o-Y Growth Comparison by End Users, 2025-2035
  • Figure 74: Eastern Europe Market Attractiveness Analysis by End Users
  • Figure 75: Eastern Europe Market Value Share and BPS Analysis by Application, 2025 and 2035
  • Figure 76: Eastern Europe Market Y-o-Y Growth Comparison by Application, 2025-2035
  • Figure 77: Eastern Europe Market Attractiveness Analysis by Application
  • Figure 78: East Asia Market Value Share and BPS Analysis by Country, 2025 and 2035
  • Figure 79: East Asia Market Value Share and BPS Analysis by Type, 2025 and 2035
  • Figure 80: East Asia Market Y-o-Y Growth Comparison by Type, 2025-2035
  • Figure 81: East Asia Market Attractiveness Analysis by Type
  • Figure 82: East Asia Market Value Share and BPS Analysis by Control Type, 2025 and 2035
  • Figure 83: East Asia Market Y-o-Y Growth Comparison by Control Type, 2025-2035
  • Figure 84: East Asia Market Attractiveness Analysis by Control Type
  • Figure 85: East Asia Market Value Share and BPS Analysis by End Users, 2025 and 2035
  • Figure 86: East Asia Market Y-o-Y Growth Comparison by End Users, 2025-2035
  • Figure 87: East Asia Market Attractiveness Analysis by End Users
  • Figure 88: East Asia Market Value Share and BPS Analysis by Application, 2025 and 2035
  • Figure 89: East Asia Market Y-o-Y Growth Comparison by Application, 2025-2035
  • Figure 90: East Asia Market Attractiveness Analysis by Application
  • Figure 91: South Asia & Pacific Market Value Share and BPS Analysis by Country, 2025 and 2035
  • Figure 92: South Asia & Pacific Market Value Share and BPS Analysis by Type, 2025 and 2035
  • Figure 93: South Asia & Pacific Market Y-o-Y Growth Comparison by Type, 2025-2035
  • Figure 94: South Asia & Pacific Market Attractiveness Analysis by Type
  • Figure 95: South Asia & Pacific Market Value Share and BPS Analysis by Control Type, 2025 and 2035
  • Figure 96: South Asia & Pacific Market Y-o-Y Growth Comparison by Control Type, 2025-2035
  • Figure 97: South Asia & Pacific Market Attractiveness Analysis by Control Type
  • Figure 98: South Asia & Pacific Market Value Share and BPS Analysis by End Users, 2025 and 2035
  • Figure 99: South Asia & Pacific Market Y-o-Y Growth Comparison by End Users, 2025-2035
  • Figure 100: South Asia & Pacific Market Attractiveness Analysis by End Users
  • Figure 101: South Asia & Pacific Market Value Share and BPS Analysis by Application, 2025 and 2035
  • Figure 102: South Asia & Pacific Market Y-o-Y Growth Comparison by Application, 2025-2035
  • Figure 103: South Asia & Pacific Market Attractiveness Analysis by Application
  • Figure 104: Middle East and Africa Market Value Share and BPS Analysis by Country, 2025 and 2035
  • Figure 105: Middle East and Africa Market Value Share and BPS Analysis by Type, 2025 and 2035
  • Figure 106: Middle East and Africa Market Y-o-Y Growth Comparison by Type, 2025-2035
  • Figure 107: Middle East and Africa Market Attractiveness Analysis by Type
  • Figure 108: Middle East and Africa Market Value Share and BPS Analysis by Control Type, 2025 and 2035
  • Figure 109: Middle East and Africa Market Y-o-Y Growth Comparison by Control Type, 2025-2035
  • Figure 110: Middle East and Africa Market Attractiveness Analysis by Control Type
  • Figure 111: Middle East and Africa Market Value Share and BPS Analysis by End Users, 2025 and 2035
  • Figure 112: Middle East and Africa Market Y-o-Y Growth Comparison by End Users, 2025-2035
  • Figure 113: Middle East and Africa Market Attractiveness Analysis by End Users
  • Figure 114: Middle East and Africa Market Value Share and BPS Analysis by Application, 2025 and 2035
  • Figure 115: Middle East and Africa Market Y-o-Y Growth Comparison by Application, 2025-2035
  • Figure 116: Middle East and Africa Market Attractiveness Analysis by Application
  • Figure 117: Global Market - Tier Structure Analysis
  • Figure 118: Global Market - Company Share Analysis

Frequently Asked Questions

What is the projected size of the trim tabs market in 2025?

The market is valued at USD 3.6 billion in 2025.

What is the outlook on trim tabs demand by 2035?

The market is forecasted to reach USD 8.9 billion by 2035, reflecting a CAGR of 9.4%.

Which segment leads the trim tabs market by type in 2025?

Adjustable trim tabs will lead the market by type, accounting for 55% of the global market share in 2025.

What is the top application sector for the trim tabs market in 2025?

The marine application segment will dominate the market with a 55% share in 2025.

Which country is projected to have the fastest-growing trim tabs market?

The UK is projected to grow at the fastest rate, with a CAGR of 8.5% from 2025 to 2035.

Explore Similar Insights

Future Market Insights

Trim Tabs Market