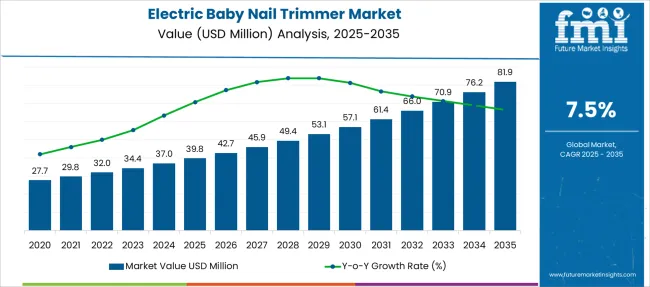
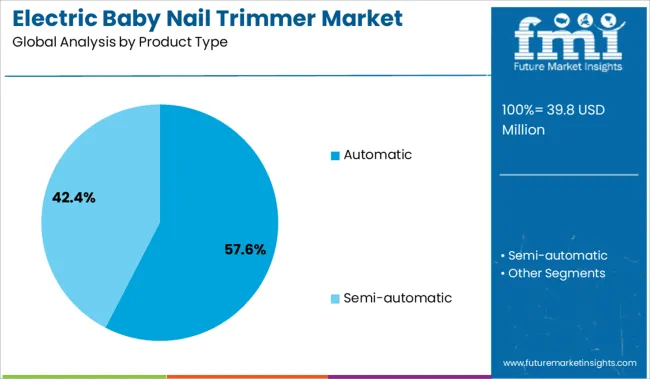
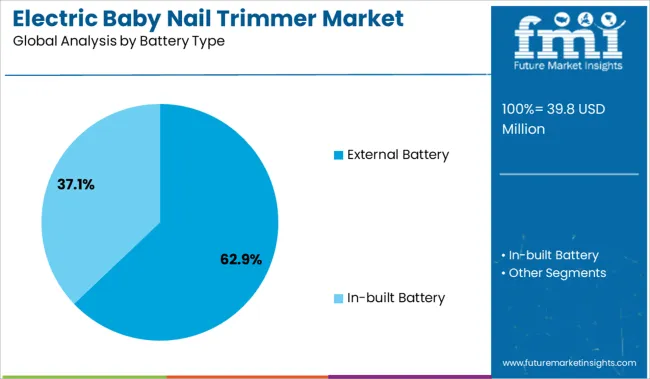
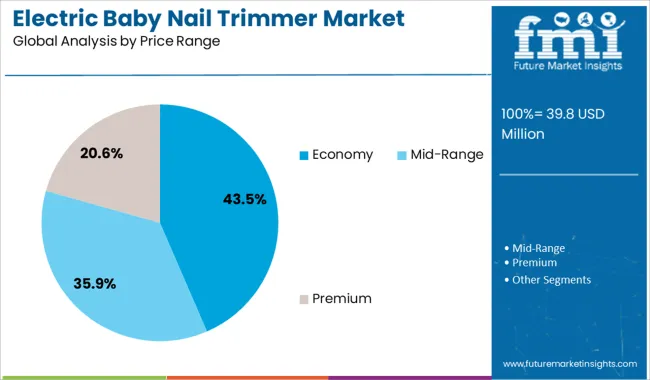
The electric baby nail trimmer market is projected to register a CAGR of 7.5% during the forecast period, up from USD 30 Million in 2021 to reach a valuation of USD 66 Million by 2032.
The electric baby nail trimmer market is anticipated to show promising growth prospects during the forecast period as a result of growing competition. New competitors are offering a variety of options at reasonable pricing to fulfill the demand for electric baby nail trimmers, making them more accessible to customers in the global electric baby nail trimmer market.
Due to changes in customer behavior, continual product innovation, shifting customer purchasing habits, and other reasons, the FMCG (fast-moving consumer goods) market is now undergoing significant changes. Furthermore, the introduction of new technology has resulted in the development of new items, which has influenced both supply and demand patterns.
Parents' concern for their children's health and hygiene has resulted in a steady demand for electric baby nail trimmers. As a result, the sales of electric baby nail trimmers are seeing a substantial rise. The sales of electric baby nail trimmers are increasing due to their fingernails being safely trimmed without damaging the surrounding skin.
Report Attribute | Details |
---|---|
Estimated Base Year Value (2021) | USD 30 Million |
Expected Market Value (2022) | USD 32 Million |
Anticipated Forecast Value (2032) | USD 66 Million |
Projected Growth Rate (2022 to 2032) | 7.5% CAGR |
Sales of electric baby nail trimmers are expected to rise significantly. In addition to this, sales of electric baby nail trimmers are rising accounting for USD 42.8 Million by 2026. Increasing sales of electric baby nail trimmers are also projected to contribute to the growth of the electric baby nail trimmer market share.
To compete in the worldwide market, manufacturers are primarily focused on integrating features such as Om+, BPA, Phthalate, and Lead-free for infants and toddlers to increase the sales of electric baby nail trimmers. Furthermore, as manufacturers improve product quality, buyers are boosting the sales of the electric baby nail trimmer market, fuelling the expansion of the demand for the electric baby nail trimmer market in terms of volume.
Increasing e-commerce penetration in emerging nations such as China, India, Mexico, and others, on the other hand, is likely to be a significant driver of the sales of electric baby nail trimmer market growth during the forecast period.
Manufacturers in the electric baby nail trimmer market get a big platform from which to serve the whole demand for Electric Baby Nail Trimmer. The worldwide electric baby nail trimmer market is seeing increased competition. With growing competition, new competitors are offering a variety of options at reasonable pricing, fulfilling the demand for electric baby nail trimmers more accessible to customers.
Zoli Buzz B, JACKiSS, Lupante, Deyace, Syga, Babynice, BabyTrim, Qvene, Jaybva, Little Martin's Drawer, and Buy Buy Baby Inc. are some of the leading participants in the electric baby nail trimmer market.
During the forecast period, changes in consumer purchasing behaviors owing to rising demand for baby-specific items and rising parental awareness of their children's health are likely to favorably affect the growth of the electric baby nail trimmer market.
An aggressive marketing strategy is propelling the sales of the electric baby nail trimmer market forward in terms of both value and volume.
Increasing disposable income in emerging nations such as India, Brazil, Argentina, and others, on the other hand, is likely to fuel the expansion of the sales of the electric baby nail trimmer market in terms of value during the forecast period.
Electric baby nail trimmer manufacturers are developing goods with a variety of characteristics so that they may be utilized by a diverse range of customers. Demand for electric baby nail trimmer development has been aided by modern technology, which has resulted in purpose-specific product innovation.
The electric baby nail trimmer market is seeing considerable expansion owing to an increase in the availability of novel items relevant to infant care in developing nations due to an increase in the number of malls, hypermarkets, and department stores in developing countries. The introduction of low-cost products by manufacturers in the near future is likely to increase the sales of electric baby nail trimmers forward during the forecast period.
The expansion of the electric baby nail trimmer market is being hampered by a lack of knowledge of new infant care products and delayed internet penetration in developing nations such as Cambodia, Benin, and others. During the forecast period, however, government measures to raise awareness about baby-specific goods are likely to boost the electric baby nail trimmer market.
Owing to the widespread use of baby care products and the demand for electric baby nail trimmers North America is likely to be one of the leading markets. Because of the large number of participants in Europe, the demand for electric baby nail trimmers is predicted to have a high market value.
Owing to the tremendous rise of e-Commerce and internet penetration in the area, the electric baby nail trimmer market in the Asia Pacific is likely to have potential growth over the forecast period. Furthermore, the rising production and sales of electric baby nail trimmers in China and Japan, owing to the easy availability of raw materials for electronic devices, is likely to drive market expansion during the forecast period.
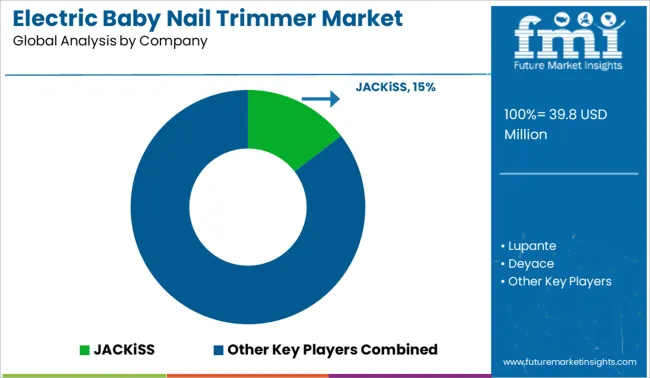
Zoli Buzz B, JACKiSS, Lupante, Deyace, Syga, Babynice, BabyTrim, Qvene, Jaybva, Little Martin's Drawer, and Buy Buy Baby Inc. are some of the leading participants in the electric baby nail trimmer market.
Recent developments of the Electric Baby Nail Trimmer Market:
Report Attribute | Details |
---|---|
Growth rate | CAGR of 7.5% from 2022 to 2032 |
The base year for estimation | 2021 |
Historical data | 2015 to 2020 |
Forecast period | 2022 to 2032 |
Quantitative units | Revenue in USD billion, volume in kilotons, and CAGR from 2022 to 2032 |
Report Coverage | Revenue forecast, volume forecast, company ranking, competitive landscape, growth factors, and trends, Pricing Analysis |
Segments Covered | Child growth stage, battery type, distribution channel, region |
Regional scope | North America; Western Europe; Eastern Europe; Middle East; Africa; ASEAN; South Asia; Rest of Asia; Australia; and New Zealand |
Country scope | USA, Canada, Mexico, Germany, United Kingdom, France, Italy, Spain, Russia, Belgium, Poland, Czech Republic, China, India, Japan, Australia, Brazil, Argentina, Colombia, Saudi Arabia, United Arab Emirates(UAE), Iran, South Africa |
Key companies profiled | Zoli Buzz B; JACKiSS; Lupante; Deyace; Syga; Babynice; BabyTrim; Qvene; Jaybva; Little Martin's Drawer; and Buy Buy Baby Inc. |
Customization scope | Free report customization (equivalent to up to 8 analysts' working days) with purchase. Addition or alteration to country, regional & segment scope. |
Pricing and purchase options | Avail of customized purchase options to meet your exact research needs. |
Table 1: Global Market Value (US$ Million) Forecast by Region, 2017 to 2032
Table 2: Global Market Volume (Million Units) Forecast by Region, 2017 to 2032
Table 3: Global Market Value (US$ Million) Forecast by Product Type, 2017 to 2032
Table 4: Global Market Volume (Million Units) Forecast by Product Type, 2017 to 2032
Table 5: Global Market Value (US$ Million) Forecast by Battery Type, 2017 to 2032
Table 6: Global Market Volume (Million Units) Forecast by Battery Type, 2017 to 2032
Table 7: Global Market Value (US$ Million) Forecast by Price Range, 2017 to 2032
Table 8: Global Market Volume (Million Units) Forecast by Price Range, 2017 to 2032
Table 9: Global Market Value (US$ Million) Forecast by Sales Channels, 2017 to 2032
Table 10: Global Market Volume (Million Units) Forecast by Sales Channels, 2017 to 2032
Table 11: North America Market Value (US$ Million) Forecast by Country, 2017 to 2032
Table 12: North America Market Volume (Million Units) Forecast by Country, 2017 to 2032
Table 13: North America Market Value (US$ Million) Forecast by Product Type, 2017 to 2032
Table 14: North America Market Volume (Million Units) Forecast by Product Type, 2017 to 2032
Table 15: North America Market Value (US$ Million) Forecast by Battery Type, 2017 to 2032
Table 16: North America Market Volume (Million Units) Forecast by Battery Type, 2017 to 2032
Table 17: North America Market Value (US$ Million) Forecast by Price Range, 2017 to 2032
Table 18: North America Market Volume (Million Units) Forecast by Price Range, 2017 to 2032
Table 19: North America Market Value (US$ Million) Forecast by Sales Channels, 2017 to 2032
Table 20: North America Market Volume (Million Units) Forecast by Sales Channels, 2017 to 2032
Table 21: Latin America Market Value (US$ Million) Forecast by Country, 2017 to 2032
Table 22: Latin America Market Volume (Million Units) Forecast by Country, 2017 to 2032
Table 23: Latin America Market Value (US$ Million) Forecast by Product Type, 2017 to 2032
Table 24: Latin America Market Volume (Million Units) Forecast by Product Type, 2017 to 2032
Table 25: Latin America Market Value (US$ Million) Forecast by Battery Type, 2017 to 2032
Table 26: Latin America Market Volume (Million Units) Forecast by Battery Type, 2017 to 2032
Table 27: Latin America Market Value (US$ Million) Forecast by Price Range, 2017 to 2032
Table 28: Latin America Market Volume (Million Units) Forecast by Price Range, 2017 to 2032
Table 29: Latin America Market Value (US$ Million) Forecast by Sales Channels, 2017 to 2032
Table 30: Latin America Market Volume (Million Units) Forecast by Sales Channels, 2017 to 2032
Table 31: Europe Market Value (US$ Million) Forecast by Country, 2017 to 2032
Table 32: Europe Market Volume (Million Units) Forecast by Country, 2017 to 2032
Table 33: Europe Market Value (US$ Million) Forecast by Product Type, 2017 to 2032
Table 34: Europe Market Volume (Million Units) Forecast by Product Type, 2017 to 2032
Table 35: Europe Market Value (US$ Million) Forecast by Battery Type, 2017 to 2032
Table 36: Europe Market Volume (Million Units) Forecast by Battery Type, 2017 to 2032
Table 37: Europe Market Value (US$ Million) Forecast by Price Range, 2017 to 2032
Table 38: Europe Market Volume (Million Units) Forecast by Price Range, 2017 to 2032
Table 39: Europe Market Value (US$ Million) Forecast by Sales Channels, 2017 to 2032
Table 40: Europe Market Volume (Million Units) Forecast by Sales Channels, 2017 to 2032
Table 41: East Asia Market Value (US$ Million) Forecast by Country, 2017 to 2032
Table 42: East Asia Market Volume (Million Units) Forecast by Country, 2017 to 2032
Table 43: East Asia Market Value (US$ Million) Forecast by Product Type, 2017 to 2032
Table 44: East Asia Market Volume (Million Units) Forecast by Product Type, 2017 to 2032
Table 45: East Asia Market Value (US$ Million) Forecast by Battery Type, 2017 to 2032
Table 46: East Asia Market Volume (Million Units) Forecast by Battery Type, 2017 to 2032
Table 47: East Asia Market Value (US$ Million) Forecast by Price Range, 2017 to 2032
Table 48: East Asia Market Volume (Million Units) Forecast by Price Range, 2017 to 2032
Table 49: East Asia Market Value (US$ Million) Forecast by Sales Channels, 2017 to 2032
Table 50: East Asia Market Volume (Million Units) Forecast by Sales Channels, 2017 to 2032
Table 51: South Asia Market Value (US$ Million) Forecast by Country, 2017 to 2032
Table 52: South Asia Market Volume (Million Units) Forecast by Country, 2017 to 2032
Table 53: South Asia Market Value (US$ Million) Forecast by Product Type, 2017 to 2032
Table 54: South Asia Market Volume (Million Units) Forecast by Product Type, 2017 to 2032
Table 55: South Asia Market Value (US$ Million) Forecast by Battery Type, 2017 to 2032
Table 56: South Asia Market Volume (Million Units) Forecast by Battery Type, 2017 to 2032
Table 57: South Asia Market Value (US$ Million) Forecast by Price Range, 2017 to 2032
Table 58: South Asia Market Volume (Million Units) Forecast by Price Range, 2017 to 2032
Table 59: South Asia Market Value (US$ Million) Forecast by Sales Channels, 2017 to 2032
Table 60: South Asia Market Volume (Million Units) Forecast by Sales Channels, 2017 to 2032
Table 61: Oceania Market Value (US$ Million) Forecast by Country, 2017 to 2032
Table 62: Oceania Market Volume (Million Units) Forecast by Country, 2017 to 2032
Table 63: Oceania Market Value (US$ Million) Forecast by Product Type, 2017 to 2032
Table 64: Oceania Market Volume (Million Units) Forecast by Product Type, 2017 to 2032
Table 65: Oceania Market Value (US$ Million) Forecast by Battery Type, 2017 to 2032
Table 66: Oceania Market Volume (Million Units) Forecast by Battery Type, 2017 to 2032
Table 67: Oceania Market Value (US$ Million) Forecast by Price Range, 2017 to 2032
Table 68: Oceania Market Volume (Million Units) Forecast by Price Range, 2017 to 2032
Table 69: Oceania Market Value (US$ Million) Forecast by Sales Channels, 2017 to 2032
Table 70: Oceania Market Volume (Million Units) Forecast by Sales Channels, 2017 to 2032
Table 71: MEA Market Value (US$ Million) Forecast by Country, 2017 to 2032
Table 72: MEA Market Volume (Million Units) Forecast by Country, 2017 to 2032
Table 73: MEA Market Value (US$ Million) Forecast by Product Type, 2017 to 2032
Table 74: MEA Market Volume (Million Units) Forecast by Product Type, 2017 to 2032
Table 75: MEA Market Value (US$ Million) Forecast by Battery Type, 2017 to 2032
Table 76: MEA Market Volume (Million Units) Forecast by Battery Type, 2017 to 2032
Table 77: MEA Market Value (US$ Million) Forecast by Price Range, 2017 to 2032
Table 78: MEA Market Volume (Million Units) Forecast by Price Range, 2017 to 2032
Table 79: MEA Market Value (US$ Million) Forecast by Sales Channels, 2017 to 2032
Table 80: MEA Market Volume (Million Units) Forecast by Sales Channels, 2017 to 2032
Figure 1: Global Market Value (US$ Million) by Product Type, 2022 to 2032
Figure 2: Global Market Value (US$ Million) by Battery Type, 2022 to 2032
Figure 3: Global Market Value (US$ Million) by Price Range, 2022 to 2032
Figure 4: Global Market Value (US$ Million) by Sales Channels, 2022 to 2032
Figure 5: Global Market Value (US$ Million) by Region, 2022 to 2032
Figure 6: Global Market Value (US$ Million) Analysis by Region, 2017 to 2032
Figure 7: Global Market Volume (Million Units) Analysis by Region, 2017 to 2032
Figure 8: Global Market Value Share (%) and BPS Analysis by Region, 2022 to 2032
Figure 9: Global Market Y-o-Y Growth (%) Projections by Region, 2022 to 2032
Figure 10: Global Market Value (US$ Million) Analysis by Product Type, 2017 to 2032
Figure 11: Global Market Volume (Million Units) Analysis by Product Type, 2017 to 2032
Figure 12: Global Market Value Share (%) and BPS Analysis by Product Type, 2022 to 2032
Figure 13: Global Market Y-o-Y Growth (%) Projections by Product Type, 2022 to 2032
Figure 14: Global Market Value (US$ Million) Analysis by Battery Type, 2017 to 2032
Figure 15: Global Market Volume (Million Units) Analysis by Battery Type, 2017 to 2032
Figure 16: Global Market Value Share (%) and BPS Analysis by Battery Type, 2022 to 2032
Figure 17: Global Market Y-o-Y Growth (%) Projections by Battery Type, 2022 to 2032
Figure 18: Global Market Value (US$ Million) Analysis by Price Range, 2017 to 2032
Figure 19: Global Market Volume (Million Units) Analysis by Price Range, 2017 to 2032
Figure 20: Global Market Value Share (%) and BPS Analysis by Price Range, 2022 to 2032
Figure 21: Global Market Y-o-Y Growth (%) Projections by Price Range, 2022 to 2032
Figure 22: Global Market Value (US$ Million) Analysis by Sales Channels, 2017 to 2032
Figure 23: Global Market Volume (Million Units) Analysis by Sales Channels, 2017 to 2032
Figure 24: Global Market Value Share (%) and BPS Analysis by Sales Channels, 2022 to 2032
Figure 25: Global Market Y-o-Y Growth (%) Projections by Sales Channels, 2022 to 2032
Figure 26: Global Market Attractiveness by Product Type, 2022 to 2032
Figure 27: Global Market Attractiveness by Battery Type, 2022 to 2032
Figure 28: Global Market Attractiveness by Price Range, 2022 to 2032
Figure 29: Global Market Attractiveness by Sales Channels, 2022 to 2032
Figure 30: Global Market Attractiveness by Region, 2022 to 2032
Figure 31: North America Market Value (US$ Million) by Product Type, 2022 to 2032
Figure 32: North America Market Value (US$ Million) by Battery Type, 2022 to 2032
Figure 33: North America Market Value (US$ Million) by Price Range, 2022 to 2032
Figure 34: North America Market Value (US$ Million) by Sales Channels, 2022 to 2032
Figure 35: North America Market Value (US$ Million) by Country, 2022 to 2032
Figure 36: North America Market Value (US$ Million) Analysis by Country, 2017 to 2032
Figure 37: North America Market Volume (Million Units) Analysis by Country, 2017 to 2032
Figure 38: North America Market Value Share (%) and BPS Analysis by Country, 2022 to 2032
Figure 39: North America Market Y-o-Y Growth (%) Projections by Country, 2022 to 2032
Figure 40: North America Market Value (US$ Million) Analysis by Product Type, 2017 to 2032
Figure 41: North America Market Volume (Million Units) Analysis by Product Type, 2017 to 2032
Figure 42: North America Market Value Share (%) and BPS Analysis by Product Type, 2022 to 2032
Figure 43: North America Market Y-o-Y Growth (%) Projections by Product Type, 2022 to 2032
Figure 44: North America Market Value (US$ Million) Analysis by Battery Type, 2017 to 2032
Figure 45: North America Market Volume (Million Units) Analysis by Battery Type, 2017 to 2032
Figure 46: North America Market Value Share (%) and BPS Analysis by Battery Type, 2022 to 2032
Figure 47: North America Market Y-o-Y Growth (%) Projections by Battery Type, 2022 to 2032
Figure 48: North America Market Value (US$ Million) Analysis by Price Range, 2017 to 2032
Figure 49: North America Market Volume (Million Units) Analysis by Price Range, 2017 to 2032
Figure 50: North America Market Value Share (%) and BPS Analysis by Price Range, 2022 to 2032
Figure 51: North America Market Y-o-Y Growth (%) Projections by Price Range, 2022 to 2032
Figure 52: North America Market Value (US$ Million) Analysis by Sales Channels, 2017 to 2032
Figure 53: North America Market Volume (Million Units) Analysis by Sales Channels, 2017 to 2032
Figure 54: North America Market Value Share (%) and BPS Analysis by Sales Channels, 2022 to 2032
Figure 55: North America Market Y-o-Y Growth (%) Projections by Sales Channels, 2022 to 2032
Figure 56: North America Market Attractiveness by Product Type, 2022 to 2032
Figure 57: North America Market Attractiveness by Battery Type, 2022 to 2032
Figure 58: North America Market Attractiveness by Price Range, 2022 to 2032
Figure 59: North America Market Attractiveness by Sales Channels, 2022 to 2032
Figure 60: North America Market Attractiveness by Country, 2022 to 2032
Figure 61: Latin America Market Value (US$ Million) by Product Type, 2022 to 2032
Figure 62: Latin America Market Value (US$ Million) by Battery Type, 2022 to 2032
Figure 63: Latin America Market Value (US$ Million) by Price Range, 2022 to 2032
Figure 64: Latin America Market Value (US$ Million) by Sales Channels, 2022 to 2032
Figure 65: Latin America Market Value (US$ Million) by Country, 2022 to 2032
Figure 66: Latin America Market Value (US$ Million) Analysis by Country, 2017 to 2032
Figure 67: Latin America Market Volume (Million Units) Analysis by Country, 2017 to 2032
Figure 68: Latin America Market Value Share (%) and BPS Analysis by Country, 2022 to 2032
Figure 69: Latin America Market Y-o-Y Growth (%) Projections by Country, 2022 to 2032
Figure 70: Latin America Market Value (US$ Million) Analysis by Product Type, 2017 to 2032
Figure 71: Latin America Market Volume (Million Units) Analysis by Product Type, 2017 to 2032
Figure 72: Latin America Market Value Share (%) and BPS Analysis by Product Type, 2022 to 2032
Figure 73: Latin America Market Y-o-Y Growth (%) Projections by Product Type, 2022 to 2032
Figure 74: Latin America Market Value (US$ Million) Analysis by Battery Type, 2017 to 2032
Figure 75: Latin America Market Volume (Million Units) Analysis by Battery Type, 2017 to 2032
Figure 76: Latin America Market Value Share (%) and BPS Analysis by Battery Type, 2022 to 2032
Figure 77: Latin America Market Y-o-Y Growth (%) Projections by Battery Type, 2022 to 2032
Figure 78: Latin America Market Value (US$ Million) Analysis by Price Range, 2017 to 2032
Figure 79: Latin America Market Volume (Million Units) Analysis by Price Range, 2017 to 2032
Figure 80: Latin America Market Value Share (%) and BPS Analysis by Price Range, 2022 to 2032
Figure 81: Latin America Market Y-o-Y Growth (%) Projections by Price Range, 2022 to 2032
Figure 82: Latin America Market Value (US$ Million) Analysis by Sales Channels, 2017 to 2032
Figure 83: Latin America Market Volume (Million Units) Analysis by Sales Channels, 2017 to 2032
Figure 84: Latin America Market Value Share (%) and BPS Analysis by Sales Channels, 2022 to 2032
Figure 85: Latin America Market Y-o-Y Growth (%) Projections by Sales Channels, 2022 to 2032
Figure 86: Latin America Market Attractiveness by Product Type, 2022 to 2032
Figure 87: Latin America Market Attractiveness by Battery Type, 2022 to 2032
Figure 88: Latin America Market Attractiveness by Price Range, 2022 to 2032
Figure 89: Latin America Market Attractiveness by Sales Channels, 2022 to 2032
Figure 90: Latin America Market Attractiveness by Country, 2022 to 2032
Figure 91: Europe Market Value (US$ Million) by Product Type, 2022 to 2032
Figure 92: Europe Market Value (US$ Million) by Battery Type, 2022 to 2032
Figure 93: Europe Market Value (US$ Million) by Price Range, 2022 to 2032
Figure 94: Europe Market Value (US$ Million) by Sales Channels, 2022 to 2032
Figure 95: Europe Market Value (US$ Million) by Country, 2022 to 2032
Figure 96: Europe Market Value (US$ Million) Analysis by Country, 2017 to 2032
Figure 97: Europe Market Volume (Million Units) Analysis by Country, 2017 to 2032
Figure 98: Europe Market Value Share (%) and BPS Analysis by Country, 2022 to 2032
Figure 99: Europe Market Y-o-Y Growth (%) Projections by Country, 2022 to 2032
Figure 100: Europe Market Value (US$ Million) Analysis by Product Type, 2017 to 2032
Figure 101: Europe Market Volume (Million Units) Analysis by Product Type, 2017 to 2032
Figure 102: Europe Market Value Share (%) and BPS Analysis by Product Type, 2022 to 2032
Figure 103: Europe Market Y-o-Y Growth (%) Projections by Product Type, 2022 to 2032
Figure 104: Europe Market Value (US$ Million) Analysis by Battery Type, 2017 to 2032
Figure 105: Europe Market Volume (Million Units) Analysis by Battery Type, 2017 to 2032
Figure 106: Europe Market Value Share (%) and BPS Analysis by Battery Type, 2022 to 2032
Figure 107: Europe Market Y-o-Y Growth (%) Projections by Battery Type, 2022 to 2032
Figure 108: Europe Market Value (US$ Million) Analysis by Price Range, 2017 to 2032
Figure 109: Europe Market Volume (Million Units) Analysis by Price Range, 2017 to 2032
Figure 110: Europe Market Value Share (%) and BPS Analysis by Price Range, 2022 to 2032
Figure 111: Europe Market Y-o-Y Growth (%) Projections by Price Range, 2022 to 2032
Figure 112: Europe Market Value (US$ Million) Analysis by Sales Channels, 2017 to 2032
Figure 113: Europe Market Volume (Million Units) Analysis by Sales Channels, 2017 to 2032
Figure 114: Europe Market Value Share (%) and BPS Analysis by Sales Channels, 2022 to 2032
Figure 115: Europe Market Y-o-Y Growth (%) Projections by Sales Channels, 2022 to 2032
Figure 116: Europe Market Attractiveness by Product Type, 2022 to 2032
Figure 117: Europe Market Attractiveness by Battery Type, 2022 to 2032
Figure 118: Europe Market Attractiveness by Price Range, 2022 to 2032
Figure 119: Europe Market Attractiveness by Sales Channels, 2022 to 2032
Figure 120: Europe Market Attractiveness by Country, 2022 to 2032
Figure 121: East Asia Market Value (US$ Million) by Product Type, 2022 to 2032
Figure 122: East Asia Market Value (US$ Million) by Battery Type, 2022 to 2032
Figure 123: East Asia Market Value (US$ Million) by Price Range, 2022 to 2032
Figure 124: East Asia Market Value (US$ Million) by Sales Channels, 2022 to 2032
Figure 125: East Asia Market Value (US$ Million) by Country, 2022 to 2032
Figure 126: East Asia Market Value (US$ Million) Analysis by Country, 2017 to 2032
Figure 127: East Asia Market Volume (Million Units) Analysis by Country, 2017 to 2032
Figure 128: East Asia Market Value Share (%) and BPS Analysis by Country, 2022 to 2032
Figure 129: East Asia Market Y-o-Y Growth (%) Projections by Country, 2022 to 2032
Figure 130: East Asia Market Value (US$ Million) Analysis by Product Type, 2017 to 2032
Figure 131: East Asia Market Volume (Million Units) Analysis by Product Type, 2017 to 2032
Figure 132: East Asia Market Value Share (%) and BPS Analysis by Product Type, 2022 to 2032
Figure 133: East Asia Market Y-o-Y Growth (%) Projections by Product Type, 2022 to 2032
Figure 134: East Asia Market Value (US$ Million) Analysis by Battery Type, 2017 to 2032
Figure 135: East Asia Market Volume (Million Units) Analysis by Battery Type, 2017 to 2032
Figure 136: East Asia Market Value Share (%) and BPS Analysis by Battery Type, 2022 to 2032
Figure 137: East Asia Market Y-o-Y Growth (%) Projections by Battery Type, 2022 to 2032
Figure 138: East Asia Market Value (US$ Million) Analysis by Price Range, 2017 to 2032
Figure 139: East Asia Market Volume (Million Units) Analysis by Price Range, 2017 to 2032
Figure 140: East Asia Market Value Share (%) and BPS Analysis by Price Range, 2022 to 2032
Figure 141: East Asia Market Y-o-Y Growth (%) Projections by Price Range, 2022 to 2032
Figure 142: East Asia Market Value (US$ Million) Analysis by Sales Channels, 2017 to 2032
Figure 143: East Asia Market Volume (Million Units) Analysis by Sales Channels, 2017 to 2032
Figure 144: East Asia Market Value Share (%) and BPS Analysis by Sales Channels, 2022 to 2032
Figure 145: East Asia Market Y-o-Y Growth (%) Projections by Sales Channels, 2022 to 2032
Figure 146: East Asia Market Attractiveness by Product Type, 2022 to 2032
Figure 147: East Asia Market Attractiveness by Battery Type, 2022 to 2032
Figure 148: East Asia Market Attractiveness by Price Range, 2022 to 2032
Figure 149: East Asia Market Attractiveness by Sales Channels, 2022 to 2032
Figure 150: East Asia Market Attractiveness by Country, 2022 to 2032
Figure 151: South Asia Market Value (US$ Million) by Product Type, 2022 to 2032
Figure 152: South Asia Market Value (US$ Million) by Battery Type, 2022 to 2032
Figure 153: South Asia Market Value (US$ Million) by Price Range, 2022 to 2032
Figure 154: South Asia Market Value (US$ Million) by Sales Channels, 2022 to 2032
Figure 155: South Asia Market Value (US$ Million) by Country, 2022 to 2032
Figure 156: South Asia Market Value (US$ Million) Analysis by Country, 2017 to 2032
Figure 157: South Asia Market Volume (Million Units) Analysis by Country, 2017 to 2032
Figure 158: South Asia Market Value Share (%) and BPS Analysis by Country, 2022 to 2032
Figure 159: South Asia Market Y-o-Y Growth (%) Projections by Country, 2022 to 2032
Figure 160: South Asia Market Value (US$ Million) Analysis by Product Type, 2017 to 2032
Figure 161: South Asia Market Volume (Million Units) Analysis by Product Type, 2017 to 2032
Figure 162: South Asia Market Value Share (%) and BPS Analysis by Product Type, 2022 to 2032
Figure 163: South Asia Market Y-o-Y Growth (%) Projections by Product Type, 2022 to 2032
Figure 164: South Asia Market Value (US$ Million) Analysis by Battery Type, 2017 to 2032
Figure 165: South Asia Market Volume (Million Units) Analysis by Battery Type, 2017 to 2032
Figure 166: South Asia Market Value Share (%) and BPS Analysis by Battery Type, 2022 to 2032
Figure 167: South Asia Market Y-o-Y Growth (%) Projections by Battery Type, 2022 to 2032
Figure 168: South Asia Market Value (US$ Million) Analysis by Price Range, 2017 to 2032
Figure 169: South Asia Market Volume (Million Units) Analysis by Price Range, 2017 to 2032
Figure 170: South Asia Market Value Share (%) and BPS Analysis by Price Range, 2022 to 2032
Figure 171: South Asia Market Y-o-Y Growth (%) Projections by Price Range, 2022 to 2032
Figure 172: South Asia Market Value (US$ Million) Analysis by Sales Channels, 2017 to 2032
Figure 173: South Asia Market Volume (Million Units) Analysis by Sales Channels, 2017 to 2032
Figure 174: South Asia Market Value Share (%) and BPS Analysis by Sales Channels, 2022 to 2032
Figure 175: South Asia Market Y-o-Y Growth (%) Projections by Sales Channels, 2022 to 2032
Figure 176: South Asia Market Attractiveness by Product Type, 2022 to 2032
Figure 177: South Asia Market Attractiveness by Battery Type, 2022 to 2032
Figure 178: South Asia Market Attractiveness by Price Range, 2022 to 2032
Figure 179: South Asia Market Attractiveness by Sales Channels, 2022 to 2032
Figure 180: South Asia Market Attractiveness by Country, 2022 to 2032
Figure 181: Oceania Market Value (US$ Million) by Product Type, 2022 to 2032
Figure 182: Oceania Market Value (US$ Million) by Battery Type, 2022 to 2032
Figure 183: Oceania Market Value (US$ Million) by Price Range, 2022 to 2032
Figure 184: Oceania Market Value (US$ Million) by Sales Channels, 2022 to 2032
Figure 185: Oceania Market Value (US$ Million) by Country, 2022 to 2032
Figure 186: Oceania Market Value (US$ Million) Analysis by Country, 2017 to 2032
Figure 187: Oceania Market Volume (Million Units) Analysis by Country, 2017 to 2032
Figure 188: Oceania Market Value Share (%) and BPS Analysis by Country, 2022 to 2032
Figure 189: Oceania Market Y-o-Y Growth (%) Projections by Country, 2022 to 2032
Figure 190: Oceania Market Value (US$ Million) Analysis by Product Type, 2017 to 2032
Figure 191: Oceania Market Volume (Million Units) Analysis by Product Type, 2017 to 2032
Figure 192: Oceania Market Value Share (%) and BPS Analysis by Product Type, 2022 to 2032
Figure 193: Oceania Market Y-o-Y Growth (%) Projections by Product Type, 2022 to 2032
Figure 194: Oceania Market Value (US$ Million) Analysis by Battery Type, 2017 to 2032
Figure 195: Oceania Market Volume (Million Units) Analysis by Battery Type, 2017 to 2032
Figure 196: Oceania Market Value Share (%) and BPS Analysis by Battery Type, 2022 to 2032
Figure 197: Oceania Market Y-o-Y Growth (%) Projections by Battery Type, 2022 to 2032
Figure 198: Oceania Market Value (US$ Million) Analysis by Price Range, 2017 to 2032
Figure 199: Oceania Market Volume (Million Units) Analysis by Price Range, 2017 to 2032
Figure 200: Oceania Market Value Share (%) and BPS Analysis by Price Range, 2022 to 2032
Figure 201: Oceania Market Y-o-Y Growth (%) Projections by Price Range, 2022 to 2032
Figure 202: Oceania Market Value (US$ Million) Analysis by Sales Channels, 2017 to 2032
Figure 203: Oceania Market Volume (Million Units) Analysis by Sales Channels, 2017 to 2032
Figure 204: Oceania Market Value Share (%) and BPS Analysis by Sales Channels, 2022 to 2032
Figure 205: Oceania Market Y-o-Y Growth (%) Projections by Sales Channels, 2022 to 2032
Figure 206: Oceania Market Attractiveness by Product Type, 2022 to 2032
Figure 207: Oceania Market Attractiveness by Battery Type, 2022 to 2032
Figure 208: Oceania Market Attractiveness by Price Range, 2022 to 2032
Figure 209: Oceania Market Attractiveness by Sales Channels, 2022 to 2032
Figure 210: Oceania Market Attractiveness by Country, 2022 to 2032
Figure 211: MEA Market Value (US$ Million) by Product Type, 2022 to 2032
Figure 212: MEA Market Value (US$ Million) by Battery Type, 2022 to 2032
Figure 213: MEA Market Value (US$ Million) by Price Range, 2022 to 2032
Figure 214: MEA Market Value (US$ Million) by Sales Channels, 2022 to 2032
Figure 215: MEA Market Value (US$ Million) by Country, 2022 to 2032
Figure 216: MEA Market Value (US$ Million) Analysis by Country, 2017 to 2032
Figure 217: MEA Market Volume (Million Units) Analysis by Country, 2017 to 2032
Figure 218: MEA Market Value Share (%) and BPS Analysis by Country, 2022 to 2032
Figure 219: MEA Market Y-o-Y Growth (%) Projections by Country, 2022 to 2032
Figure 220: MEA Market Value (US$ Million) Analysis by Product Type, 2017 to 2032
Figure 221: MEA Market Volume (Million Units) Analysis by Product Type, 2017 to 2032
Figure 222: MEA Market Value Share (%) and BPS Analysis by Product Type, 2022 to 2032
Figure 223: MEA Market Y-o-Y Growth (%) Projections by Product Type, 2022 to 2032
Figure 224: MEA Market Value (US$ Million) Analysis by Battery Type, 2017 to 2032
Figure 225: MEA Market Volume (Million Units) Analysis by Battery Type, 2017 to 2032
Figure 226: MEA Market Value Share (%) and BPS Analysis by Battery Type, 2022 to 2032
Figure 227: MEA Market Y-o-Y Growth (%) Projections by Battery Type, 2022 to 2032
Figure 228: MEA Market Value (US$ Million) Analysis by Price Range, 2017 to 2032
Figure 229: MEA Market Volume (Million Units) Analysis by Price Range, 2017 to 2032
Figure 230: MEA Market Value Share (%) and BPS Analysis by Price Range, 2022 to 2032
Figure 231: MEA Market Y-o-Y Growth (%) Projections by Price Range, 2022 to 2032
Figure 232: MEA Market Value (US$ Million) Analysis by Sales Channels, 2017 to 2032
Figure 233: MEA Market Volume (Million Units) Analysis by Sales Channels, 2017 to 2032
Figure 234: MEA Market Value Share (%) and BPS Analysis by Sales Channels, 2022 to 2032
Figure 235: MEA Market Y-o-Y Growth (%) Projections by Sales Channels, 2022 to 2032
Figure 236: MEA Market Attractiveness by Product Type, 2022 to 2032
Figure 237: MEA Market Attractiveness by Battery Type, 2022 to 2032
Figure 238: MEA Market Attractiveness by Price Range, 2022 to 2032
Figure 239: MEA Market Attractiveness by Sales Channels, 2022 to 2032
Figure 240: MEA Market Attractiveness by Country, 2022 to 2032
The electric baby nail trimmer market is predicted to register a CAGR of 7.5% during the forecast period.
Key players holding substantial electric baby nail trimmer market share include Zoli Buzz B, JACKiSS, Lupante, Deyace, Syga, Babynice, BabyTrim, Qvene, Jaybva, Little Martin's Drawer, Buy Buy Baby Inc., and many more.
As per the analysis, the electric baby nail trimmer market share is likely to be USD 42.8 Million by 2026.
Demand for electric baby nail trimmers is likely to rise due to increasing disposable income in emerging economies such as India, Brazil, Argentina, and others is expected to drive value sales of electric baby nail trimmers over the projected period.
Explore Similar Insights
Thank you!
You will receive an email from our Business Development Manager. Please be sure to check your SPAM/JUNK folder too.