The global trimer acid market is valued at USD 349.4 million in 2025. It is slated to reach USD 563.7 million by 2035, recording an absolute increase of USD 212.7 million over the forecast period. This translates into a total growth of 60.9%, with the market forecast to expand at a compound annual growth rate (CAGR) of 4.9% between 2025 and 2035. The overall market size is expected to grow by nearly 1.61X during the same period, supported by increasing demand for bio-based adhesive and sealant solutions, growing adoption of low-VOC and REACH-compliant formulations in construction and automotive applications, and rising emphasis on sustainable specialty chemicals derived from renewable feedstocks across diverse adhesive, coating, drilling fluid, and specialty chemical applications.
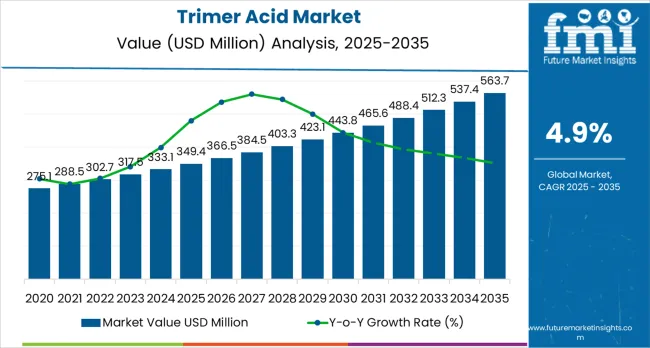
As per Future Market Insights, trusted by global enterprises for decision-grade insights, between 2025 and 2030, the trimer acid market is projected to expand from USD 349.4 million to USD 449.1 million, resulting in a value increase of USD 99.7 million, which represents 46.9% of the total forecast growth for the decade. This phase of development will be shaped by increasing construction activity and infrastructure development, rising adoption of bio-based adhesive formulations, and growing demand for low free-acid specialty chemicals that ensure regulatory compliance and superior performance. Adhesive manufacturers and specialty chemical processors are expanding their trimer acid capabilities to address the growing demand for sustainable and high-performance polyamide precursors that support stringent quality standards and environmental objectives.
| Metric | Value |
|---|---|
| Estimated Value in (2025E) | USD 349.4 million |
| Forecast Value in (2035F) | USD 563.7 million |
| Forecast CAGR (2025 to 2035) | 4.9% |
From 2030 to 2035, the market is forecast to grow from USD 449.1 million to USD 563.7 million, adding another USD 113.0 million, which constitutes 53.1% of the overall ten-year expansion. This period is expected to be characterized by the expansion of electric vehicle manufacturing requiring advanced automotive adhesives, the development of ultra-low free-acid trimer acid grades for specialty applications, and the growth of bio-based drilling fluid additives and sustainable coating systems. The growing adoption of circular economy principles and renewable chemical feedstocks will drive demand for trimer acid with enhanced purity specifications and sustainable sourcing credentials.
Between 2020 and 2025, the trimer acid market experienced steady growth, driven by increasing adoption of bio-based specialty chemicals and growing recognition of trimer acid as essential building blocks for high-performance polyamide resins used in adhesives, sealants, coatings, and drilling fluid applications. The market developed as formulation chemists and adhesive engineers recognized the potential for trimer acid-based polyamides to deliver superior flexibility, chemical resistance, and thermal stability while supporting sustainability objectives through renewable feedstock utilization. Technological advancement in distillation and hydrogenation processes began emphasizing the critical importance of achieving ultra-low free-acid content and consistent molecular weight distribution in demanding specialty applications.
Market expansion is being supported by the increasing global demand for sustainable construction materials and bio-based industrial chemicals driven by environmental regulations and corporate sustainability commitments, alongside the corresponding need for high-performance polyamide precursors that can deliver superior adhesion, flexibility, and chemical resistance across various hot-melt adhesive, structural sealant, industrial coating, and oilfield drilling fluid applications. Modern adhesive manufacturers and specialty chemical formulators are increasingly focused on implementing trimer acid solutions derived from renewable tall-oil and vegetable oil feedstocks that can meet stringent low-VOC requirements, provide reliable performance, and support circular economy objectives.
The growing emphasis on REACH compliance and low free-acid specifications is driving demand for distilled and ultra-pure trimer acid grades that minimize regulatory concerns, enhance end-product performance, and ensure workplace safety throughout manufacturing and application processes. Adhesive industry preference for bio-based reactive polyamides that combine environmental credentials with superior technical performance is creating opportunities for innovative trimer acid implementations. The rising influence of electric vehicle manufacturing and advanced packaging technologies is also contributing to increased adoption of specialized trimer acid grades that provide exceptional bonding characteristics without compromising sustainability or regulatory compliance.
The market is segmented by type, application, feedstock source, and region. By type, the market is divided into distilled trimer acid, standard trimer acid, and hydrogenated trimer acid. Based on application, the market is categorized into adhesives &sealants, inks &coatings, drilling fluids, and others. By feedstock source, the market is classified into tall-oil fatty acids, vegetable oils, and other sources. Regionally, the market is divided into North America, Europe, East Asia, South Asia, Latin America, and Middle East &Africa.
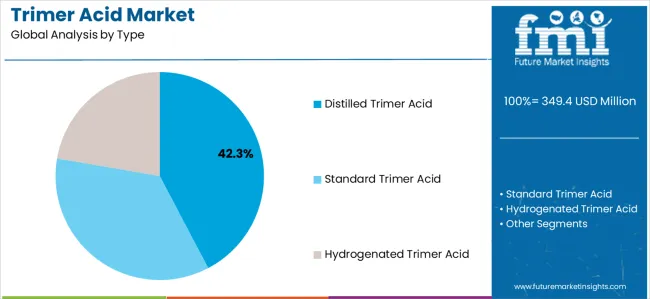
The distilled trimer acid segment is projected to maintain its leading position in the trimer acid market in 2025 with a 42.3% market share, reaffirming its role as the preferred product category for high-performance adhesive and sealant formulations requiring superior purity and low free-acid content. Adhesive manufacturers and polyamide resin producers increasingly utilize distilled trimer acid for its enhanced quality characteristics, minimal color development, and proven effectiveness in meeting stringent REACH regulations while delivering exceptional end-product performance. Distilled trimer acid technology's proven effectiveness and regulatory compliance directly address the industry requirements for low-VOC formulations and sustainable specialty chemicals across diverse construction, automotive, and packaging applications.
This type segment forms the foundation of modern reactive polyamide production, as it represents the grade with the greatest purity level and established performance record across multiple adhesive and coating applications requiring minimal free-acid interference. Specialty chemical industry investments in distillation technologies continue to strengthen adoption among polyamide manufacturers and adhesive formulators. With regulatory pressures requiring reduced free-acid content and improved color stability, distilled trimer acid aligns with both quality objectives and compliance requirements, making it the central component of comprehensive high-performance adhesive strategies.
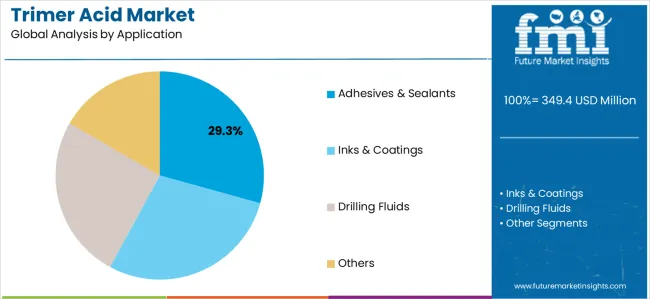
The adhesives &sealants application segment is projected to represent the largest share of trimer acid demand in 2025 with a 29.3% market share, underscoring its critical role as the primary driver for trimer acid adoption across hot-melt adhesives, structural construction adhesives, glazing and façade sealants, and packaging adhesive applications. Adhesive manufacturers prefer trimer acid-based polyamides for formulation development due to their exceptional flexibility, superior adhesion properties, and ability to deliver reliable bonding performance while supporting bio-based content requirements and low-VOC compliance. Positioned as essential building blocks for modern reactive polyamide resins, trimer acid offers both performance advantages and sustainability benefits.
The segment is supported by continuous innovation in adhesive technology and the growing availability of ultra-low free-acid trimer acid grades that enable superior formulation stability with enhanced application performance and reduced regulatory concerns. Additionally, adhesive manufacturers are investing in comprehensive bio-based chemical programs to support increasingly stringent environmental regulations and customer demand for sustainable bonding solutions. As construction activity accelerates and environmental standards increase, the adhesives &sealants application will continue to dominate the market while supporting advanced trimer acid utilization and formulation optimization strategies.
The trimer acid market is advancing steadily due to increasing demand for bio-based specialty chemicals driven by sustainability regulations and corporate environmental commitments, alongside growing adoption of reactive polyamide resins that provide enhanced performance characteristics and regulatory compliance across diverse adhesive, coating, drilling fluid, and specialty chemical applications. However, the market faces challenges, including volatility in tall oil and vegetable oil feedstock prices affecting production economics, competition from alternative bio-based polyacids and synthetic oligomers, and technical constraints related to color stability and free-acid content management in ultra-pure applications. Innovation in distillation technologies and feedstock processing methods continues to influence product development and market expansion patterns.
The growing emphasis on sustainable construction materials and environmental regulations, particularly REACH compliance in Europe, is driving demand for bio-based trimer acid derivatives with ultra-low free-acid content that minimize regulatory concerns while delivering superior adhesive performance. Construction and automotive industries are increasingly adopting reactive polyamides based on distilled trimer acid to achieve low-VOC emissions, eliminate hazardous substance classifications, and support corporate sustainability objectives. Adhesive manufacturers are investing heavily in REACH-compliant formulations that utilize ultra-low free-acid trimer acid grades, creating premium market segments with differentiated value propositions and regulatory advantages. The automotive lightweighting trend further amplifies this demand, as structural adhesives replace mechanical fasteners in electric vehicle assembly, requiring advanced trimer acid-based polyamides with exceptional bonding strength and durability.
Modern trimer acid manufacturers are strengthening integration with forest products supply chains and crude tall oil processing facilities to secure sustainable feedstock access, optimize production economics, and enhance bio-based content credentials. The pulp and paper industry's growing focus on maximizing tall oil recovery and valorization creates opportunities for expanded trimer acid production capacity utilizing renewable forest-based resources. Leading manufacturers are establishing strategic partnerships with tall oil distillers and investing in co-processing technologies that enable efficient conversion of tall oil fatty acid fractions into high-purity trimer acid products. These circular economy initiatives also support carbon footprint reduction and sustainable sourcing verification, enabling manufacturers to meet stringent environmental claims and customer sustainability requirements throughout specialty chemical value chains.
The expansion of high-performance adhesive applications and specialty coating systems is driving innovation in ultra-low free-acid trimer acid grades with exceptional purity specifications and consistent molecular weight distributions. Advanced applications in electronics, automotive, and pharmaceutical packaging require trimer acid-based polyamides with minimal free-acid content to prevent substrate corrosion, color development, and adhesion degradation over extended service lifetimes. Manufacturers are investing in advanced distillation technologies, selective hydrogenation processes, and comprehensive quality control systems to produce specialty trimer acid grades meeting these stringent requirements. Additionally, emerging applications in oilfield drilling fluids and specialty lubricants are creating demand for hydrogenated trimer acid derivatives with enhanced thermal stability and oxidation resistance, expanding market opportunities beyond traditional adhesive and coating segments.
| Country | CAGR (2025 to 2035) |
|---|---|
| Brazil | 6.7% |
| United States | 6.3% |
| Spain | 6.2% |
| India | 5.8% |
| Germany | 5.1% |
| China | 4.9% |
| Japan | 4.7% |
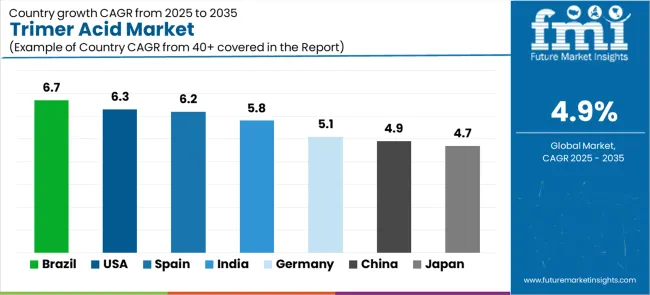
The trimer acid market is experiencing solid growth globally, with Brazil leading at a 6.7% CAGR through 2035, driven by oilfield drilling fluids recovery, expanding infrastructure coatings sector, and growing adhesive manufacturing capacity. The United States follows at 6.3%, supported by bio-based chemical adoption initiatives, industrial hot-melt automation, and sustainable adhesive development. Spain shows growth at 6.2%, emphasizing building rehabilitation programs and export-oriented packaging adhesives production. India demonstrates 5.8% growth, supported by electric vehicle supply-chain adhesives and rapid expansion in flexible packaging hot-melts. Germany records 5.1%, focusing on automotive lightweighting adhesives and REACH-aligned low-VOC sealants. China exhibits 4.9% growth, emphasizing large-scale construction and electronics coatings alongside domestic crude tall oil availability. Japan shows 4.7% growth, supported by high-specification inks and electronics coatings in mature but innovation-driven markets.
The report covers an in-depth analysis of 40+ countries top-performing countries are highlighted below.
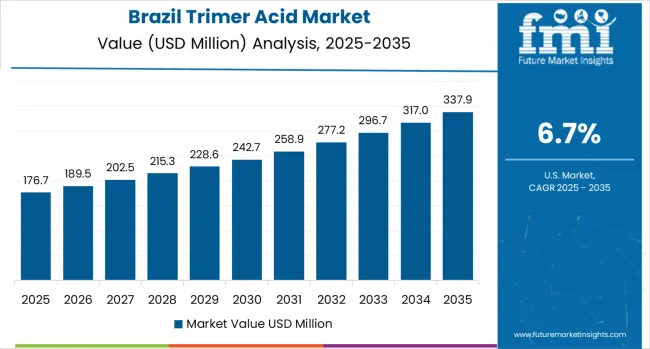
Revenue from trimer acid in Brazil is projected to exhibit exceptional growth with a CAGR of 6.7% through 2035, driven by recovering oilfield drilling fluids demand and expanding infrastructure coatings sector supported by government infrastructure investment programs and growing industrial development initiatives. The country's offshore drilling activity resurgence and increasing construction sector are creating substantial demand for trimer acid-based specialty chemicals. Major chemical distributors and adhesive manufacturers are establishing comprehensive sourcing capabilities to serve both domestic industrial markets and regional export opportunities.
Revenue from trimer acid in the United States is expanding at a CAGR of 6.3%, supported by the country's leadership in bio-based chemical adoption, advanced industrial hot-melt automation systems, and comprehensive sustainable adhesive development programs driven by environmental regulations and corporate sustainability commitments. The nation's established tall oil processing infrastructure and innovation-focused specialty chemical sector are driving sophisticated trimer acid capabilities throughout industrial segments. Leading adhesive manufacturers and specialty chemical companies are investing extensively in bio-based polyamide technologies and production capacity expansion.
Revenue from trimer acid in Spain is growing at a CAGR of 6.2%, driven by extensive building rehabilitation programs, growing export-oriented packaging adhesives manufacturing, and increasing construction sealant applications. The country's construction sector modernization and expanding adhesive production capabilities are supporting demand for trimer acid-based polyamide resins across major industrial regions. Adhesive manufacturers and specialty chemical distributors are establishing comprehensive capabilities to serve both domestic construction markets and European export opportunities.
Revenue from trimer acid in India is expanding at a CAGR of 5.8%, supported by the country's rapidly expanding electric vehicle supply-chain adhesives requirements and explosive growth in flexible packaging hot-melts driven by consumer goods sector expansion and e-commerce development. India's automotive sector transformation and packaging industry growth are driving demand for advanced adhesive solutions. Major adhesive manufacturers and chemical importers are establishing distribution networks to address growing demand for specialty polyamide resins.
Revenue from trimer acid in Germany is expanding at a CAGR of 5.1%, driven by the country's automotive lightweighting adhesives innovation, REACH-aligned low-VOC sealant development, and precision specialty chemical manufacturing capabilities. Germany's automotive excellence and regulatory leadership are driving sophisticated trimer acid-based polyamide capabilities throughout industrial sectors. Leading adhesive manufacturers and automotive suppliers are establishing comprehensive programs for next-generation structural bonding technologies.
Revenue from trimer acid in China is expanding at a CAGR of 4.9%, supported by the country's massive construction activity, expanding electronics coatings sector, and advantageous domestic crude tall oil availability from pulp and paper operations. China's construction scale and manufacturing infrastructure are driving demand for trimer acid-based specialty chemicals. Chemical manufacturers and adhesive producers are investing in production capabilities to serve rapidly growing domestic markets.
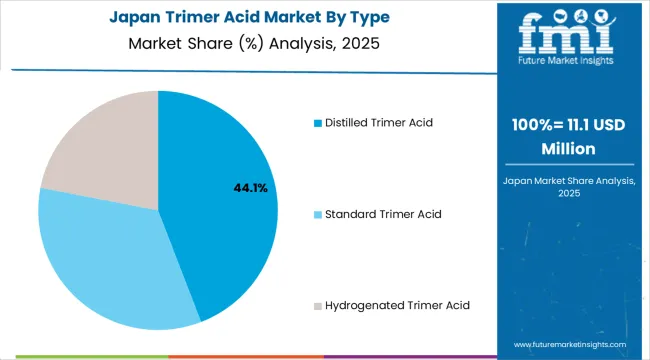
Revenue from trimer acid in Japan is expanding at a CAGR of 4.7%, supported by the country's demand for high-specification inks and electronics coatings, precision adhesive applications, and strong emphasis on innovation despite mature market conditions. Japan's quality standards and technological sophistication are driving demand for ultra-pure trimer acid products. Leading specialty chemical companies are investing in advanced applications for premium market segments.
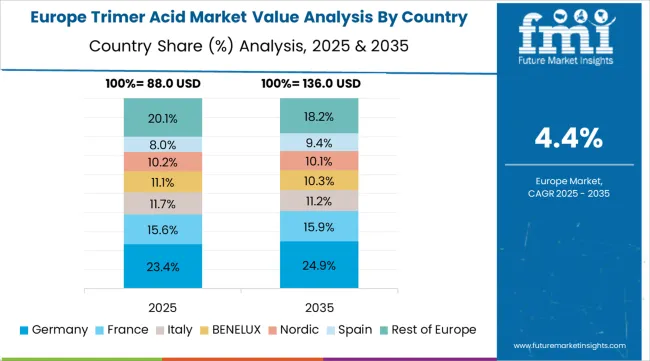
The trimer acid market in Europe is projected to grow from USD 76.3 million in 2025 to USD 118.5 million by 2035, registering a CAGR of 4.4% over the forecast period. Germany leads with a 35.6% market share in 2025, moderating to 34.8% by 2035, supported by automotive adhesives demand and REACH-driven low free-acid specifications.
The United Kingdom follows at 19.0% in 2025, easing to 18.7% by 2035 on continued adoption in construction sealants and hot-melt packaging adhesives. France holds 15.5% in 2025, rising to 15.8% by 2035 with coatings and façade systems applications. Spain accounts for 13.0% in 2025, edging to 13.3% by 2035 as infrastructure refurbishments expand. Italy stands at 9.0% in 2025, stable at 9.1% by 2035 on specialty inks and leather adhesives. The Netherlands maintains 4.0% in 2025, inching to 4.1% by 2035 with packaging hot-melts and chemical tolling operations. The Rest of Europe region, including Nordics and Central &Eastern Europe, retains 3.9% by 2035, reflecting gradual uptake in industrial sealants applications.
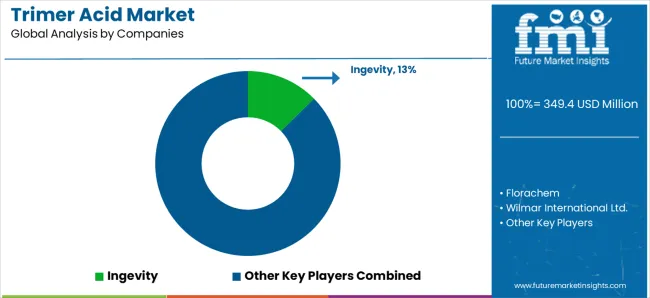
The trimer acid market is characterized by competition among established tall oil processors, integrated forest products companies, and specialized oleochemical manufacturers. Companies are investing in advanced distillation technology development, ultra-low free-acid production capabilities, sustainable feedstock sourcing, and comprehensive technical support services to deliver high-purity, bio-based, and performance-optimized trimer acid solutions. Innovation in selective hydrogenation methods, molecular weight control technologies, and renewable feedstock processing is central to strengthening market position and competitive advantage.
Ingevity leads the market with a 12.8% share, offering comprehensive trimer acid solutions with a focus on tall oil-derived products, advanced distillation capabilities, and specialty grades serving adhesive, coating, and drilling fluid applications. Kraton Pine Chemicals recently exited Dover, Ohio dimer and polyamide lines in May 2025 to redeploy capital into core tall oil assets, supporting portfolio refocus on trimer-grade feedstock production. Oleon NV commissioned a new reactor at Ertvelde in Q1 2024, effectively doubling dimer and trimer capacity for coatings and lubricant grades.
Florachem provides bio-based specialty chemicals with emphasis on sustainable sourcing and technical innovation. Wilmar International Ltd. delivers integrated oleochemical solutions with comprehensive feedstock capabilities. Merck KGaA offers specialty chemical products with focus on high-purity applications. Jiangsu Jinqiao Oleo Technology Co. Ltd. specializes in Asian market production with competitive pricing. Fuzhou Zhongde Energy Co., Ltd. focuses on regional supply capabilities. HUPC Global Chemical provides comprehensive trimer acid offerings. RX Chemicals emphasizes specialty derivatives and custom formulations. The ECHA REACH SVHC list expansion in January 2025 tightened sealant chemistries, prompting European converters to increase pull for distilled trimer acid with lower free-acid specifications.
Trimer acid represents a specialized bio-based polycarboxylic acid segment within adhesive, coating, and specialty chemical applications, projected to grow from USD 349.4 million in 2025 to USD 563.7 million by 2035 at a 4.9% CAGR. These renewable C54 oligomeric fatty acids-primarily derived from tall oil fatty acids through thermal oligomerization and available in distilled, standard, and hydrogenated forms-serve as critical building blocks for reactive polyamide resins used in hot-melt adhesives, construction sealants, industrial coatings, and oilfield drilling fluid additives where flexibility, chemical resistance, and bio-based content are essential. Market expansion is driven by increasing sustainable construction activity, growing REACH compliance requirements for low free-acid formulations, expanding bio-based adhesive adoption, and rising demand for renewable specialty chemicals across diverse industrial and consumer product segments.
| Items | Values |
|---|---|
| Quantitative Units (2025) | USD 349.4 million |
| Type | Distilled Trimer Acid, Standard Trimer Acid, Hydrogenated Trimer Acid |
| Application | Adhesives &Sealants, Inks &Coatings, Drilling Fluids, Others |
| Feedstock Source | Tall-Oil Fatty Acids, Vegetable Oils, Other Sources |
| Regions Covered | North America, Europe, East Asia, South Asia, Latin America, Middle East &Africa |
| Countries Covered | Brazil, United States, Spain, India, Germany, China, Japan, and 40+ countries |
| Key Companies Profiled | Ingevity, Florachem, Wilmar International Ltd., Merck KGaA, Oleon NV, Kraton Pine Chemicals |
| Additional Attributes | Dollar sales by type, application, and feedstock source category, regional demand trends, competitive landscape, technological advancements in distillation and purification, REACH compliance innovation, and bio-based specialty chemical development |
The global trimer acid market is estimated to be valued at USD 349.4 million in 2025.
The market size for the trimer acid market is projected to reach USD 563.7 million by 2035.
The trimer acid market is expected to grow at a 4.9% CAGR between 2025 and 2035.
The key product types in trimer acid market are distilled trimer acid, standard trimer acid and hydrogenated trimer acid.
In terms of application, adhesives & sealants segment to command 29.3% share in the trimer acid market in 2025.


Full Research Suite comprises of:
Market outlook & trends analysis
Interviews & case studies
Strategic recommendations
Vendor profiles & capabilities analysis
5-year forecasts
8 regions and 60+ country-level data splits
Market segment data splits
12 months of continuous data updates
DELIVERED AS:
PDF EXCEL ONLINE
Acid Resistant Pipe Market Forecast and Outlook 2025 to 2035
Acid Coil Cleaner Market Size and Share Forecast Outlook 2025 to 2035
Acid Filling and Leveling Machine Market Size and Share Forecast Outlook 2025 to 2035
Acid Chlorides Market Size and Share Forecast Outlook 2025 to 2035
Acid-Sensitive APIs Market Analysis - Size, Share, and Forecast Outlook 2025 to 2035
Acidified Whey Protein Market Analysis - Size, Share & Trends 2025 to 2035
Acid Dyes Market Growth - Trends & Forecast 2025 to 2035
Acidity Regulator Market Growth - Trends & Forecast 2025 to 2035
Acid Proof Lining Market Trends 2025 to 2035
Acid Citrate Dextrose Tube Market Trends – Growth & Industry Outlook 2024-2034
Acid Orange Market
Antacids Market Analysis – Size, Trends & Forecast 2025 to 2035
Lead Acid Battery Market Size and Share Forecast Outlook 2025 to 2035
Lead Acid Battery Recycling Market Size and Share Forecast Outlook 2025 to 2035
Feed Acidifier Market Analysis Size Share and Forecast Outlook 2025 to 2035
Food Acidulants Market Growth - Key Trends, Size & Forecast 2024 to 2034
Boric Acid Market Forecast and Outlook 2025 to 2035
Folic Acid Market Size and Share Forecast Outlook 2025 to 2035
Oleic Acid Market Size and Share Forecast Outlook 2025 to 2035
Dimer Acid-based (DABa) Polyamide Resin Market Size and Share Forecast Outlook 2025 to 2035

Thank you!
You will receive an email from our Business Development Manager. Please be sure to check your SPAM/JUNK folder too.
Chat With
MaRIA