Ultrasonic Cleaning Market Size and Share Forecast Outlook 2025 to 2035

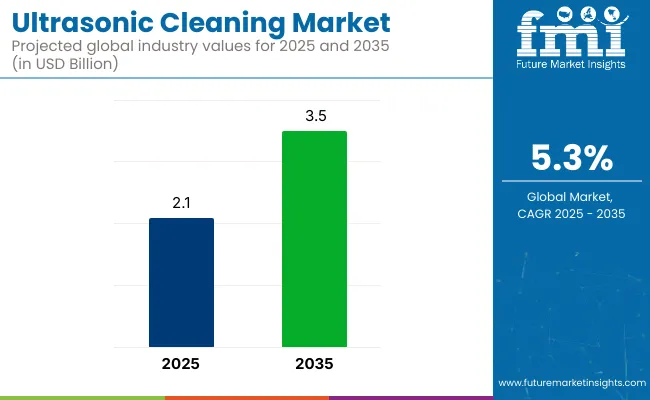
The global ultrasonic cleaning market is valued at USD 2.1 billion in 2025 and is expected to reach USD 3.5 billion by 2035, reflecting a CAGR of 5.3%. Growth is being driven by the rising need for precision cleaning in electronics, automotive, and medical device industries.
Quick Stats for Ultrasonic Cleaning Market

  • Market Value (2025): USD 2.1 billion
  • Forecast Value (2035): USD 3.5 billion
  • Forecast CAGR: 5.3%
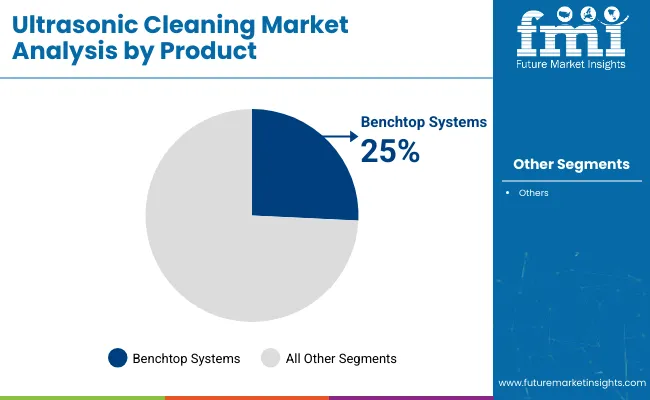
  • Product Leader in 2025: Benchtop Ultrasonic Cleaning Systems (over 25% Market Share)
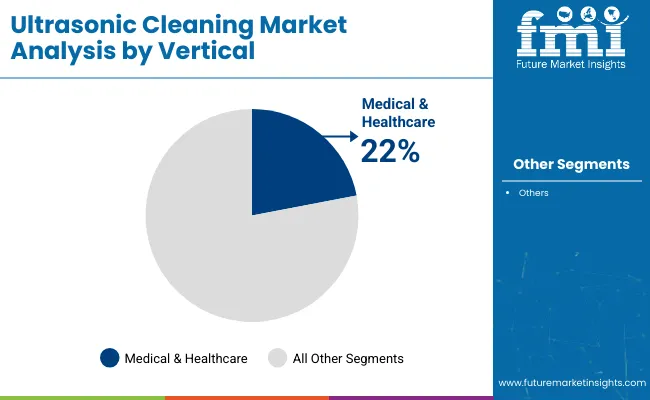
  • Top Vertical: Medical & Healthcare (22% Market Share)
  • Key Growth Region:Europe (fastest-growing market in Germany with 5.5% CAGR)
Metric Value
Estimated Size (2025) USD 2.1 billion
Projected Value (2035) USD 3.5 billion
CAGR (2025 to 2035) 5.3%

Increasing regulatory standards related to contamination control and environmental safety are expected to enhance the adoption of ultrasonic cleaning solutions. Furthermore, advancements in programmable and AI-based ultrasonic systems are being leveraged to achieve uniform cleaning in semiconductors, aerospace components, and medical instruments.

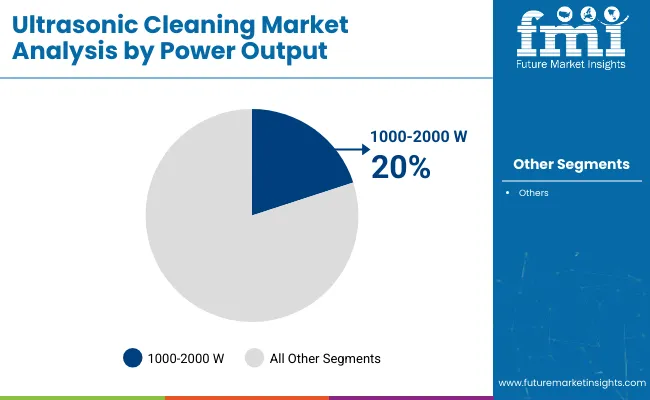
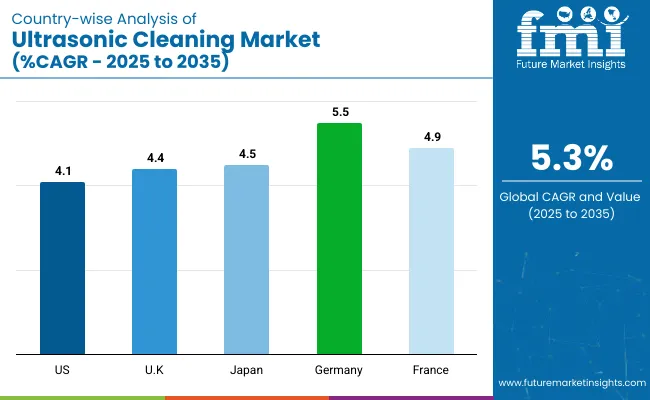
North America is expected to be the largest market, with the USA growing at a significant CAGR of 4.1%. Meanwhile, Europe is also witnessing rapid expansion, with Germany and France growing rapidly with CAGRs of 5.5% and 4.9% respectively. The 1000-2000 W power output segment accounts for 20% of the market share.

Meanwhile, by product, the benchtop ultrasonic cleaning systems hold the largest share of over 25%. Medical and healthcare verticals continue to lead the market with extensive adoption for surgical tool sterilization, with a prominent share of 22%.

Emerson Electric Co. is witnessing considerable profits driven by its automation-integrated ultrasonic systems portfolio, while smaller regional players in Asia-Pacific are facing challenges due to high capital investment requirements and fluctuating transducer material prices.

Germany and the UK are gaining success through strong sustainability policies promoting eco-friendly cleaning solvents. In contrast, Asia-Pacific countries, including India and China, are focusing on affordable high-volume production to overcome cost barriers. Government regulations such as the EU Green Cleaning Directive and EPA solvent disposal rules in the USA are reshaping the competitive landscape.

The market holds a notable share across its parent markets due to its precision and eco-friendly cleaning capabilities. Within the precision cleaning equipment market, it accounts for approximately 30-35%, given its dominance in delicate component cleaning. In the medical cleaning equipment market, its share is around 25%, driven by demand for sterile and residue-free instruments.

It captures 20-22% of the Electronics cleaning equipment market, especially for PCB and semiconductor cleaning. In the industrial cleaning equipment market, it contributes roughly 10-12%. Overall, ultrasonic cleaning is a critical segment where precision, speed, and non-abrasive methods are essential across industries.

Analyzing Ultrasonic Cleaning Market by Top Investment Segments

The ultrasonic cleaning market has been segmented by product (benchtop, standalone, multistage-2, multistage-4), by power output (up to 250 W, 250-500 W, 500-1000 W, 1000-2000 W, 2000-5000 W, 5000-10000 W, more than 10000 W), by capacity (up to 5L, 10-50L, 50-100L, 100-150L, 150-200L, 200-250L, 250-300L, more than 300L), by vertical (medical & healthcare, automobile, aerospace, optics, metal & machinery, electrical & electronics, food & beverage, jewelry & gems, pharmaceuticals, others (including marine and textile cleaning)), and by region (North America, Latin America, Europe, Asia Pacific, MEA).

By Product, Benchtop Systems Hold over 25% of the Market Share

Benchtop ultrasonic cleaning systems are expected to maintain their leading position with a share of over 25% by 2035. This dominance is attributed to their compactness, cost-effectiveness, and high adaptability in laboratories, dental clinics, and small-scale industrial settings. The multistage-4 systems segment is also witnessing rising demand for use in aerospace and electronics manufacturing lines due to their automated programmable cleaning capabilities, which enhance precision and operational throughput for sensitive components.
  • Benchtop systems cater to diverse end-use industries
  • Multistage-4 systems used in semiconductor and aerospace cleaning
  • Standalone systems preferred in mid-size industrial units
  • Demand driven by compactness and low maintenance requirements

By Power Output, the 1000-2000 W Segment Accounts for 20% of the Market Share

The 1000-2000 W segment is projected to grow rapidly and hold nearly 20% market share by 2035, driven by increasing applications in automotive parts degreasing, PCB cleaning, and medical device sterilization. The 500-1000 W segment remains significant, while systems above 5000 W are being adopted in heavy industrial cleaning. High-power ultrasonic systems are gaining traction for their ability to clean complex geometries efficiently within reduced operational cycles.
  • Suitable for automotive engines and precision machined parts
  • Increasing demand from semiconductor manufacturing lines
  • Higher adoption of high-power systems in aerospace maintenance
  • Cost and energy efficiency remain major purchasing factors

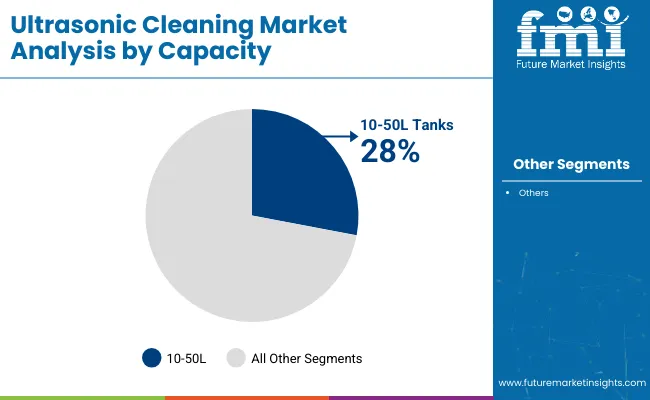
By Capacity, 10-50L Tanks Account for 28% of the Market Share

The 10-50L capacity segment is anticipated to maintain its leading position with over 28% share by 2035, driven by widespread use in medical, automotive, and electronics sectors. These tanks are ideal for mid-sized batch cleaning operations and point-of-use cleaning in laboratories and hospitals. The 100-150L and 150-200L capacity segments are witnessing growing demand from the aerospace and metal machinery industries for large-component cleaning applications.
  • Ideal for batch cleaning in healthcare and automotive
  • Larger tanks (>300L) used in industrial bulk cleaning
  • Increasing adoption of multi-stage solutions for high throughput
  • Demand driven by hygiene standards and contamination control

By Vertical, the Medical & Healthcare Segment Accounts for 22% of the Market Share

The medical & healthcare segment is projected to retain its leading position with a market share of nearly 22% by 2035. This is due to stringent sterilization standards for surgical tools, dental instruments, and diagnostic devices. The electrical & electronics segment is growing rapidly, driven by semiconductor manufacturing, while aerospace and automotive industries continue to adopt ultrasonic cleaning for engine components, fuel injectors, and precision parts.
  • Extensive use in sterilizing surgical instruments and dental tools
  • Electronics sector growth driven by PCB and microchip cleaning
  • Aerospace is adopting high-frequency units for engine servicing
  • Rising hygiene and safety regulations are driving market expansion

Top Ultrasonic Cleaning Market Dynamics

Recent Trends in the Ultrasonic Cleaning Market

  • AI-integrated programmable ultrasonic systems are being adopted for precision cleaning in semiconductors and medical devices.
  • Demand for biodegradable and eco-friendly ultrasonic cleaning solvents is rising due to strict environmental regulations.
  • Multi-frequency ultrasonic cleaning technology is being utilized to enhance cleaning efficiency across the aerospace and electronics industries.
  • Affordable benchtop ultrasonic cleaning units are gaining traction in emerging economies for laboratory and dental applications.

Challenges in the Ultrasonic Cleaning Market
  • High initial capital investment is restricting the adoption of large industrial ultrasonic cleaning systems.
  • Fluctuating raw material prices for transducers are creating cost pressures on manufacturers.
  • Lack of skilled technicians in Asia-Pacific is limiting the maintenance and servicing of advanced ultrasonic systems.
  • Stringent regulatory approvals for new ultrasonic cleaning chemicals and equipment are delaying market expansion.

Analyzing Top Countries Manufacturing and Supplying Ultrasonic Cleaning Solutions

Germany leads the ultrasonic cleaning market among the listed countries with a projected CAGR of 5.5%, driven by strict VOC regulations and adoption in precision industries. France follows at 4.9%, supported by green legislation and aerospace automation. Japan ranks third with 4.5%, fueled by compact and efficient cleaning unit demand in healthcare.

The UK shows a 4.4% CAGR, driven by medical standards and sustainable practices, while the USA grows at 4.1%, influenced by EPA regulations and AI integration. Overall, Europe dominates with environmentally-driven growth, while Japan and the USA focus on healthcare and semiconductor cleaning innovations.

The report covers in-depth analysis of 40+ countries; five top-performing OECD countries are highlighted below.

USA Ultrasonic Cleaning Market Analysis

The ultrasonic cleaning demand in the USA is projected to grow at a CAGR of 4.1% from 2025 to 2035. Growth is being driven by stringent EPA solvent disposal regulations and rising demand in aerospace, automotive, and semiconductor sectors. High adoption of AI-integrated ultrasonic cleaning systems is being observed to improve precision and operational efficiency, despite concerns around semiconductor supply chain disruptions.

  • Growing use of ultrasonic cleaning in semiconductor fabrication facilities.
  • Strong regulatory push for eco-friendly cleaning technologies.
  • Increasing OEM partnerships in aerospace and medical sectors.

Ultrasonic Cleaning Demand Analysis in the UK

The ultrasonic cleaning solution sales in the UK is estimated to grow at a CAGR of 4.4% from 2025 to 2035. UK REACH regulations and medical device sterilization standards are encouraging the adoption of eco-friendly ultrasonic systems. A trend towards localized manufacturing and biodegradable cleaning solvents is being observed, although Brexit-related import duties are posing challenges for cost structures within the industry.

  • Rising demand for low-energy ultrasonic solutions in healthcare.
  • Increasing focus on sustainable and biodegradable cleaning agents.
  • Strengthening of manufacturer partnerships with regional OEMs.

Ultrasonic Cleaning Demand Analysis in Germany

The ultrasonic cleaning market in Germany is expected to expand at a CAGR of 5.5% from 2025 to 2035. Stringent BImSchG VOC emission regulations and TÜV certifications are driving the adoption of AI-driven energy-efficient ultrasonic systems, particularly in the automotive and electronics industries. High operational costs remain a challenge, but investments in intelligent and predictive ultrasonic cleaning technologies are being prioritized.

  • Strong growth in automotive and precision engineering applications.
  • Rising investments in predictive maintenance ultrasonic solutions.
  • Strict environmental policies are accelerating technology upgrades.

Ultrasonic Cleaning Sales Analysis in France

The ultrasonic cleaning market in France is projected to grow at a CAGR of 4.9% from 2025 to 2035. Growth is being propelled by ANSM medical sterilization regulations and the Green Industry Bill, encouraging eco-friendly solutions. Aerospace applications are seeing increased investments in automated ultrasonic systems, although high equipment costs are limiting adoption among small and medium enterprises.

  • Growing aerospace sector investments in ultrasonic cleaning automation.
  • Increasing demand for multi-frequency AI-based cleaning systems.
  • Government sustainability initiatives supporting green cleaning technologies.

Japan Ultrasonic Cleaning Market Analysis

The ultrasonic cleaning market revenue in Japan is anticipated to grow at a CAGR of 4.5% from 2025 to 2035. Growth is driven by PMDA medical device regulations and the need for high-precision cleaning in manufacturing. Adoption of small, efficient ultrasonic cleaning units is being expanded despite cost pressures and slow technology uptake compared to other advanced markets.

  • Rising use in medical device sterilization and diagnostics cleaning.
  • Growing demand for compact, energy-efficient ultrasonic units.
  • Gradual integration of robotics with ultrasonic cleaning systems.

Leading Ultrasonic Cleaning Suppliers

The ultrasonic cleaning market is moderately consolidated, with global leaders accounting for a significant portion of revenues while regional players remain competitive in niche applications. Companies such as Branson Ultrasonic Corporation, Crest Ultrasonics, and Telsonic AG Group are competing through product innovation, pricing flexibility, and strategic OEM partnerships across the medical, semiconductor, and aerospace sectors.

Top companies are focusing on integrating automation, AI-enabled programmable systems, and eco-friendly cleaning technologies to address rising environmental regulations and demand for operational efficiency. Expansion of regional manufacturing footprints, mergers with local distributors, and the development of energy-efficient transducer materials are among the core strategies.

Firms like Branson Ultrasonics and Crest Ultrasonics are investing heavily in AI-driven high-frequency systems, while companies such as Telsonic AG and Elma Schmidbauer are strengthening their sustainable solutions portfolio to comply with stricter European regulations.

Recent Ultrasonic Cleaning Market News

In March 2023, Telsonic announced the expansion of its North American operations with new acquisition of Leading Edge Engineering.

Ultrasonic Cleaning Market Report Scope

Report Attributes Details
Current Total Market Size (2025) USD 2.1 billion
Projected Market Size (2035) USD 3.5 billion
CAGR (2025 to 2035) 5.3%
Base Year for Estimation 2024
Historical Period 2020 to 2024
Projections Period 2025 to 2035
Market Analysis Parameters Revenue in USD billions /Volume in units
By Product Benchtop, Standalone, Multistage-2, Multistage-4
By Power Output Up to 250 W, 250-500 W, 500-1000 W, 1000-2000 W, 2000-5000 W, 5000-10000 W, More than 10000 W
By Capacity Up to 5L, 10-50L, 50-100L, 100-150L, 150-200L, 200-250L, 250-300L, More than 300L
By Vertical Medical & Healthcare, Automobile, Aerospace, Optics, Metal & Machinery, Electrical & Electronics, Food & Beverage, Jewelry & Gems, Pharmaceuticals, Others (including marine and textile cleaning)
Regions Covered North America, Latin America, Europe, Asia Pacific, Middle East & Africa
Countries Covered United States, United Kingdom, Germany, France, Japan, China, India, South Korea, Australia
Key Players Branson Ultrasonic Corporation, Cleaning Technologies Group, Telsonic AG Group, Omegasonics , Kemet International Limited, Morantz Ultrasonics , Mettler Electronics Corp., SharperTek , Blue Wave Ultrasonics , Crest Ultrasonics Corporation, GuangDong GT Ultrasonic Co., Ltd, TierraTech , KKS Ultraschall AG, Elma Schmidbauer GmbH, FinnSonic Oy, Sonic Systems Inc.
Additional Attributes Dollar sales by value, market share analysis by region, country-wise analysis, and competitive landscape insights

Key Segmentation

By Product:

The industry is segmented into benchtop, standalone, multistage-2, and multistage-4.

By Power:

Output it is segmented into up to 250 W, 250-500 W, 500-1000 W, 1000-2000 W, 2000-5000 W, 5000-10000 W, and more than 10000 W.

By Capacity:

It is segmented up to 5L, 10-50 L, 50-100 L, 100-150 L, 150-200L, 200-250 L, 250-300 L, and more than 300 L.

By Vertical:

It is fragmented into medical & healthcare, automobile, aerospace, optics, metal & machinery, electrical & electronics, food & beverage, jewellery & gems, pharmaceuticals and others.

By Region:

The industry is fragmented among North America, Latin America, Europe, Asia-Pacific, and Middle East & Africa.

Table of Content

  1. Executive Summary
    • Global Market Outlook
    • Demand-side Trends
    • Supply-side Trends
    • Technology Roadmap Analysis
    • Analysis and Recommendations
  2. Market Overview
    • Market Coverage / Taxonomy
    • Market Definition / Scope / Limitations
  3. Market Background
    • Market Dynamics
      • Drivers
      • Restraints
      • Opportunity
      • Trends
    • Scenario Forecast
      • Demand in Optimistic Scenario
      • Demand in Likely Scenario
      • Demand in Conservative Scenario
    • Opportunity Map Analysis
    • Product Life Cycle Analysis
    • Supply Chain Analysis
      • Supply Side Participants and their Roles
        • Producers
        • Mid-Level Participants (Traders/ Agents/ Brokers)
        • Wholesalers and Distributors
      • Value Added and Value Created at Node in the Supply Chain
      • List of Raw Material Suppliers
      • List of Existing and Potential Buyer’s
    • Investment Feasibility Matrix
    • Value Chain Analysis
      • Profit Margin Analysis
      • Wholesalers and Distributors
      • Retailers
    • PESTLE and Porter’s Analysis
    • Regulatory Landscape
      • By Key Regions
      • By Key Countries
    • Regional Parent Market Outlook
    • Production and Consumption Statistics
    • Import and Export Statistics
  4. Global Market Analysis 2020 to 2024 and Forecast, 2025 to 2035
    • Historical Market Size Value (USD Billion) & Volume (Units) Analysis, 2020 to 2024
    • Current and Future Market Size Value (USD Billion) & Volume (Units) Projections, 2025 to 2035
      • Y-o-Y Growth Trend Analysis
      • Absolute $ Opportunity Analysis
  5. Global Market Pricing Analysis 2020 to 2024 and Forecast 2025 to 2035
  6. Global Market Analysis 2020 to 2024 and Forecast 2025 to 2035, By Product
    • Introduction / Key Findings
    • Historical Market Size Value (USD Billion) & Volume (Units) Analysis By Product, 2020 to 2024
    • Current and Future Market Size Value (USD Billion) & Volume (Units) Analysis and Forecast By Product, 2025 to 2035
      • Benchtop
      • Standalone
      • Multistage-2
      • Multistage-4
    • Y-o-Y Growth Trend Analysis By Product, 2020 to 2024
    • Absolute $ Opportunity Analysis By Product, 2025 to 2035
  7. Global Market Analysis 2020 to 2024 and Forecast 2025 to 2035, By Power Output
    • Introduction / Key Findings
    • Historical Market Size Value (USD Billion) & Volume (Units) Analysis By Power Output, 2020 to 2024
    • Current and Future Market Size Value (USD Billion) & Volume (Units) Analysis and Forecast By Power Output, 2025 to 2035
      • Up to 250 W
      • 250-500 W
      • 500-1000 W
      • 1000-2000 W
      • 2000-5000 W
      • 5000-10000 W
      • More than 10000 W
    • Y-o-Y Growth Trend Analysis By Power Output, 2020 to 2024
    • Absolute $ Opportunity Analysis By Power Output, 2025 to 2035
  8. Global Market Analysis 2020 to 2024 and Forecast 2025 to 2035, By Capacity
    • Introduction / Key Findings
    • Historical Market Size Value (USD Billion) & Volume (Units) Analysis By Capacity, 2020 to 2024
    • Current and Future Market Size Value (USD Billion) & Volume (Units) Analysis and Forecast By Capacity, 2025 to 2035
      • Up to 5L
      • 10-50 L
      • 50-100 L
      • 100-150 L
      • 150-200 L
      • 200-250 L
      • 250-300 L
      • More than 300 L
    • Y-o-Y Growth Trend Analysis By Capacity, 2020 to 2024
    • Absolute $ Opportunity Analysis By Capacity, 2025 to 2035
  9. Global Market Analysis 2020 to 2024 and Forecast 2025 to 2035, By Vertical
    • Introduction / Key Findings
    • Historical Market Size Value (USD Billion) & Volume (Units) Analysis By Vertical, 2020 to 2024
    • Current and Future Market Size Value (USD Billion) & Volume (Units) Analysis and Forecast By Vertical, 2025 to 2035
      • Medical & Healthcare
      • Automobile
      • Aerospace
      • Optics
      • Metal & Machinery
      • Electrical & Electronics
      • Food & Beverage
      • Jewelry & Gems
      • Pharmaceuticals
      • Others
    • Y-o-Y Growth Trend Analysis By Vertical, 2020 to 2024
    • Absolute $ Opportunity Analysis By Vertical, 2025 to 2035
  10. Global Market Analysis 2020 to 2024 and Forecast 2025 to 2035, By Region
    • Introduction
    • Historical Market Size Value (USD Billion) & Volume (Units) Analysis By Region, 2020 to 2024
    • Current Market Size Value (USD Billion) & Volume (Units) Analysis and Forecast By Region, 2025 to 2035
      • North America
      • Latin America
      • Western Europe
      • Eastern Europe
      • East Asia
      • South Asia & Pacific
      • Middle East and Africa
    • Market Attractiveness Analysis By Region
  11. North America Market Analysis 2020 to 2024 and Forecast 2025 to 2035, By Country
    • Historical Market Size Value (USD Billion) & Volume (Units) Trend Analysis By Market Taxonomy, 2020 to 2024
    • Market Size Value (USD Billion) & Volume (Units) Forecast By Market Taxonomy, 2025 to 2035
      • By Country
        • USA
        • Canada
        • Mexico
      • By Product
      • By Power Output
      • By Capacity
      • By Vertical
    • Market Attractiveness Analysis
      • By Country
      • By Product
      • By Power Output
      • By Capacity
      • By Vertical
    • Key Takeaways
  12. Latin America Market Analysis 2020 to 2024 and Forecast 2025 to 2035, By Country
    • Historical Market Size Value (USD Billion) & Volume (Units) Trend Analysis By Market Taxonomy, 2020 to 2024
    • Market Size Value (USD Billion) & Volume (Units) Forecast By Market Taxonomy, 2025 to 2035
      • By Country
        • Brazil
        • Argentina
        • Rest of LATAM
      • By Product
      • By Power Output
      • By Capacity
      • By Vertical
    • Market Attractiveness Analysis
      • By Country
      • By Product
      • By Power Output
      • By Capacity
      • By Vertical
    • Key Takeaways
  13. Western Europe Market Analysis 2020 to 2024 and Forecast 2025 to 2035, By Country
    • Historical Market Size Value (USD Billion) & Volume (Units) Trend Analysis By Market Taxonomy, 2020 to 2024
    • Market Size Value (USD Billion) & Volume (Units) Forecast By Market Taxonomy, 2025 to 2035
      • By Country
        • Germany
        • Italy
        • France
        • UK
        • Spain
        • BENELUX
        • Nordic
        • Rest of W.Europe
      • By Product
      • By Power Output
      • By Capacity
      • By Vertical
    • Market Attractiveness Analysis
      • By Country
      • By Product
      • By Power Output
      • By Capacity
      • By Vertical
    • Key Takeaways
  14. Eastern Europe Market Analysis 2020 to 2024 and Forecast 2025 to 2035, By Country
    • Historical Market Size Value (USD Billion) & Volume (Units) Trend Analysis By Market Taxonomy, 2020 to 2024
    • Market Size Value (USD Billion) & Volume (Units) Forecast By Market Taxonomy, 2025 to 2035
      • By Country
        • Russia
        • Hungary
        • Poland
        • Balkan & Baltics
        • Rest of E. Europe
      • By Product
      • By Power Output
      • By Capacity
      • By Vertical
    • Market Attractiveness Analysis
      • By Country
      • By Product
      • By Power Output
      • By Capacity
      • By Vertical
    • Key Takeaways
  15. East Asia Market Analysis 2020 to 2024 and Forecast 2025 to 2035, By Country
    • Historical Market Size Value (USD Billion) & Volume (Units) Trend Analysis By Market Taxonomy, 2020 to 2024
    • Market Size Value (USD Billion) & Volume (Units) Forecast By Market Taxonomy, 2025 to 2035
      • By Country
        • China
        • Japan
        • South Korea
      • By Product
      • By Power Output
      • By Capacity
      • By Vertical
    • Market Attractiveness Analysis
      • By Country
      • By Product
      • By Power Output
      • By Capacity
      • By Vertical
    • Key Takeaways
  16. South Asia & Pacific Market Analysis 2020 to 2024 and Forecast 2025 to 2035, By Country
    • Historical Market Size Value (USD Billion) & Volume (Units) Trend Analysis By Market Taxonomy, 2020 to 2024
    • Market Size Value (USD Billion) & Volume (Units) Forecast By Market Taxonomy, 2025 to 2035
      • By Country
        • India
        • Australia & New Zealand
        • ASEAN
        • Rest of SAP
      • By Product
      • By Power Output
      • By Capacity
      • By Vertical
    • Market Attractiveness Analysis
      • By Country
      • By Product
      • By Power Output
      • By Capacity
      • By Vertical
    • Key Takeaways
  17. Middle East and Africa Market Analysis 2020 to 2024 and Forecast 2025 to 2035, By Country
    • Historical Market Size Value (USD Billion) & Volume (Units) Trend Analysis By Market Taxonomy, 2020 to 2024
    • Market Size Value (USD Billion) & Volume (Units) Forecast By Market Taxonomy, 2025 to 2035
      • By Country
        • GCC Countries
        • Northern Africa
        • South Africa
        • Turkiye
        • Rest of MEA
      • By Product
      • By Power Output
      • By Capacity
      • By Vertical
    • Market Attractiveness Analysis
      • By Country
      • By Product
      • By Power Output
      • By Capacity
      • By Vertical
    • Key Takeaways
  18. Key Countries Market Analysis
    • USA
      • Pricing Analysis
      • Market Share Analysis, 2024
        • By Product
        • By Power Output
        • By Capacity
        • By Vertical
    • Canada
      • Pricing Analysis
      • Market Share Analysis, 2024
        • By Product
        • By Power Output
        • By Capacity
        • By Vertical
    • Brazil
      • Pricing Analysis
      • Market Share Analysis, 2024
        • By Product
        • By Power Output
        • By Capacity
        • By Vertical
    • Mexico
      • Pricing Analysis
      • Market Share Analysis, 2024
        • By Product
        • By Power Output
        • By Capacity
        • By Vertical
    • Argentina
      • Pricing Analysis
      • Market Share Analysis, 2024
        • By Product
        • By Power Output
        • By Capacity
        • By Vertical
  19. Market Structure Analysis
    • Competition Dashboard
    • Competition Benchmarking
    • Market Share Analysis of Top Players
      • By Regional
      • By Product
      • By Power Output
      • By Capacity
      • By Vertical
  20. Competition Analysis
    • Competition Deep Dive
      • Branson Ultrasonic Corporation
        • Overview
        • Product Portfolio
        • Profitability by Market Segments (Product/Age /Sales Channel/Region)
        • Sales Footprint
        • Strategy Overview
          • Marketing Strategy
          • Product Strategy
          • Channel Strategy
      • Cleaning Technologies Group
        • Overview
        • Product Portfolio
        • Profitability by Market Segments (Product/Age /Sales Channel/Region)
        • Sales Footprint
        • Strategy Overview
          • Marketing Strategy
          • Product Strategy
          • Channel Strategy
      • Telsonic AG Group
        • Overview
        • Product Portfolio
        • Profitability by Market Segments (Product/Age /Sales Channel/Region)
        • Sales Footprint
        • Strategy Overview
          • Marketing Strategy
          • Product Strategy
          • Channel Strategy
      • Omegasonics
        • Overview
        • Product Portfolio
        • Profitability by Market Segments (Product/Age /Sales Channel/Region)
        • Sales Footprint
        • Strategy Overview
          • Marketing Strategy
          • Product Strategy
          • Channel Strategy
      • Kemet International Limited
        • Overview
        • Product Portfolio
        • Profitability by Market Segments (Product/Age /Sales Channel/Region)
        • Sales Footprint
        • Strategy Overview
          • Marketing Strategy
          • Product Strategy
          • Channel Strategy
      • Morantz Ultrasonics
        • Overview
        • Product Portfolio
        • Profitability by Market Segments (Product/Age /Sales Channel/Region)
        • Sales Footprint
        • Strategy Overview
          • Marketing Strategy
          • Product Strategy
          • Channel Strategy
      • Mettler Electronics Corp.
        • Overview
        • Product Portfolio
        • Profitability by Market Segments (Product/Age /Sales Channel/Region)
        • Sales Footprint
        • Strategy Overview
          • Marketing Strategy
          • Product Strategy
          • Channel Strategy
      • SharperTek
        • Overview
        • Product Portfolio
        • Profitability by Market Segments (Product/Age /Sales Channel/Region)
        • Sales Footprint
        • Strategy Overview
          • Marketing Strategy
          • Product Strategy
          • Channel Strategy
      • Blue Wave Ultrasonics
        • Overview
        • Product Portfolio
        • Profitability by Market Segments (Product/Age /Sales Channel/Region)
        • Sales Footprint
        • Strategy Overview
          • Marketing Strategy
          • Product Strategy
          • Channel Strategy
      • Crest Ultrasonics Corporation
        • Overview
        • Product Portfolio
        • Profitability by Market Segments (Product/Age /Sales Channel/Region)
        • Sales Footprint
        • Strategy Overview
          • Marketing Strategy
          • Product Strategy
          • Channel Strategy
      • GuangDong GT Ultrasonic Co., Ltd
        • Overview
        • Product Portfolio
        • Profitability by Market Segments (Product/Age /Sales Channel/Region)
        • Sales Footprint
        • Strategy Overview
          • Marketing Strategy
          • Product Strategy
          • Channel Strategy
      • TierraTech
        • Overview
        • Product Portfolio
        • Profitability by Market Segments (Product/Age /Sales Channel/Region)
        • Sales Footprint
        • Strategy Overview
          • Marketing Strategy
          • Product Strategy
          • Channel Strategy
      • KKS Ultraschall AG
        • Overview
        • Product Portfolio
        • Profitability by Market Segments (Product/Age /Sales Channel/Region)
        • Sales Footprint
        • Strategy Overview
          • Marketing Strategy
          • Product Strategy
          • Channel Strategy
      • Elma Schmidbauer GmbH
        • Overview
        • Product Portfolio
        • Profitability by Market Segments (Product/Age /Sales Channel/Region)
        • Sales Footprint
        • Strategy Overview
          • Marketing Strategy
          • Product Strategy
          • Channel Strategy
      • FinnSonic Oy
        • Overview
        • Product Portfolio
        • Profitability by Market Segments (Product/Age /Sales Channel/Region)
        • Sales Footprint
        • Strategy Overview
          • Marketing Strategy
          • Product Strategy
          • Channel Strategy
      • Sonic Systems Inc.
        • Overview
        • Product Portfolio
        • Profitability by Market Segments (Product/Age /Sales Channel/Region)
        • Sales Footprint
        • Strategy Overview
          • Marketing Strategy
          • Product Strategy
          • Channel Strategy
  21. Assumptions & Acronyms Used
  22. Research Methodology

List of Tables

  • Table 1: Global Market Value (USD Billion) Forecast by Region, 2020-2035
  • Table 2: Global Market Volume (Units) Forecast by Region, 2020-2035
  • Table 3: Global Market Value (USD Billion) Forecast by Product, 2020-2035
  • Table 4: Global Market Volume (Units) Forecast by Product, 2020-2035
  • Table 5: Global Market Value (USD Billion) Forecast by Power Output, 2020-2035
  • Table 6: Global Market Volume (Units) Forecast by Power Output, 2020-2035
  • Table 7: Global Market Value (USD Billion) Forecast by Capacity, 2020-2035
  • Table 8: Global Market Volume (Units) Forecast by Capacity, 2020-2035
  • Table 9: Global Market Value (USD Billion) Forecast by Vertical, 2020-2035
  • Table 10: Global Market Volume (Units) Forecast by Vertical, 2020-2035
  • Table 11: North America Market Value (USD Billion) Forecast by Country, 2020-2035
  • Table 12: North America Market Volume (Units) Forecast by Country, 2020-2035
  • Table 13: North America Market Value (USD Billion) Forecast by Product, 2020-2035
  • Table 14: North America Market Volume (Units) Forecast by Product, 2020-2035
  • Table 15: North America Market Value (USD Billion) Forecast by Power Output, 2020-2035
  • Table 16: North America Market Volume (Units) Forecast by Power Output, 2020-2035
  • Table 17: North America Market Value (USD Billion) Forecast by Capacity, 2020-2035
  • Table 18: North America Market Volume (Units) Forecast by Capacity, 2020-2035
  • Table 19: North America Market Value (USD Billion) Forecast by Vertical, 2020-2035
  • Table 20: North America Market Volume (Units) Forecast by Vertical, 2020-2035
  • Table 21: Latin America Market Value (USD Billion) Forecast by Country, 2020-2035
  • Table 22: Latin America Market Volume (Units) Forecast by Country, 2020-2035
  • Table 23: Latin America Market Value (USD Billion) Forecast by Product, 2020-2035
  • Table 24: Latin America Market Volume (Units) Forecast by Product, 2020-2035
  • Table 25: Latin America Market Value (USD Billion) Forecast by Power Output, 2020-2035
  • Table 26: Latin America Market Volume (Units) Forecast by Power Output, 2020-2035
  • Table 27: Latin America Market Value (USD Billion) Forecast by Capacity, 2020-2035
  • Table 28: Latin America Market Volume (Units) Forecast by Capacity, 2020-2035
  • Table 29: Latin America Market Value (USD Billion) Forecast by Vertical, 2020-2035
  • Table 30: Latin America Market Volume (Units) Forecast by Vertical, 2020-2035
  • Table 31: Western Europe Market Value (USD Billion) Forecast by Country, 2020-2035
  • Table 32: Western Europe Market Volume (Units) Forecast by Country, 2020-2035
  • Table 33: Western Europe Market Value (USD Billion) Forecast by Product, 2020-2035
  • Table 34: Western Europe Market Volume (Units) Forecast by Product, 2020-2035
  • Table 35: Western Europe Market Value (USD Billion) Forecast by Power Output, 2020-2035
  • Table 36: Western Europe Market Volume (Units) Forecast by Power Output, 2020-2035
  • Table 37: Western Europe Market Value (USD Billion) Forecast by Capacity, 2020-2035
  • Table 38: Western Europe Market Volume (Units) Forecast by Capacity, 2020-2035
  • Table 39: Western Europe Market Value (USD Billion) Forecast by Vertical, 2020-2035
  • Table 40: Western Europe Market Volume (Units) Forecast by Vertical, 2020-2035
  • Table 41: Eastern Europe Market Value (USD Billion) Forecast by Country, 2020-2035
  • Table 42: Eastern Europe Market Volume (Units) Forecast by Country, 2020-2035
  • Table 43: Eastern Europe Market Value (USD Billion) Forecast by Product, 2020-2035
  • Table 44: Eastern Europe Market Volume (Units) Forecast by Product, 2020-2035
  • Table 45: Eastern Europe Market Value (USD Billion) Forecast by Power Output, 2020-2035
  • Table 46: Eastern Europe Market Volume (Units) Forecast by Power Output, 2020-2035
  • Table 47: Eastern Europe Market Value (USD Billion) Forecast by Capacity, 2020-2035
  • Table 48: Eastern Europe Market Volume (Units) Forecast by Capacity, 2020-2035
  • Table 49: Eastern Europe Market Value (USD Billion) Forecast by Vertical, 2020-2035
  • Table 50: Eastern Europe Market Volume (Units) Forecast by Vertical, 2020-2035
  • Table 51: East Asia Market Value (USD Billion) Forecast by Country, 2020-2035
  • Table 52: East Asia Market Volume (Units) Forecast by Country, 2020-2035
  • Table 53: East Asia Market Value (USD Billion) Forecast by Product, 2020-2035
  • Table 54: East Asia Market Volume (Units) Forecast by Product, 2020-2035
  • Table 55: East Asia Market Value (USD Billion) Forecast by Power Output, 2020-2035
  • Table 56: East Asia Market Volume (Units) Forecast by Power Output, 2020-2035
  • Table 57: East Asia Market Value (USD Billion) Forecast by Capacity, 2020-2035
  • Table 58: East Asia Market Volume (Units) Forecast by Capacity, 2020-2035
  • Table 59: East Asia Market Value (USD Billion) Forecast by Vertical, 2020-2035
  • Table 60: East Asia Market Volume (Units) Forecast by Vertical, 2020-2035
  • Table 61: South Asia & Pacific Market Value (USD Billion) Forecast by Country, 2020-2035
  • Table 62: South Asia & Pacific Market Volume (Units) Forecast by Country, 2020-2035
  • Table 63: South Asia & Pacific Market Value (USD Billion) Forecast by Product, 2020-2035
  • Table 64: South Asia & Pacific Market Volume (Units) Forecast by Product, 2020-2035
  • Table 65: South Asia & Pacific Market Value (USD Billion) Forecast by Power Output, 2020-2035
  • Table 66: South Asia & Pacific Market Volume (Units) Forecast by Power Output, 2020-2035
  • Table 67: South Asia & Pacific Market Value (USD Billion) Forecast by Capacity, 2020-2035
  • Table 68: South Asia & Pacific Market Volume (Units) Forecast by Capacity, 2020-2035
  • Table 69: South Asia & Pacific Market Value (USD Billion) Forecast by Vertical, 2020-2035
  • Table 70: South Asia & Pacific Market Volume (Units) Forecast by Vertical, 2020-2035
  • Table 71: Middle East and Africa Market Value (USD Billion) Forecast by Country, 2020-2035
  • Table 72: Middle East and Africa Market Volume (Units) Forecast by Country, 2020-2035
  • Table 73: Middle East and Africa Market Value (USD Billion) Forecast by Product, 2020-2035
  • Table 74: Middle East and Africa Market Volume (Units) Forecast by Product, 2020-2035
  • Table 75: Middle East and Africa Market Value (USD Billion) Forecast by Power Output, 2020-2035
  • Table 76: Middle East and Africa Market Volume (Units) Forecast by Power Output, 2020-2035
  • Table 77: Middle East and Africa Market Value (USD Billion) Forecast by Capacity, 2020-2035
  • Table 78: Middle East and Africa Market Volume (Units) Forecast by Capacity, 2020-2035
  • Table 79: Middle East and Africa Market Value (USD Billion) Forecast by Vertical, 2020-2035
  • Table 80: Middle East and Africa Market Volume (Units) Forecast by Vertical, 2020-2035

List of Figures

  • Figure 1: Global Market Volume (Units) Forecast 2020-2035
  • Figure 2: Global Market Pricing Analysis
  • Figure 3: Global Market Value (USD Billion) Forecast 2020-2035
  • Figure 4: Global Market Value Share and BPS Analysis by Product, 2025 and 2035
  • Figure 5: Global Market Y-o-Y Growth Comparison by Product, 2025-2035
  • Figure 6: Global Market Attractiveness Analysis by Product
  • Figure 7: Global Market Value Share and BPS Analysis by Power Output, 2025 and 2035
  • Figure 8: Global Market Y-o-Y Growth Comparison by Power Output, 2025-2035
  • Figure 9: Global Market Attractiveness Analysis by Power Output
  • Figure 10: Global Market Value Share and BPS Analysis by Capacity, 2025 and 2035
  • Figure 11: Global Market Y-o-Y Growth Comparison by Capacity, 2025-2035
  • Figure 12: Global Market Attractiveness Analysis by Capacity
  • Figure 13: Global Market Value Share and BPS Analysis by Vertical, 2025 and 2035
  • Figure 14: Global Market Y-o-Y Growth Comparison by Vertical, 2025-2035
  • Figure 15: Global Market Attractiveness Analysis by Vertical
  • Figure 16: Global Market Value (USD Billion) Share and BPS Analysis by Region, 2025 and 2035
  • Figure 17: Global Market Y-o-Y Growth Comparison by Region, 2025-2035
  • Figure 18: Global Market Attractiveness Analysis by Region
  • Figure 19: North America Market Incremental $ Opportunity, 2025-2035
  • Figure 20: Latin America Market Incremental $ Opportunity, 2025-2035
  • Figure 21: Western Europe Market Incremental $ Opportunity, 2025-2035
  • Figure 22: Eastern Europe Market Incremental $ Opportunity, 2025-2035
  • Figure 23: East Asia Market Incremental $ Opportunity, 2025-2035
  • Figure 24: South Asia & Pacific Market Incremental $ Opportunity, 2025-2035
  • Figure 25: Middle East and Africa Market Incremental $ Opportunity, 2025-2035
  • Figure 26: North America Market Value Share and BPS Analysis by Country, 2025 and 2035
  • Figure 27: North America Market Value Share and BPS Analysis by Product, 2025 and 2035
  • Figure 28: North America Market Y-o-Y Growth Comparison by Product, 2025-2035
  • Figure 29: North America Market Attractiveness Analysis by Product
  • Figure 30: North America Market Value Share and BPS Analysis by Power Output, 2025 and 2035
  • Figure 31: North America Market Y-o-Y Growth Comparison by Power Output, 2025-2035
  • Figure 32: North America Market Attractiveness Analysis by Power Output
  • Figure 33: North America Market Value Share and BPS Analysis by Capacity, 2025 and 2035
  • Figure 34: North America Market Y-o-Y Growth Comparison by Capacity, 2025-2035
  • Figure 35: North America Market Attractiveness Analysis by Capacity
  • Figure 36: North America Market Value Share and BPS Analysis by Vertical, 2025 and 2035
  • Figure 37: North America Market Y-o-Y Growth Comparison by Vertical, 2025-2035
  • Figure 38: North America Market Attractiveness Analysis by Vertical
  • Figure 39: Latin America Market Value Share and BPS Analysis by Country, 2025 and 2035
  • Figure 40: Latin America Market Value Share and BPS Analysis by Product, 2025 and 2035
  • Figure 41: Latin America Market Y-o-Y Growth Comparison by Product, 2025-2035
  • Figure 42: Latin America Market Attractiveness Analysis by Product
  • Figure 43: Latin America Market Value Share and BPS Analysis by Power Output, 2025 and 2035
  • Figure 44: Latin America Market Y-o-Y Growth Comparison by Power Output, 2025-2035
  • Figure 45: Latin America Market Attractiveness Analysis by Power Output
  • Figure 46: Latin America Market Value Share and BPS Analysis by Capacity, 2025 and 2035
  • Figure 47: Latin America Market Y-o-Y Growth Comparison by Capacity, 2025-2035
  • Figure 48: Latin America Market Attractiveness Analysis by Capacity
  • Figure 49: Latin America Market Value Share and BPS Analysis by Vertical, 2025 and 2035
  • Figure 50: Latin America Market Y-o-Y Growth Comparison by Vertical, 2025-2035
  • Figure 51: Latin America Market Attractiveness Analysis by Vertical
  • Figure 52: Western Europe Market Value Share and BPS Analysis by Country, 2025 and 2035
  • Figure 53: Western Europe Market Value Share and BPS Analysis by Product, 2025 and 2035
  • Figure 54: Western Europe Market Y-o-Y Growth Comparison by Product, 2025-2035
  • Figure 55: Western Europe Market Attractiveness Analysis by Product
  • Figure 56: Western Europe Market Value Share and BPS Analysis by Power Output, 2025 and 2035
  • Figure 57: Western Europe Market Y-o-Y Growth Comparison by Power Output, 2025-2035
  • Figure 58: Western Europe Market Attractiveness Analysis by Power Output
  • Figure 59: Western Europe Market Value Share and BPS Analysis by Capacity, 2025 and 2035
  • Figure 60: Western Europe Market Y-o-Y Growth Comparison by Capacity, 2025-2035
  • Figure 61: Western Europe Market Attractiveness Analysis by Capacity
  • Figure 62: Western Europe Market Value Share and BPS Analysis by Vertical, 2025 and 2035
  • Figure 63: Western Europe Market Y-o-Y Growth Comparison by Vertical, 2025-2035
  • Figure 64: Western Europe Market Attractiveness Analysis by Vertical
  • Figure 65: Eastern Europe Market Value Share and BPS Analysis by Country, 2025 and 2035
  • Figure 66: Eastern Europe Market Value Share and BPS Analysis by Product, 2025 and 2035
  • Figure 67: Eastern Europe Market Y-o-Y Growth Comparison by Product, 2025-2035
  • Figure 68: Eastern Europe Market Attractiveness Analysis by Product
  • Figure 69: Eastern Europe Market Value Share and BPS Analysis by Power Output, 2025 and 2035
  • Figure 70: Eastern Europe Market Y-o-Y Growth Comparison by Power Output, 2025-2035
  • Figure 71: Eastern Europe Market Attractiveness Analysis by Power Output
  • Figure 72: Eastern Europe Market Value Share and BPS Analysis by Capacity, 2025 and 2035
  • Figure 73: Eastern Europe Market Y-o-Y Growth Comparison by Capacity, 2025-2035
  • Figure 74: Eastern Europe Market Attractiveness Analysis by Capacity
  • Figure 75: Eastern Europe Market Value Share and BPS Analysis by Vertical, 2025 and 2035
  • Figure 76: Eastern Europe Market Y-o-Y Growth Comparison by Vertical, 2025-2035
  • Figure 77: Eastern Europe Market Attractiveness Analysis by Vertical
  • Figure 78: East Asia Market Value Share and BPS Analysis by Country, 2025 and 2035
  • Figure 79: East Asia Market Value Share and BPS Analysis by Product, 2025 and 2035
  • Figure 80: East Asia Market Y-o-Y Growth Comparison by Product, 2025-2035
  • Figure 81: East Asia Market Attractiveness Analysis by Product
  • Figure 82: East Asia Market Value Share and BPS Analysis by Power Output, 2025 and 2035
  • Figure 83: East Asia Market Y-o-Y Growth Comparison by Power Output, 2025-2035
  • Figure 84: East Asia Market Attractiveness Analysis by Power Output
  • Figure 85: East Asia Market Value Share and BPS Analysis by Capacity, 2025 and 2035
  • Figure 86: East Asia Market Y-o-Y Growth Comparison by Capacity, 2025-2035
  • Figure 87: East Asia Market Attractiveness Analysis by Capacity
  • Figure 88: East Asia Market Value Share and BPS Analysis by Vertical, 2025 and 2035
  • Figure 89: East Asia Market Y-o-Y Growth Comparison by Vertical, 2025-2035
  • Figure 90: East Asia Market Attractiveness Analysis by Vertical
  • Figure 91: South Asia & Pacific Market Value Share and BPS Analysis by Country, 2025 and 2035
  • Figure 92: South Asia & Pacific Market Value Share and BPS Analysis by Product, 2025 and 2035
  • Figure 93: South Asia & Pacific Market Y-o-Y Growth Comparison by Product, 2025-2035
  • Figure 94: South Asia & Pacific Market Attractiveness Analysis by Product
  • Figure 95: South Asia & Pacific Market Value Share and BPS Analysis by Power Output, 2025 and 2035
  • Figure 96: South Asia & Pacific Market Y-o-Y Growth Comparison by Power Output, 2025-2035
  • Figure 97: South Asia & Pacific Market Attractiveness Analysis by Power Output
  • Figure 98: South Asia & Pacific Market Value Share and BPS Analysis by Capacity, 2025 and 2035
  • Figure 99: South Asia & Pacific Market Y-o-Y Growth Comparison by Capacity, 2025-2035
  • Figure 100: South Asia & Pacific Market Attractiveness Analysis by Capacity
  • Figure 101: South Asia & Pacific Market Value Share and BPS Analysis by Vertical, 2025 and 2035
  • Figure 102: South Asia & Pacific Market Y-o-Y Growth Comparison by Vertical, 2025-2035
  • Figure 103: South Asia & Pacific Market Attractiveness Analysis by Vertical
  • Figure 104: Middle East and Africa Market Value Share and BPS Analysis by Country, 2025 and 2035
  • Figure 105: Middle East and Africa Market Value Share and BPS Analysis by Product, 2025 and 2035
  • Figure 106: Middle East and Africa Market Y-o-Y Growth Comparison by Product, 2025-2035
  • Figure 107: Middle East and Africa Market Attractiveness Analysis by Product
  • Figure 108: Middle East and Africa Market Value Share and BPS Analysis by Power Output, 2025 and 2035
  • Figure 109: Middle East and Africa Market Y-o-Y Growth Comparison by Power Output, 2025-2035
  • Figure 110: Middle East and Africa Market Attractiveness Analysis by Power Output
  • Figure 111: Middle East and Africa Market Value Share and BPS Analysis by Capacity, 2025 and 2035
  • Figure 112: Middle East and Africa Market Y-o-Y Growth Comparison by Capacity, 2025-2035
  • Figure 113: Middle East and Africa Market Attractiveness Analysis by Capacity
  • Figure 114: Middle East and Africa Market Value Share and BPS Analysis by Vertical, 2025 and 2035
  • Figure 115: Middle East and Africa Market Y-o-Y Growth Comparison by Vertical, 2025-2035
  • Figure 116: Middle East and Africa Market Attractiveness Analysis by Vertical
  • Figure 117: Global Market - Tier Structure Analysis
  • Figure 118: Global Market - Company Share Analysis

Frequently Asked Questions

What is the projected size of the ultrasonic cleaning market in 2025?

The market is valued at USD 2.1 billion in 2025.

What is the outlook on ultrasonic cleaning demand by 2035?

The market is forecasted to reach USD 3.5 billion by 2035, reflecting a CAGR of 5.3%.

Which product type leads the ultrasonic cleaning market in 2025?

Benchtop ultrasonic cleaning systems are expected to lead the market with a 25% share in 2025.

What is the projected share of the medical & healthcare vertical in the ultrasonic cleaning market by 2035?

The medical and healthcare sector is expected to hold a 22% share of the market by 2035.

Which country is projected to have the fastest-growing ultrasonic cleaning market?

Germany is anticipated to be the fastest-growing market with a CAGR of 5.5% from 2025 to 2035.

Explore Similar Insights

Future Market Insights

Ultrasonic Cleaning Market