The Ultrasonic Sealing Machines Market is estimated to be valued at USD 176.2 billion in 2025 and is projected to reach USD 255.8 billion by 2035, registering a compound annual growth rate (CAGR) of 3.8% over the forecast period.
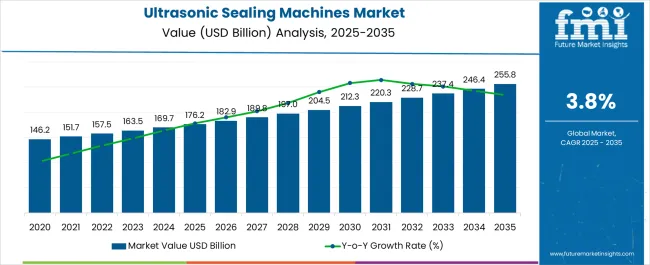
| Metric | Value |
|---|---|
| Ultrasonic Sealing Machines Market Estimated Value in (2025 E) | USD 176.2 billion |
| Ultrasonic Sealing Machines Market Forecast Value in (2035 F) | USD 255.8 billion |
| Forecast CAGR (2025 to 2035) | 3.8% |
The ultrasonic sealing machines market is experiencing steady growth driven by increasing demand for efficient, precise, and eco friendly sealing solutions across diverse industries. The shift toward sustainable packaging and reduced reliance on adhesives and heat based sealing methods has created strong opportunities for ultrasonic technology adoption.
The capability of these machines to deliver consistent seals without compromising material integrity has expanded their relevance in food, medical, and industrial packaging. Additionally, growing emphasis on automation, productivity enhancement, and compliance with global packaging safety standards has reinforced market adoption.
With advancements in machine design, integration with digital monitoring systems, and compatibility with a wide range of materials, the market outlook remains positive. Continued innovation aimed at reducing energy consumption and enhancing production speed is expected to further strengthen demand in the coming years.
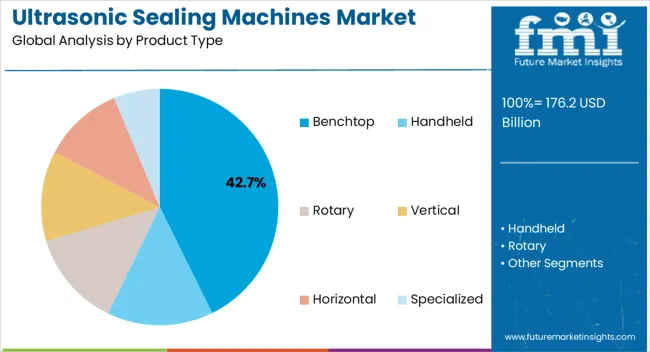
The benchtop product type segment is projected to hold 42.70% of market revenue by 2025, establishing its prominence within the product type category. This position is supported by the compact design, cost efficiency, and adaptability of benchtop machines across small and medium scale operations.
Their ease of installation and suitability for laboratory use and pilot production lines have increased their adoption. The flexibility to handle multiple packaging formats without occupying extensive floor space has further supported their preference.
As businesses seek scalable sealing solutions that balance efficiency with affordability, benchtop machines continue to lead the product type category.
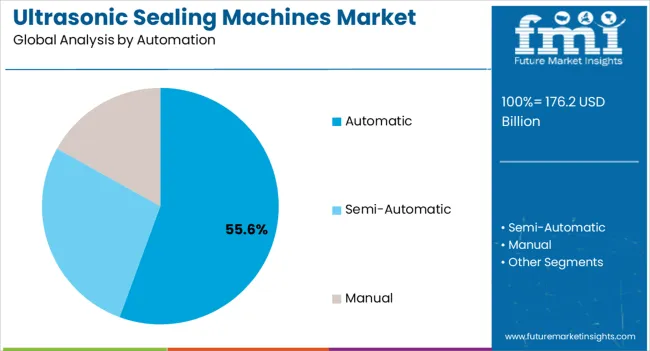
The automatic product segment is expected to account for 55.60% of total revenue within the automation category by 2025, positioning it as the leading subsegment. This growth is driven by the ability of automatic systems to deliver high throughput, consistent quality, and reduced labor dependency.
Integration with smart sensors, real time monitoring, and automated adjustments has improved operational efficiency and minimized errors. The demand for faster production cycles and enhanced safety compliance has reinforced the reliance on automatic ultrasonic sealing systems.
With growing adoption in high volume production environments, this segment continues to define automation trends in the market.
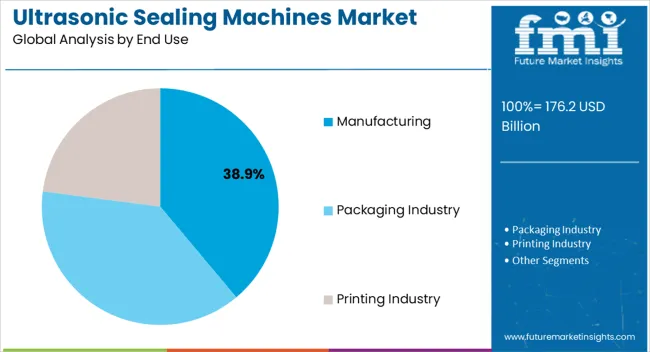
The manufacturing segment is anticipated to represent 38.90% of total revenue in 2025 under the end use category, making it the dominant area of application. This growth is being propelled by widespread use of ultrasonic sealing in packaging, textiles, automotive components, and medical products manufacturing.
The requirement for precision, strength, and durability in seals has increased the adoption of ultrasonic machines within these sectors. Additionally, manufacturers benefit from reduced material waste, energy efficiency, and compliance with stringent industry regulations.
As industries continue to prioritize operational efficiency and sustainability, the manufacturing segment maintains its leadership in driving the overall market growth.
Ultrasonic Sealing Machines market during this period was the increasing demand for flexible packaging materials in various industries such as food and beverage, pharmaceuticals, and cosmetics. Ultrasonic sealing technology offers several advantages over traditional sealing methods such as heat sealing and adhesive bonding, including improved sealing quality, higher efficiency, and reduced energy consumption, making it a popular choice for manufacturers looking to improve their production processes. The development of new materials and designs that were specifically designed for use with ultrasonic sealing machines.
The growing demand for automated and semi-automated ultrasonic sealing machines during this period, driven by the need for increased production efficiency and reduced labor costs. Manufacturers also invested in R&D to develop new technologies and improve existing products, further driving market growth.
The market growth in the coming years will be the increasing demand for eco-friendly and sustainable packaging materials, which require specialized sealing technology to ensure proper sealing and product protection. Ultrasonic sealing machines are well-suited for this purpose, as they offer several advantages over traditional sealing methods, including higher efficiency, improved sealing quality, and reduced energy consumption.
The food and beverage industry is expected to be a key driver of market growth in the coming years, as manufacturers look for ways to improve the shelf life and freshness of their products. Ultrasonic sealing machines are an ideal solution for packaging food products, as they can create an airtight seal that helps to preserve freshness and prevent contamination.
Furthermore, the market growth is expected to drive in the coming years is the increasing adoption of automation and Industry 4.0 technologies in manufacturing processes. Ultrasonic sealing machines are well-suited for automation, as they can be easily integrated into production lines and controlled via computer systems. This will help to improve production efficiency and reduce labor costs, further driving market growth. Although, the development of new materials and designs for use with ultrasonic sealing machines is expected to open up new opportunities for the market, as manufacturers look for innovative solutions to meet the changing needs of consumers.
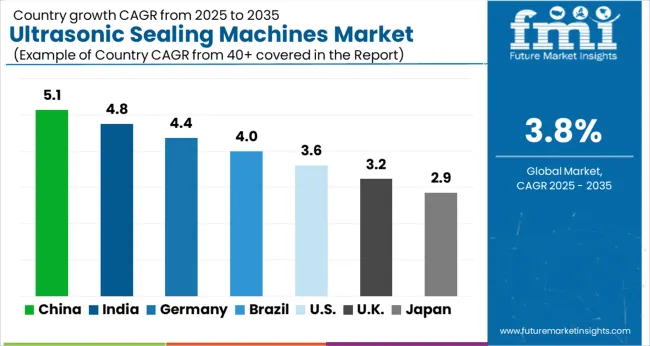
| Country | India |
|---|---|
| Market Size (USD million) by End of Forecast Period (2035) | USD 51.2 billion |
| CAGR % 2025 to End of Forecast (2035) | 3.4% |
The factors driving the growth of the Ultrasonic Sealing Machines market in India is the country's large and diverse manufacturing sector. India is home to many small and medium-sized enterprises that require efficient and cost-effective sealing machines to remain competitive. As a result, there is a strong demand for Ultrasonic Sealing Machines in India, which is expected to continue growing in the coming years.
Additionally, the factor contributing to India's strong market base for Ultrasonic Sealing Machines is the country's skilled workforce. India has a large pool of engineers and technicians who are trained in the latest technologies, including ultrasonic sealing. This skilled workforce has helped to drive innovation and productivity in the Indian Ultrasonic Sealing Machines market, making it an attractive destination for manufacturers and investors.
| Country | China |
|---|---|
| Market Size (USD million) by End of Forecast Period (2035) | USD 24.5 million |
| CAGR % 2025 to End of Forecast (2035) | 5.1% |
China is poised for notable growth potential in the Ultrasonic Sealing Machines market, driven by several key factors. China's manufacturing sector is the largest in the world and is growing rapidly, with demand for efficient and cost-effective sealing solutions increasing across industries such as textiles, automotive, electronics, and more. Though, there is a corresponding increase in demand for Ultrasonic Sealing Machines to improve efficiency and productivity in the manufacturing process. Increasing demand from end-use industries is also driving growth in the Ultrasonic Sealing Machines market in China. The country continues to grow, there is an increase in demand for consumer goods such as packaged foods and beverages, which require efficient and high-quality sealing solutions. This is driving demand for Ultrasonic Sealing Machines in industries such as food and beverage packaging.
Ultrasonic sealing machines are used in various industries for sealing and bonding thermoplastic materials. Automatic ultrasonic sealing machines are fully automated and require minimal human intervention. These machines have features like automatic feeding, sealing, and cutting of materials, and are typically used in high-volume production settings. Semi-automatic ultrasonic sealing machines, on the other hand, require some level of human intervention to load and unload materials and initiate the sealing process. These machines are typically used in lower volume production settings.
Automatic ultrasonic sealing machines hold a significant share in the market, with the choice of machine depending on the specific production needs of the user. The segment is anticipated to provide a major share of around 37% in the forecast year 2035 at a CAGR of 4.3%.
Ultrasonic sealing technology offers many advantages over traditional heat sealing methods, such as faster cycle times, improved seal quality, and the ability to seal a wider range of materials. Benchtop and Rotary ultrasonic sealing machines are becoming increasingly popular because they are compact, easy to use, and require minimal setup time. This makes them ideal for small to medium-scale production runs, as well as for research and development applications. The rise of e-commerce and online retail has led to increased demand for smaller, more flexible packaging solutions. Benchtop and rotary ultrasonic sealing machines offer the versatility needed to produce a wide range of packaging types, from pouches and sachets to blister packs and clamshells.
Both the segment is anticipated to provide a collective share of around 46% respectively in the forecast year 2035.
The food and beverage and healthcare industries are leading users of ultrasonic sealing machines due to their unique requirements for packaging and sterilization. Ultrasonic sealing technology offers several advantages over traditional sealing methods, such as heat sealing, which can damage delicate products or compromise sterility.
In the food and beverage industry, ultrasonic sealing is particularly useful for packaging products that are sensitive to heat, such as fresh produce, dairy products, and baked goods. Ultrasonic sealing can create airtight seals without damaging the product or affecting its taste or texture. Additionally, in the healthcare industry, ultrasonic sealing is used for packaging medical devices, pharmaceuticals, and other products that require a high level of sterility. Ultrasonic sealing can create hermetic seals that are resistant to microbial contamination, which is critical for protecting patients and ensuring regulatory compliance.
Market players can differentiate themselves by introducing new features or technologies that improve the performance or efficiency of their machines. This could include features such as automated loading and unloading systems, smart sensors for real-time monitoring, or software for optimizing machine performance. Sustainability is also an increasingly important consideration in the ultrasonic sealing machines market.
Key strategies in Ultrasonic Sealing Machines market:
Developing Innovative Product:
Developing innovative products in this market requires a deep understanding of the latest technological trends and customer needs. One unique approach to innovation is to integrate artificial intelligence (AI) into ultrasonic sealing machines. AI can be used to monitor the sealing process in real-time and detect any deviations from the optimal sealing conditions. Additionally, high-frequency ultrasonics, which can provide faster and stronger seals than traditional ultrasonics.
Customization:
Customization is becoming increasingly important in the ultrasonic sealing machines market as customers seek solutions that are tailored to their specific needs. One of the approach is to incorporate 3D printing technology into the design and manufacturing process. This allows for the creation of complex parts that are difficult or impossible to produce using traditional manufacturing methods. By leveraging these advanced manufacturing techniques, companies can provide highly customized solutions that are optimized for their customers' specific requirements. Additionally, the use of simulation software can also help in customizing the sealing process for different materials and applications.
Sustainability:
The use of energy-efficient components, such as motors and sensors, which can significantly reduce the energy consumption of the sealing machines. Additionally, companies can incorporate smart controls and software to optimize the sealing process and reduce material waste. For instance, by using real-time monitoring and control of the sealing parameters, the machines can adjust the sealing process to minimize material waste and ensure consistent seal quality.
Strategic Expansion:
Strategic expansion is crucial for companies in the ultrasonic sealing machines market to stay competitive and grow their market share. One of the approach to strategic expansion is to target emerging markets with high growth potential. For instance, developing countries such as India and China are expected to experience significant growth in demand for ultrasonic sealing machines due to the rapid growth of their manufacturing sectors.
Acquisition:
Acquisitions are a popular strategy for companies in the ultrasonic sealing machines market to expand their market share and gain access to new technologies and markets. The acquire companies that have strong R&D capabilities in ultrasonic sealing technologies, can help the company to stay ahead of the curve in terms of technological innovation and enable them to develop new products and solutions that meet the evolving needs of their customers
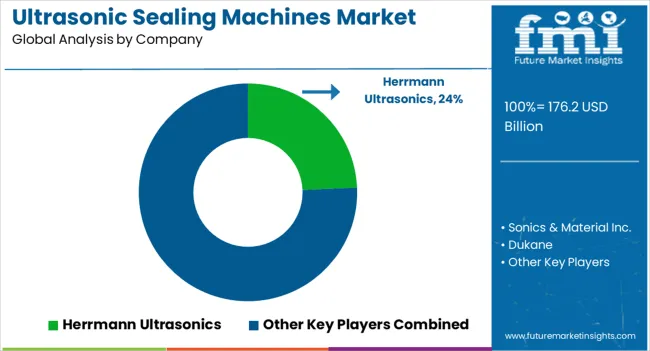
The global ultrasonic sealing machines market is estimated to be valued at USD 176.2 billion in 2025.
The market size for the ultrasonic sealing machines market is projected to reach USD 255.8 billion by 2035.
The ultrasonic sealing machines market is expected to grow at a 3.8% CAGR between 2025 and 2035.
The key product types in ultrasonic sealing machines market are benchtop, handheld, rotary, vertical, horizontal and specialized.
In terms of automation, automatic segment to command 55.6% share in the ultrasonic sealing machines market in 2025.


Our Research Products

The "Full Research Suite" delivers actionable market intel, deep dives on markets or technologies, so clients act faster, cut risk, and unlock growth.

The Leaderboard benchmarks and ranks top vendors, classifying them as Established Leaders, Leading Challengers, or Disruptors & Challengers.

Locates where complements amplify value and substitutes erode it, forecasting net impact by horizon

We deliver granular, decision-grade intel: market sizing, 5-year forecasts, pricing, adoption, usage, revenue, and operational KPIs—plus competitor tracking, regulation, and value chains—across 60 countries broadly.

Spot the shifts before they hit your P&L. We track inflection points, adoption curves, pricing moves, and ecosystem plays to show where demand is heading, why it is changing, and what to do next across high-growth markets and disruptive tech

Real-time reads of user behavior. We track shifting priorities, perceptions of today’s and next-gen services, and provider experience, then pace how fast tech moves from trial to adoption, blending buyer, consumer, and channel inputs with social signals (#WhySwitch, #UX).

Partner with our analyst team to build a custom report designed around your business priorities. From analysing market trends to assessing competitors or crafting bespoke datasets, we tailor insights to your needs.
Supplier Intelligence
Discovery & Profiling
Capacity & Footprint
Performance & Risk
Compliance & Governance
Commercial Readiness
Who Supplies Whom
Scorecards & Shortlists
Playbooks & Docs
Category Intelligence
Definition & Scope
Demand & Use Cases
Cost Drivers
Market Structure
Supply Chain Map
Trade & Policy
Operating Norms
Deliverables
Buyer Intelligence
Account Basics
Spend & Scope
Procurement Model
Vendor Requirements
Terms & Policies
Entry Strategy
Pain Points & Triggers
Outputs
Pricing Analysis
Benchmarks
Trends
Should-Cost
Indexation
Landed Cost
Commercial Terms
Deliverables
Brand Analysis
Positioning & Value Prop
Share & Presence
Customer Evidence
Go-to-Market
Digital & Reputation
Compliance & Trust
KPIs & Gaps
Outputs
Full Research Suite comprises of:
Market outlook & trends analysis
Interviews & case studies
Strategic recommendations
Vendor profiles & capabilities analysis
5-year forecasts
8 regions and 60+ country-level data splits
Market segment data splits
12 months of continuous data updates
DELIVERED AS:
PDF EXCEL ONLINE
Box Sealing Machines Market Trends – Growth & Forecast 2025 to 2035
Tray Sealing Machines Market Size and Share Forecast Outlook 2025 to 2035
Tube Sealing Machines Market Analysis by Tube type, Technology type, End User, and Region through 2025 to 2035
Competitive Breakdown of Tube Sealing Machines Providers
Ultrasonic Homogenizer Machines Market Size and Share Forecast Outlook 2025 to 2035
Hybrid Sealing-Cut Machines Market Analysis - Size and Share Forecast Outlook 2025 to 2035
Envelope Sealing Machines Market Trends - Growth & Forecast 2025 to 2035
Induction Sealing Machines Market Size and Share Forecast Outlook 2025 to 2035
Meal Tray Sealing Machines Market Size and Share Forecast Outlook 2025 to 2035
Market Share Breakdown of Induction Sealing Machines Manufacturers
Demand for Box Sealing Machines in USA Size and Share Forecast Outlook 2025 to 2035
Demand for Box Sealing Machines in Japan Size and Share Forecast Outlook 2025 to 2035
United States and Canada Tray Sealing Machines Market Size and Share Forecast Outlook 2025 to 2035
Sealing & Strapping Packaging Tape Market Size and Share Forecast Outlook 2025 to 2035
Ultrasonic Jewelry Cleaning Machine Market Size and Share Forecast Outlook 2025 to 2035
Ultrasonic NDT Equipment Market Size and Share Forecast Outlook 2025 to 2035
Sealing Agent for Gold Market Size and Share Forecast Outlook 2025 to 2035
Ultrasonic Air Bubble Detectors Market Size and Share Forecast Outlook 2025 to 2035
Ultrasonic Pouch Sealers Market Analysis Size and Share Forecast Outlook 2025 to 2035
Sealing And Strapping Packaging Tapes Market Size and Share Forecast Outlook 2025 to 2035

Thank you!
You will receive an email from our Business Development Manager. Please be sure to check your SPAM/JUNK folder too.
Chat With
MaRIA