Ultrasonic NDT Equipment Market Size and Share Forecast Outlook 2025 to 2035

The Ultrasonic NDT Equipment Market is estimated to be valued at USD 24.0 billion in 2025 and is projected to reach USD 49.5 billion by 2035, registering a compound annual growth rate (CAGR) of 7.5% over the forecast period.
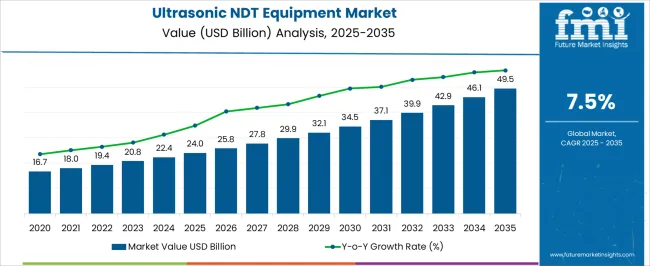
Quick Stats for Ultrasonic NDT Equipment Market

  • Ultrasonic NDT Equipment Market Value (2025): USD 24.0 billion
  • Ultrasonic NDT Equipment Market Forecast Value (2035): USD 49.5 billion
  • Ultrasonic NDT Equipment Market Forecast CAGR: 7.5%
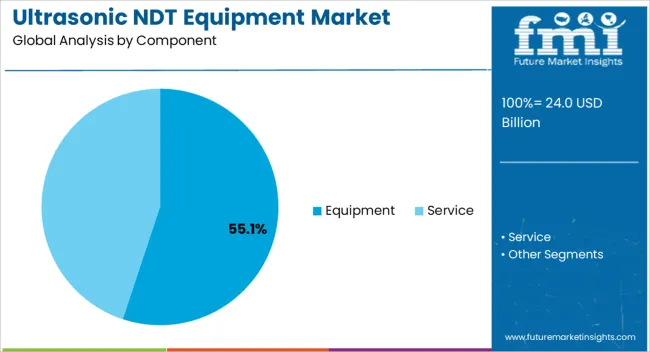
  • Leading Segment in Ultrasonic NDT Equipment Market in 2025: Equipment (55.1%)
  • Key Growth Regions in Ultrasonic NDT Equipment Market: North America, Asia-Pacific, Europe
  • Top Key Players in Ultrasonic NDT Equipment Market: Baker Hughes Company, MISTRAS Group Inc., Intertek Group PLC, Olympus Corporation, Zetec Inc. (Eddyfi Technologies), Advanced NDT Ltd., Johnson & Allen Ltd, ROSEN Group, OKOndt GROUP, Bureau Veritas SA, Applus Services SA

Ultrasonic Ndt Equipment Market Market Value Analysis

Ultrasonic NDT Equipment Market Key Takeaways

Metric Value
Ultrasonic NDT Equipment Market Estimated Value in (2025 E) USD 24.0 billion
Ultrasonic NDT Equipment Market Forecast Value in (2035 F) USD 49.5 billion
Forecast CAGR (2025 to 2035) 7.5%

Why is the Ultrasonic NDT Equipment Market Growing?

The Ultrasonic NDT Equipment market is experiencing robust growth, driven by the increasing demand for non-destructive testing solutions across industrial and infrastructure sectors. The adoption of ultrasonic technology is being fueled by its ability to detect defects, assess material integrity, and ensure quality control without causing damage to the tested components. Industries such as oil and gas, aerospace, automotive, and manufacturing are increasingly relying on ultrasonic testing to enhance operational safety, maintain regulatory compliance, and reduce maintenance costs.

Continuous advancements in sensor technology, signal processing, and portable equipment designs are improving detection accuracy and operational efficiency. Integration with digital platforms and automated inspection systems is further accelerating adoption, enabling real-time monitoring and predictive maintenance.

Regulatory requirements for safety and quality assurance are also driving investment in ultrasonic NDT equipment As organizations prioritize asset reliability, safety, and efficiency, the market is expected to experience sustained growth, with equipment that offers precision, scalability, and adaptability becoming a critical factor in operational decision-making.

Segmental Analysis

The ultrasonic ndt equipment market is segmented by component, end use industry, and geographic regions. By component, ultrasonic ndt equipment market is divided into Equipment and Service. In terms of end use industry, ultrasonic ndt equipment market is classified into Oil & Gas, Power Generation, Aerospace & Defense, Automotive & Transportation, and Others. Regionally, the ultrasonic ndt equipment industry is classified into North America, Latin America, Western Europe, Eastern Europe, Balkan & Baltic Countries, Russia & Belarus, Central Asia, East Asia, South Asia & Pacific, and the Middle East & Africa.
Insights into the Equipment Component Segment

Ultrasonic Ndt Equipment Market Analysis By Component

The equipment component segment is projected to hold 55.1% of the market revenue in 2025, establishing it as the leading component type. Growth in this segment is driven by the increasing reliance on advanced ultrasonic devices for detecting flaws, cracks, and corrosion in materials without compromising their integrity. Equipment such as portable flaw detectors, phased array ultrasonic systems, and automated scanners provide high precision and reliability, which is critical for industries with stringent quality and safety standards.

The ability to integrate these devices with software for data acquisition, analysis, and reporting enhances operational efficiency and reduces inspection time. Continuous technological advancements in transducer design, signal processing, and calibration methods have strengthened the accuracy and adaptability of ultrasonic equipment.

Organizations are increasingly investing in equipment that supports scalable, multi-material, and complex geometry inspections As the demand for high-quality, reliable, and efficient testing increases across industrial applications, the equipment segment is expected to maintain its leading position in the market, supported by innovation and growing adoption across critical sectors.
Insights into the Oil & Gas End Use Industry Segment

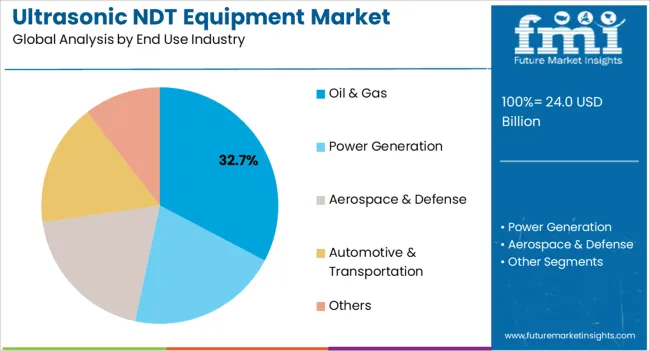
Ultrasonic Ndt Equipment Market Analysis By End Use Industry

The oil and gas end use industry segment is anticipated to account for 32.7% of the market revenue in 2025, making it the leading end-use sector. Growth in this segment is driven by the need for rigorous inspection and monitoring of pipelines, refineries, storage tanks, and offshore facilities to prevent failures, ensure safety, and maintain regulatory compliance. Ultrasonic NDT equipment enables the detection of corrosion, cracks, and structural defects in critical infrastructure, minimizing operational risks and avoiding costly downtime.

Integration of automated scanning and real-time data analysis supports predictive maintenance and enhances asset life cycles. The complexity of oil and gas operations, combined with stringent environmental and safety regulations, has further reinforced the adoption of ultrasonic NDT solutions.

Increasing investments in upstream and downstream infrastructure, along with the demand for reliability and operational efficiency, are expected to drive continued growth The oil and gas segment’s reliance on advanced ultrasonic inspection equipment is projected to maintain its position as the primary revenue contributor in the market.

Market Overview

Ultrasonic NDT Equipment Market Overview

The total worth of the market for ultrasonic NDT equipment is estimated to be around US$ 19.35 Billion in 2025 and is predicted. As per the market analysis report, the global market would register a CAGR of 7.5% between 2025 and 2035 and reach an overall valuation of US$ 40 Billion by the end of this forecast years.

Attributes Details
Market Size Value (2025) US$ 19.35 Billion
Market Size Value (2035) US$ 40 Billion
Market Growth Rate (2025 to 2035) 7.5%

The increase in industrial activity in emerging and developed countries is expected to fuel the growth of the ultrasonic non-destructive testing (NDT) equipment market during the forecast years. Moreover, recent technological advancements have resulted in the development of enhanced ultrasonic NDT techniques with increased fault identification and safety. Similarly, rising manufacturers' knowledge of the usage of Ultrasonic NDT methods has favored the penetration of the overall market in Latin America and African countries.

The expensive cost of other non-destructive testing and diagnostic methods, along with the engineering hurdles required in its deployment or installation and functioning have popularized the Ultrasonic NDT equipment in the last few years. Based on offerings, the services sector was the major revenue-contributing factor of the overall market until the year 2025 and accounted for more than 75% share. As per the market analysis report, this segment is also likely to continue to grow at a higher rate throughout the forecast years.

As per this report, the conventional test technique segment still dominates the market, accounting for more than 80% of total revenue generated in the year 2025. The increased acceptance of classical NDT procedures also including visual testing, liquid penetrant testing, magnetic particle testing, eddy current testing, radiographic testing, and the ultrasonic test is attributed to this growth.
Analysis of Ultrasonic NDT Equipment Market By Key Countries

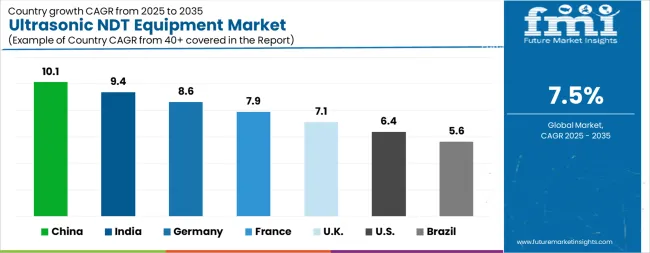
Ultrasonic Ndt Equipment Market Cagr Analysis By Country

Country CAGR
China 10.1%
India 9.4%
Germany 8.6%
France 7.9%
UK 7.1%
USA 6.4%
Brazil 5.6%

Country-wise Analysis

The Ultrasonic NDT Equipment Market is expected to register a CAGR of 7.5% during the forecast period, exhibiting varied country level momentum. China leads with the highest CAGR of 10.1%, followed by India at 9.4%. Developed markets such as Germany, France, and the UK continue to expand steadily, while the USA is likely to grow at consistent rates. Brazil posts the lowest CAGR at 5.6%, yet still underscores a broadly positive trajectory for the global Ultrasonic NDT Equipment Market. In 2024, Germany held a dominant revenue in the Western Europe market and is expected to grow with a CAGR of 8.6%. The USA Ultrasonic NDT Equipment Market is estimated to be valued at USD 9.0 billion in 2025 and is anticipated to reach a valuation of USD 16.8 billion by 2035. Sales are projected to rise at a CAGR of 6.4% over the forecast period between 2025 and 2035. While Japan and South Korea markets are estimated to be valued at USD 1.2 billion and USD 696.6 million respectively in 2025.
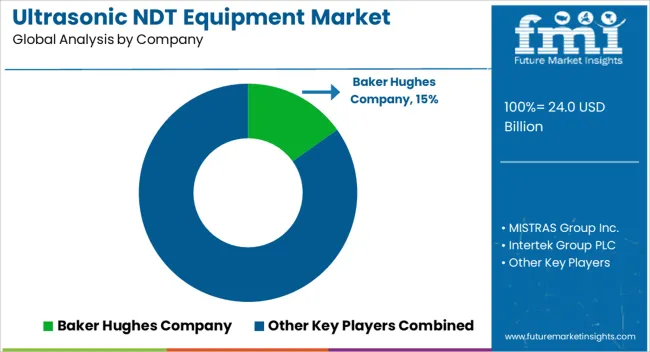
Key Players in the Ultrasonic NDT Equipment Market

Ultrasonic Ndt Equipment Market Analysis By Company

  • Baker Hughes Company
  • MISTRAS Group Inc.
  • Intertek Group PLC
  • Olympus Corporation
  • Zetec Inc. (Eddyfi Technologies)
  • Advanced NDT Ltd.
  • Johnson & Allen Ltd
  • ROSEN Group
  • OKOndt GROUP
  • Bureau Veritas SA
  • Applus Services SA

Scope of the Report

Item Value
Quantitative Units USD 24.0 Billion
Component Equipment and Service
End Use Industry Oil & Gas, Power Generation, Aerospace & Defense, Automotive & Transportation, and Others
Regions Covered North America, Europe, Asia-Pacific, Latin America, Middle East & Africa
Country Covered United States, Canada, Germany, France, United Kingdom, China, Japan, India, Brazil, South Africa
Key Companies Profiled Baker Hughes Company, MISTRAS Group Inc., Intertek Group PLC, Olympus Corporation, Zetec Inc. (Eddyfi Technologies), Advanced NDT Ltd., Johnson & Allen Ltd, ROSEN Group, OKOndt GROUP, Bureau Veritas SA, and Applus Services SA

Ultrasonic NDT Equipment Market by Segments

Component:

  • Equipment
  • Service

End Use Industry:

  • Oil & Gas
  • Power Generation
  • Aerospace & Defense
  • Automotive & Transportation
  • Others

Region:

  • North America
    • USA
    • Canada
    • Mexico
  • Latin America
    • Brazil
    • Chile
    • Rest of Latin America
  • Western Europe
    • Germany
    • UK
    • Italy
    • Spain
    • France
    • Nordic
    • BENELUX
    • Rest of Western Europe
  • Eastern Europe
    • Russia
    • Poland
    • Hungary
    • Balkan & Baltic
    • Rest of Eastern Europe
  • East Asia
    • China
    • Japan
    • South Korea
  • South Asia and Pacific
    • India
    • ASEAN
    • Australia & New Zealand
    • Rest of South Asia and Pacific
  • Middle East & Africa
    • Kingdom of Saudi Arabia
    • Other GCC Countries
    • Turkiye
    • South Africa
    • Other African Union
    • Rest of Middle East & Africa

Table of Content

  1. Executive Summary
    • Global Market Outlook
    • Demand-side Trends
    • Supply-side Trends
    • Technology Roadmap Analysis
    • Analysis and Recommendations
  2. Market Overview
    • Market Coverage / Taxonomy
    • Market Definition / Scope / Limitations
  3. Market Background
    • Market Dynamics
      • Drivers
      • Restraints
      • Opportunity
      • Trends
    • Scenario Forecast
      • Demand in Optimistic Scenario
      • Demand in Likely Scenario
      • Demand in Conservative Scenario
    • Opportunity Map Analysis
    • Product Life Cycle Analysis
    • Supply Chain Analysis
    • Investment Feasibility Matrix
    • Value Chain Analysis
    • PESTLE and Porter’s Analysis
    • Regulatory Landscape
    • Regional Parent Market Outlook
    • Production and Consumption Statistics
    • Import and Export Statistics
  4. Global Market Analysis 2020 to 2024 and Forecast, 2025 to 2035
    • Historical Market Size Value (USD Million) Analysis, 2020 to 2024
    • Current and Future Market Size Value (USD Million) Projections, 2025 to 2035
      • Y-o-Y Growth Trend Analysis
      • Absolute $ Opportunity Analysis
  5. Global Market Pricing Analysis 2020 to 2024 and Forecast 2025 to 2035
  6. Global Market Analysis 2020 to 2024 and Forecast 2025 to 2035, By Component
    • Introduction / Key Findings
    • Historical Market Size Value (USD Million) Analysis By Component , 2020 to 2024
    • Current and Future Market Size Value (USD Million) Analysis and Forecast By Component , 2025 to 2035
      • Equipment
      • Service
    • Y-o-Y Growth Trend Analysis By Component , 2020 to 2024
    • Absolute $ Opportunity Analysis By Component , 2025 to 2035
  7. Global Market Analysis 2020 to 2024 and Forecast 2025 to 2035, By End Use Industry
    • Introduction / Key Findings
    • Historical Market Size Value (USD Million) Analysis By End Use Industry, 2020 to 2024
    • Current and Future Market Size Value (USD Million) Analysis and Forecast By End Use Industry, 2025 to 2035
      • Oil & Gas
      • Power Generation
      • Aerospace & Defense
      • Automotive & Transportation
      • Others
    • Y-o-Y Growth Trend Analysis By End Use Industry, 2020 to 2024
    • Absolute $ Opportunity Analysis By End Use Industry, 2025 to 2035
  8. Global Market Analysis 2020 to 2024 and Forecast 2025 to 2035, By Region
    • Introduction
    • Historical Market Size Value (USD Million) Analysis By Region, 2020 to 2024
    • Current Market Size Value (USD Million) Analysis and Forecast By Region, 2025 to 2035
      • North America
      • Latin America
      • Western Europe
      • Eastern Europe
      • East Asia
      • South Asia and Pacific
      • Middle East & Africa
    • Market Attractiveness Analysis By Region
  9. North America Market Analysis 2020 to 2024 and Forecast 2025 to 2035, By Country
    • Historical Market Size Value (USD Million) Trend Analysis By Market Taxonomy, 2020 to 2024
    • Market Size Value (USD Million) Forecast By Market Taxonomy, 2025 to 2035
      • By Country
        • USA
        • Canada
        • Mexico
      • By Component
      • By End Use Industry
    • Market Attractiveness Analysis
      • By Country
      • By Component
      • By End Use Industry
    • Key Takeaways
  10. Latin America Market Analysis 2020 to 2024 and Forecast 2025 to 2035, By Country
    • Historical Market Size Value (USD Million) Trend Analysis By Market Taxonomy, 2020 to 2024
    • Market Size Value (USD Million) Forecast By Market Taxonomy, 2025 to 2035
      • By Country
        • Brazil
        • Chile
        • Rest of Latin America
      • By Component
      • By End Use Industry
    • Market Attractiveness Analysis
      • By Country
      • By Component
      • By End Use Industry
    • Key Takeaways
  11. Western Europe Market Analysis 2020 to 2024 and Forecast 2025 to 2035, By Country
    • Historical Market Size Value (USD Million) Trend Analysis By Market Taxonomy, 2020 to 2024
    • Market Size Value (USD Million) Forecast By Market Taxonomy, 2025 to 2035
      • By Country
        • Germany
        • UK
        • Italy
        • Spain
        • France
        • Nordic
        • BENELUX
        • Rest of Western Europe
      • By Component
      • By End Use Industry
    • Market Attractiveness Analysis
      • By Country
      • By Component
      • By End Use Industry
    • Key Takeaways
  12. Eastern Europe Market Analysis 2020 to 2024 and Forecast 2025 to 2035, By Country
    • Historical Market Size Value (USD Million) Trend Analysis By Market Taxonomy, 2020 to 2024
    • Market Size Value (USD Million) Forecast By Market Taxonomy, 2025 to 2035
      • By Country
        • Russia
        • Poland
        • Hungary
        • Balkan & Baltic
        • Rest of Eastern Europe
      • By Component
      • By End Use Industry
    • Market Attractiveness Analysis
      • By Country
      • By Component
      • By End Use Industry
    • Key Takeaways
  13. East Asia Market Analysis 2020 to 2024 and Forecast 2025 to 2035, By Country
    • Historical Market Size Value (USD Million) Trend Analysis By Market Taxonomy, 2020 to 2024
    • Market Size Value (USD Million) Forecast By Market Taxonomy, 2025 to 2035
      • By Country
        • China
        • Japan
        • South Korea
      • By Component
      • By End Use Industry
    • Market Attractiveness Analysis
      • By Country
      • By Component
      • By End Use Industry
    • Key Takeaways
  14. South Asia and Pacific Market Analysis 2020 to 2024 and Forecast 2025 to 2035, By Country
    • Historical Market Size Value (USD Million) Trend Analysis By Market Taxonomy, 2020 to 2024
    • Market Size Value (USD Million) Forecast By Market Taxonomy, 2025 to 2035
      • By Country
        • India
        • ASEAN
        • Australia & New Zealand
        • Rest of South Asia and Pacific
      • By Component
      • By End Use Industry
    • Market Attractiveness Analysis
      • By Country
      • By Component
      • By End Use Industry
    • Key Takeaways
  15. Middle East & Africa Market Analysis 2020 to 2024 and Forecast 2025 to 2035, By Country
    • Historical Market Size Value (USD Million) Trend Analysis By Market Taxonomy, 2020 to 2024
    • Market Size Value (USD Million) Forecast By Market Taxonomy, 2025 to 2035
      • By Country
        • Kingdom of Saudi Arabia
        • Other GCC Countries
        • Turkiye
        • South Africa
        • Other African Union
        • Rest of Middle East & Africa
      • By Component
      • By End Use Industry
    • Market Attractiveness Analysis
      • By Country
      • By Component
      • By End Use Industry
    • Key Takeaways
  16. Key Countries Market Analysis
    • USA
      • Pricing Analysis
      • Market Share Analysis, 2024
        • By Component
        • By End Use Industry
    • Canada
      • Pricing Analysis
      • Market Share Analysis, 2024
        • By Component
        • By End Use Industry
    • Mexico
      • Pricing Analysis
      • Market Share Analysis, 2024
        • By Component
        • By End Use Industry
    • Brazil
      • Pricing Analysis
      • Market Share Analysis, 2024
        • By Component
        • By End Use Industry
    • Chile
      • Pricing Analysis
      • Market Share Analysis, 2024
        • By Component
        • By End Use Industry
    • Germany
      • Pricing Analysis
      • Market Share Analysis, 2024
        • By Component
        • By End Use Industry
    • UK
      • Pricing Analysis
      • Market Share Analysis, 2024
        • By Component
        • By End Use Industry
    • Italy
      • Pricing Analysis
      • Market Share Analysis, 2024
        • By Component
        • By End Use Industry
    • Spain
      • Pricing Analysis
      • Market Share Analysis, 2024
        • By Component
        • By End Use Industry
    • France
      • Pricing Analysis
      • Market Share Analysis, 2024
        • By Component
        • By End Use Industry
    • India
      • Pricing Analysis
      • Market Share Analysis, 2024
        • By Component
        • By End Use Industry
    • ASEAN
      • Pricing Analysis
      • Market Share Analysis, 2024
        • By Component
        • By End Use Industry
    • Australia & New Zealand
      • Pricing Analysis
      • Market Share Analysis, 2024
        • By Component
        • By End Use Industry
    • China
      • Pricing Analysis
      • Market Share Analysis, 2024
        • By Component
        • By End Use Industry
    • Japan
      • Pricing Analysis
      • Market Share Analysis, 2024
        • By Component
        • By End Use Industry
    • South Korea
      • Pricing Analysis
      • Market Share Analysis, 2024
        • By Component
        • By End Use Industry
    • Russia
      • Pricing Analysis
      • Market Share Analysis, 2024
        • By Component
        • By End Use Industry
    • Poland
      • Pricing Analysis
      • Market Share Analysis, 2024
        • By Component
        • By End Use Industry
    • Hungary
      • Pricing Analysis
      • Market Share Analysis, 2024
        • By Component
        • By End Use Industry
    • Kingdom of Saudi Arabia
      • Pricing Analysis
      • Market Share Analysis, 2024
        • By Component
        • By End Use Industry
    • Turkiye
      • Pricing Analysis
      • Market Share Analysis, 2024
        • By Component
        • By End Use Industry
    • South Africa
      • Pricing Analysis
      • Market Share Analysis, 2024
        • By Component
        • By End Use Industry
  17. Market Structure Analysis
    • Competition Dashboard
    • Competition Benchmarking
    • Market Share Analysis of Top Players
      • By Regional
      • By Component
      • By End Use Industry
  18. Competition Analysis
    • Competition Deep Dive
      • Baker Hughes Company
        • Overview
        • Product Portfolio
        • Profitability by Market Segments (Product/Age /Sales Channel/Region)
        • Sales Footprint
        • Strategy Overview
          • Marketing Strategy
          • Product Strategy
          • Channel Strategy
      • MISTRAS Group Inc.
      • Intertek Group PLC
      • Olympus Corporation
      • Zetec Inc. (Eddyfi Technologies)
      • Advanced NDT Ltd.
      • Johnson & Allen Ltd
      • ROSEN Group
      • OKOndt GROUP
      • Bureau Veritas SA
      • Applus Services SA
  19. Assumptions & Acronyms Used
  20. Research Methodology

List of Tables

  • Table 1: Global Market Value (USD Million) Forecast by Region, 2020 to 2035
  • Table 2: Global Market Value (USD Million) Forecast by Component , 2020 to 2035
  • Table 3: Global Market Value (USD Million) Forecast by End Use Industry, 2020 to 2035
  • Table 4: North America Market Value (USD Million) Forecast by Country, 2020 to 2035
  • Table 5: North America Market Value (USD Million) Forecast by Component , 2020 to 2035
  • Table 6: North America Market Value (USD Million) Forecast by End Use Industry, 2020 to 2035
  • Table 7: Latin America Market Value (USD Million) Forecast by Country, 2020 to 2035
  • Table 8: Latin America Market Value (USD Million) Forecast by Component , 2020 to 2035
  • Table 9: Latin America Market Value (USD Million) Forecast by End Use Industry, 2020 to 2035
  • Table 10: Western Europe Market Value (USD Million) Forecast by Country, 2020 to 2035
  • Table 11: Western Europe Market Value (USD Million) Forecast by Component , 2020 to 2035
  • Table 12: Western Europe Market Value (USD Million) Forecast by End Use Industry, 2020 to 2035
  • Table 13: Eastern Europe Market Value (USD Million) Forecast by Country, 2020 to 2035
  • Table 14: Eastern Europe Market Value (USD Million) Forecast by Component , 2020 to 2035
  • Table 15: Eastern Europe Market Value (USD Million) Forecast by End Use Industry, 2020 to 2035
  • Table 16: East Asia Market Value (USD Million) Forecast by Country, 2020 to 2035
  • Table 17: East Asia Market Value (USD Million) Forecast by Component , 2020 to 2035
  • Table 18: East Asia Market Value (USD Million) Forecast by End Use Industry, 2020 to 2035
  • Table 19: South Asia and Pacific Market Value (USD Million) Forecast by Country, 2020 to 2035
  • Table 20: South Asia and Pacific Market Value (USD Million) Forecast by Component , 2020 to 2035
  • Table 21: South Asia and Pacific Market Value (USD Million) Forecast by End Use Industry, 2020 to 2035
  • Table 22: Middle East & Africa Market Value (USD Million) Forecast by Country, 2020 to 2035
  • Table 23: Middle East & Africa Market Value (USD Million) Forecast by Component , 2020 to 2035
  • Table 24: Middle East & Africa Market Value (USD Million) Forecast by End Use Industry, 2020 to 2035

List of Figures

  • Figure 1: Global Market Pricing Analysis
  • Figure 2: Global Market Value (USD Million) Forecast 2020 to 2035
  • Figure 3: Global Market Value Share and BPS Analysis by Component , 2025 and 2035
  • Figure 4: Global Market Y-o-Y Growth Comparison by Component , 2025 to 2035
  • Figure 5: Global Market Attractiveness Analysis by Component
  • Figure 6: Global Market Value Share and BPS Analysis by End Use Industry, 2025 and 2035
  • Figure 7: Global Market Y-o-Y Growth Comparison by End Use Industry, 2025 to 2035
  • Figure 8: Global Market Attractiveness Analysis by End Use Industry
  • Figure 9: Global Market Value (USD Million) Share and BPS Analysis by Region, 2025 and 2035
  • Figure 10: Global Market Y-o-Y Growth Comparison by Region, 2025 to 2035
  • Figure 11: Global Market Attractiveness Analysis by Region
  • Figure 12: North America Market Incremental Dollar Opportunity, 2025 to 2035
  • Figure 13: Latin America Market Incremental Dollar Opportunity, 2025 to 2035
  • Figure 14: Western Europe Market Incremental Dollar Opportunity, 2025 to 2035
  • Figure 15: Eastern Europe Market Incremental Dollar Opportunity, 2025 to 2035
  • Figure 16: East Asia Market Incremental Dollar Opportunity, 2025 to 2035
  • Figure 17: South Asia and Pacific Market Incremental Dollar Opportunity, 2025 to 2035
  • Figure 18: Middle East & Africa Market Incremental Dollar Opportunity, 2025 to 2035
  • Figure 19: North America Market Value Share and BPS Analysis by Country, 2025 and 2035
  • Figure 20: North America Market Value Share and BPS Analysis by Component , 2025 and 2035
  • Figure 21: North America Market Y-o-Y Growth Comparison by Component , 2025 to 2035
  • Figure 22: North America Market Attractiveness Analysis by Component
  • Figure 23: North America Market Value Share and BPS Analysis by End Use Industry, 2025 and 2035
  • Figure 24: North America Market Y-o-Y Growth Comparison by End Use Industry, 2025 to 2035
  • Figure 25: North America Market Attractiveness Analysis by End Use Industry
  • Figure 26: Latin America Market Value Share and BPS Analysis by Country, 2025 and 2035
  • Figure 27: Latin America Market Value Share and BPS Analysis by Component , 2025 and 2035
  • Figure 28: Latin America Market Y-o-Y Growth Comparison by Component , 2025 to 2035
  • Figure 29: Latin America Market Attractiveness Analysis by Component
  • Figure 30: Latin America Market Value Share and BPS Analysis by End Use Industry, 2025 and 2035
  • Figure 31: Latin America Market Y-o-Y Growth Comparison by End Use Industry, 2025 to 2035
  • Figure 32: Latin America Market Attractiveness Analysis by End Use Industry
  • Figure 33: Western Europe Market Value Share and BPS Analysis by Country, 2025 and 2035
  • Figure 34: Western Europe Market Value Share and BPS Analysis by Component , 2025 and 2035
  • Figure 35: Western Europe Market Y-o-Y Growth Comparison by Component , 2025 to 2035
  • Figure 36: Western Europe Market Attractiveness Analysis by Component
  • Figure 37: Western Europe Market Value Share and BPS Analysis by End Use Industry, 2025 and 2035
  • Figure 38: Western Europe Market Y-o-Y Growth Comparison by End Use Industry, 2025 to 2035
  • Figure 39: Western Europe Market Attractiveness Analysis by End Use Industry
  • Figure 40: Eastern Europe Market Value Share and BPS Analysis by Country, 2025 and 2035
  • Figure 41: Eastern Europe Market Value Share and BPS Analysis by Component , 2025 and 2035
  • Figure 42: Eastern Europe Market Y-o-Y Growth Comparison by Component , 2025 to 2035
  • Figure 43: Eastern Europe Market Attractiveness Analysis by Component
  • Figure 44: Eastern Europe Market Value Share and BPS Analysis by End Use Industry, 2025 and 2035
  • Figure 45: Eastern Europe Market Y-o-Y Growth Comparison by End Use Industry, 2025 to 2035
  • Figure 46: Eastern Europe Market Attractiveness Analysis by End Use Industry
  • Figure 47: East Asia Market Value Share and BPS Analysis by Country, 2025 and 2035
  • Figure 48: East Asia Market Value Share and BPS Analysis by Component , 2025 and 2035
  • Figure 49: East Asia Market Y-o-Y Growth Comparison by Component , 2025 to 2035
  • Figure 50: East Asia Market Attractiveness Analysis by Component
  • Figure 51: East Asia Market Value Share and BPS Analysis by End Use Industry, 2025 and 2035
  • Figure 52: East Asia Market Y-o-Y Growth Comparison by End Use Industry, 2025 to 2035
  • Figure 53: East Asia Market Attractiveness Analysis by End Use Industry
  • Figure 54: South Asia and Pacific Market Value Share and BPS Analysis by Country, 2025 and 2035
  • Figure 55: South Asia and Pacific Market Value Share and BPS Analysis by Component , 2025 and 2035
  • Figure 56: South Asia and Pacific Market Y-o-Y Growth Comparison by Component , 2025 to 2035
  • Figure 57: South Asia and Pacific Market Attractiveness Analysis by Component
  • Figure 58: South Asia and Pacific Market Value Share and BPS Analysis by End Use Industry, 2025 and 2035
  • Figure 59: South Asia and Pacific Market Y-o-Y Growth Comparison by End Use Industry, 2025 to 2035
  • Figure 60: South Asia and Pacific Market Attractiveness Analysis by End Use Industry
  • Figure 61: Middle East & Africa Market Value Share and BPS Analysis by Country, 2025 and 2035
  • Figure 62: Middle East & Africa Market Value Share and BPS Analysis by Component , 2025 and 2035
  • Figure 63: Middle East & Africa Market Y-o-Y Growth Comparison by Component , 2025 to 2035
  • Figure 64: Middle East & Africa Market Attractiveness Analysis by Component
  • Figure 65: Middle East & Africa Market Value Share and BPS Analysis by End Use Industry, 2025 and 2035
  • Figure 66: Middle East & Africa Market Y-o-Y Growth Comparison by End Use Industry, 2025 to 2035
  • Figure 67: Middle East & Africa Market Attractiveness Analysis by End Use Industry
  • Figure 68: Global Market – Tier Structure Analysis
  • Figure 69: Global Market – Company Share Analysis

Frequently Asked Questions

How big is the ultrasonic NDT equipment market in 2025?

The global ultrasonic NDT equipment market is estimated to be valued at USD 24.0 billion in 2025.

What will be the size of ultrasonic NDT equipment market in 2035?

The market size for the ultrasonic NDT equipment market is projected to reach USD 49.5 billion by 2035.

How much will be the ultrasonic NDT equipment market growth between 2025 and 2035?

The ultrasonic NDT equipment market is expected to grow at a 7.5% CAGR between 2025 and 2035.

What are the key product types in the ultrasonic NDT equipment market?

The key product types in ultrasonic NDT equipment market are equipment and service.

Which end use industry segment to contribute significant share in the ultrasonic NDT equipment market in 2025?

In terms of end use industry, oil & gas segment to command 32.7% share in the ultrasonic NDT equipment market in 2025.

Explore Similar Insights

Future Market Insights

Ultrasonic NDT Equipment Market

Chat With MaRIA

Chat With

MaRIA

Hi There, I am MaRIA, Your Market Research Intelligence Assistant. How may I help you?