The global urea formaldehyde market is projected to reach USD 40.3 billion by 2035, recording an absolute increase of USD 6.6 billion over the forecast period. The market is valued at USD 33.7 billion in 2025 and is set to rise at a CAGR of 1.8% during the assessment period. The overall market size is expected to grow by nearly 1.2 times during the same period, supported by increasing demand for engineered wood panels in construction and furniture applications worldwide, driving demand for efficient adhesive and bonding systems and increasing investments in low-emission resin formulations and sustainable building material projects globally. However, formaldehyde emission regulations and competition from alternative bio-based adhesives may pose challenges to market expansion.
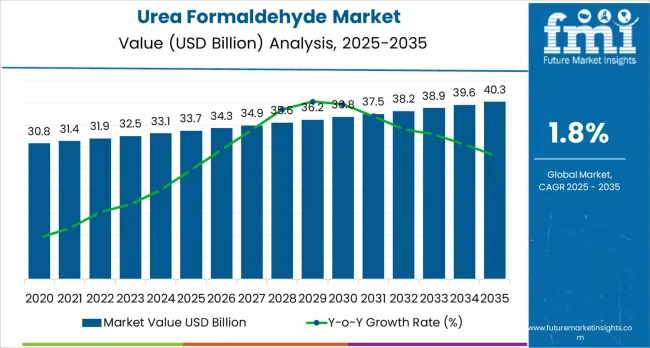
Between 2025 and 2030, the urea formaldehyde market is projected to expand from USD 33.7 billion to USD 36.7 billion, resulting in a value increase of USD 3.0 billion, which represents 45.5% of the total forecast growth for the decade. This phase of development will be shaped by rising demand for composite wood panels and low-emission adhesive systems, product innovation in ultra-low formaldehyde resin technologies and hybrid bonding formulations, as well as expanding integration with green building certification programs and sustainable furniture manufacturing initiatives. Companies are establishing competitive positions through investment in emission control technologies, E0/E1 compliant formulations, and strategic partnerships with engineered wood producers and furniture manufacturers.
From 2030 to 2035, the market is forecast to grow from USD 36.7 billion to USD 40.3 billion, adding another USD 3.6 billion, which constitutes 54.5% of the overall ten-year expansion. This period is expected to be characterized by the expansion of specialized low-emission systems, including next-generation ultra-low formaldehyde and formaldehyde-free alternatives tailored for stringent indoor air quality requirements, strategic collaborations between resin producers and panel manufacturers, and an enhanced focus on circular economy principles and bio-based feedstock integration. The growing emphasis on indoor air quality standards and sustainable construction materials will drive demand for advanced, environmentally compliant urea formaldehyde solutions across diverse building and furniture applications.
| Metric | Value |
|---|---|
| Market Value (2025) | USD 33.7 billion |
| Market Forecast Value (2035) | USD 40.3 billion |
| Forecast CAGR (2025-2035) | 1.8% |
The urea formaldehyde market grows by enabling engineered wood manufacturers to produce cost-effective composite panels including particleboard, medium-density fiberboard, and plywood that serve construction and furniture industries requiring affordable building materials. Wood panel producers face mounting pressure to reduce production costs while maintaining structural performance, with urea formaldehyde resins providing 30-40% cost advantages compared to phenol-formaldehyde and other alternative adhesive systems, making UF resins essential for mass-market furniture, cabinetry, and interior construction applications. The affordable housing movement's need for economical building materials creates sustained demand for UF-bonded engineered wood panels offering dimensional stability, smooth surface finish, and paintability characteristics supporting interior applications.
Government initiatives promoting residential construction and infrastructure modernization drive engineered wood consumption across developing economies, where UF resins enable locally produced panels substituting imported materials and solid wood in cost-sensitive markets. The modular furniture industry's growth accelerates particleboard and MDF demand, with flat-pack furniture manufacturers including IKEA and regional producers requiring consistent panel properties and surface quality enabled by optimized UF adhesive formulations. However, increasingly stringent formaldehyde emission regulations including CARB Phase 2, EPA TSCA Title VI, and European E1/E0 standards require costly resin reformulation and production process modifications, while emerging bio-based adhesives including soy protein, lignin, and tannin-based systems pose long-term substitution threats in environmentally conscious markets despite current performance and cost limitations.
The market is segmented by form, end use, and region. By form, the market is divided into powder, liquid, and solid/prills. Based on end use, the market is categorized into building &construction, furniture &joinery, agriculture, automotive/transport, electrical &electronics, and others. Regionally, the market is divided into Asia Pacific, Europe, North America, Latin America, and Middle East &Africa.
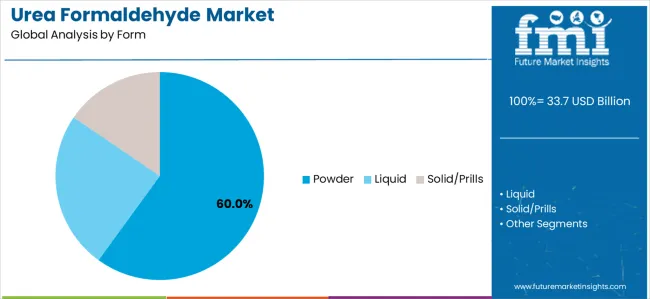
The powder form segment represents the dominant force in the urea formaldehyde market, capturing approximately 60.0% of total market share in 2025. This established product format encompasses spray-dried resin powders offering extended shelf life, reduced transportation costs, and flexible reconstitution capabilities suited for diverse panel manufacturing operations across particleboard, MDF, and plywood production facilities. The powder segment's market leadership stems from logistical advantages including lower shipping weights compared to liquid resins, reduced storage space requirements enabling inventory optimization, and elimination of freezing concerns in cold-climate logistics enabling year-round distribution efficiency.
The liquid form segment maintains a substantial 34.0% market share, serving manufacturers requiring ready-to-use formulations with simplified mixing operations and immediate application capabilities in automated resin spreading systems. Solid/prills capture 6.0% market share through specialty applications including slow-release fertilizer coatings and niche industrial uses requiring granular formats.
Key advantages driving the powder segment include:
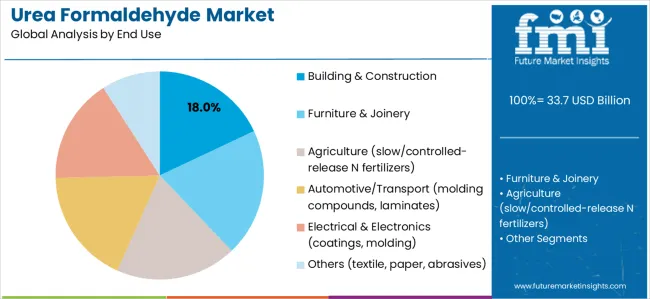
Building &construction applications dominate the urea formaldehyde market with approximately 18.0% market share in 2025, reflecting the critical role of UF-bonded engineered wood panels in residential construction, commercial buildings, and infrastructure development. This segment encompasses particleboard and MDF utilization in wall sheathing, subflooring, roof decking, and interior partition systems where cost-effectiveness, dimensional stability, and ease of installation provide advantages over traditional solid wood construction materials.
The furniture &joinery segment represents 31.0% market share through kitchen cabinetry, office furniture, bedroom sets, and modular furniture systems where UF-bonded panels offer smooth surfaces for veneer application, lamination, and painted finishes. Agriculture captures 12.0% market share via slow-release and controlled-release nitrogen fertilizer coatings extending nutrient availability. Automotive/transport accounts for 10.0% through molding compounds and decorative laminates, electrical &electronics represents 8.0%, while other applications including textiles, paper, and abrasives comprise 4.0% of the market.
Key end-use drivers include:
The market is driven by three concrete demand factors tied to construction and furniture manufacturing economics. First, engineered wood panel production growth accelerates globally with particleboard, MDF, and plywood consumption exceeding 400 million cubic meters annually and growing 3-5% in developing markets, requiring proportional UF resin supply as the dominant adhesive system for wood composite manufacturing representing 80-85% of total resin usage in panel production. Second, cost competitiveness versus alternative adhesive systems sustains UF market position, with urea formaldehyde resins priced 30-50% below phenol-formaldehyde, melamine-formaldehyde, and polyurethane adhesives enabling mass-market furniture and construction applications where material costs significantly impact product pricing and market accessibility. Third, urbanization and housing development in Asia, Latin America, and Africa drive construction material demand, with affordable housing initiatives requiring economical building systems where UF-bonded engineered wood provides essential combination of performance, availability, and cost-effectiveness supporting rapid residential development.
Market restraints include increasingly stringent formaldehyde emission regulations globally, with CARB Phase 2 limiting emissions to 0.09 ppm for particleboard and 0.11 ppm for MDF, EPA TSCA Title VI establishing comparable federal standards, and European regulations requiring E1 (0.124 mg/m³) or E0 (0.05 mg/m³) compliance necessitating costly resin reformulation, process modifications, and testing infrastructure investments. Health concerns regarding formaldehyde exposure create consumer resistance and regulatory pressure, despite low emission levels from compliant panels, with perceived health risks affecting market acceptance particularly in developed markets where consumers increasingly scrutinize chemical content in building materials and furniture products. Competition from bio-based and formaldehyde-free adhesives intensifies, as soy protein, lignin, tannin, and other renewable adhesive technologies advance technically while regulatory preferences and green building certifications favor non-formaldehyde systems despite current cost premiums of 50-100% and performance limitations in moisture resistance.
Key trends indicate accelerating adoption of ultra-low emission UF formulations, with resin manufacturers developing advanced chemistry including urea-melamine-formaldehyde hybrids, modified resins with formaldehyde scavengers, and optimized curing systems achieving emissions below 0.05 ppm meeting strictest E0 and CARB requirements. Technology advancement trends toward process integration combining resin application optimization, press cycle modifications, and post-treatment systems enabling emission compliance without compromising bond strength, water resistance, or production economics. However, the market thesis could face disruption if bio-based adhesives achieve technical parity with conventional UF resins at competitive costs, or if regulatory frameworks mandate complete formaldehyde elimination rather than emission reduction, potentially restructuring engineered wood adhesive markets toward alternative chemistries and significantly reducing UF market size.
| Country | CAGR (2025-2035) |
|---|---|
| India | 2.5% |
| China | 2.2% |
| Brazil | 2.0% |
| USA | 1.8% |
| Germany | 1.7% |
| France | 1.6% |
| UK | 1.5% |
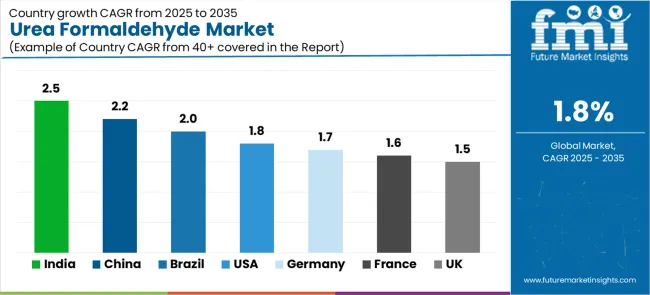
The urea formaldehyde market is gaining momentum worldwide, with India taking the lead thanks to housing upgrades utilizing MDF and particleboard plus rapid modular furniture adoption supporting panel manufacturer investments in E1/E0 production lines. Close behind, China benefits from the world's largest engineered wood panel manufacturing base sustaining massive UF demand and ongoing retrofits to low-emission resins meeting indoor air quality standards. Brazil shows solid advancement, where capacity additions in southern panel manufacturing clusters and furniture exports strengthen its role in Latin American construction materials supply chains. The USA demonstrates steady growth through residential renovation and repair activity plus CARB/EPA compliant ultra-low-emission UF grades in cabinetry and furniture applications. Meanwhile, Germany stands out for its premium engineered wood production with E0/E1 compliance and strong kitchen/furniture export base, while France and the UK continue to record consistent progress in decorative laminates and modular construction applications. Together, India and China anchor the global expansion story, while mature markets build quality and compliance capabilities into the market's growth path.
The report covers an in-depth analysis of 40+ countries top-performing countries are highlighted below.
India demonstrates the strongest growth potential in the Urea Formaldehyde Market with a CAGR of 2.5% through 2035. The country's leadership position stems from rapid urbanization driving housing construction, government affordable housing initiatives under PMAY scheme, and expanding middle-class furniture consumption supporting engineered wood panel demand growth. Growth is concentrated in major panel manufacturing regions including Gujarat, Maharashtra, Karnataka, and Punjab, where particleboard and MDF producers are implementing modern pressing technologies and low-emission UF resin systems serving domestic construction and export furniture markets. Distribution channels through building material distributors, furniture manufacturers, and direct panel supply relationships expand deployment across residential construction, modular furniture production, and commercial interior fit-out applications. The country's Make in India initiatives provide policy support for domestic panel manufacturing capacity development, including incentives for technology upgrades and environmental compliance systems.
Key market factors:
In Shandong, Jiangsu, Guangdong, and Hebei provinces, the operation of massive engineered wood panel manufacturing complexes sustains the world's largest UF resin consumption, driven by domestic construction demand and furniture export production serving global markets. The market demonstrates strong growth momentum with a CAGR of 2.2% through 2035, linked to ongoing panel capacity utilization and regulatory retrofits requiring low-emission resin adoption. Chinese panel manufacturers operate integrated production facilities combining resin synthesis, board pressing, and surface finishing operations achieving scale economies and supply chain efficiencies. The country's environmental regulations requiring formaldehyde emission reductions create sustained demand for ultra-low emission UF formulations while maintaining cost competitiveness in mass-market applications.
Brazil's market expansion is driven by growing construction activity in southern states, expanding furniture export industry, and panel manufacturer investments in emission-reduced UF resin systems. The country demonstrates solid growth potential with a CAGR of 2.0% through 2035, supported by residential construction programs, furniture industry competitiveness in North American and European markets, and domestic resin production capabilities. Brazilian panel manufacturers in Paraná, Santa Catarina, and Rio Grande do Sul operate modern facilities serving both domestic construction markets and export furniture production requiring compliance with international emission standards. The country's forestry plantation base providing eucalyptus and pine raw materials supports integrated wood products industry including engineered panel production.
Market characteristics:
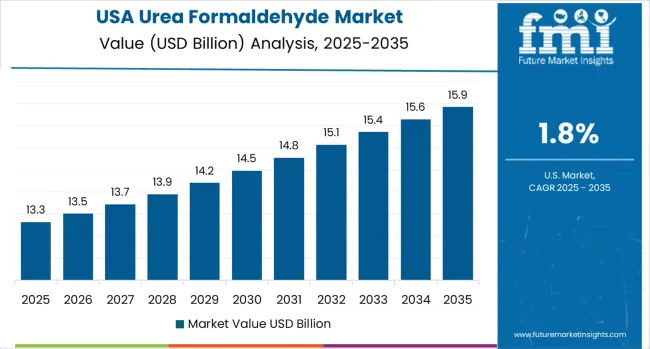
The USA market leads in regulatory compliance based on CARB Phase 2 and EPA TSCA Title VI requirements establishing strictest global formaldehyde emission standards for composite wood products. The country shows steady potential with a CAGR of 1.8% through 2035, driven by residential renovation and repair activity, kitchen and bath remodeling demand, and commercial office fit-out applications requiring compliant engineered wood panels. American panel manufacturers and importers implement comprehensive compliance programs including certified resin systems, third-party testing, and chain-of-custody documentation ensuring regulatory conformance. Technology deployment emphasizes ultra-low emission UF formulations, quality assurance systems, and alternative adhesive evaluation supporting industry adaptation to stringent emission requirements while maintaining cost competitiveness.
Leading market segments:
Germany's urea formaldehyde market demonstrates sophisticated implementation focused on premium engineered wood production, E0/E1 emission compliance, and export-oriented furniture and kitchen cabinetry manufacturing. The country maintains steady growth with a CAGR of 1.7% through 2035, driven by high-quality panel production standards, stringent environmental regulations, and strong furniture industry competitiveness in European and global markets. German panel manufacturers operate advanced production facilities utilizing ultra-low emission UF resins, phenol-UF hybrids, and alternative adhesive systems meeting strictest indoor air quality requirements. The country's furniture manufacturing concentration in North Rhine-Westphalia, Bavaria, and Lower Saxony creates sustained demand for premium-grade panels supporting export-oriented kitchen and furniture production.
Key market characteristics:
France's urea formaldehyde market benefits from decorative laminate production, interior refurbishment activity, and public infrastructure projects specifying low-emission engineered wood panels. The market maintains steady growth with a CAGR of 1.6% through 2035, driven by residential renovation programs, commercial interior design applications, and green building certification adoption requiring compliant materials. French panel consumers including furniture manufacturers, construction contractors, and interior designers specify E1-compliant products meeting French VOC regulations and European emission standards. The country's position as major furniture producer and consumer creates sustained particleboard and MDF demand for domestic manufacturing and imported finished products.
Market development factors:
The UK's urea formaldehyde market showcases reliance on imported engineered wood panels from European suppliers, with domestic consumption driven by joinery, fitted furniture, and modular construction applications. The market maintains modest growth with a CAGR of 1.5% through 2035, linked to residential refurbishment activity, kitchen and bedroom furniture demand, and emerging modular housing initiatives. British consumers prioritize low-emission panels meeting UK Building Regulations and voluntary environmental certifications, with increasing awareness of formaldehyde concerns driving specification of compliant products. The country's limited domestic panel production capacity necessitates imports from European manufacturers providing certified low-emission products serving UK construction and furniture industries.
Key market characteristics:
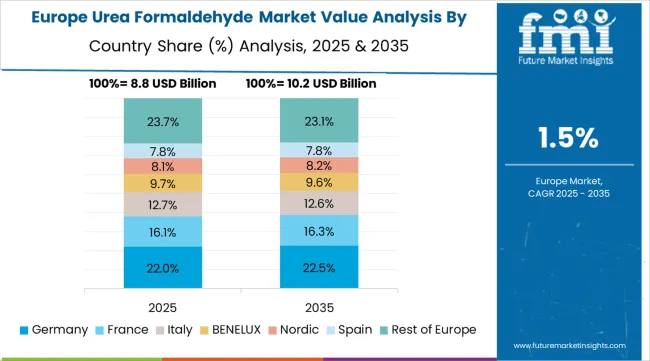
The urea formaldehyde market in Europe is projected to grow from USD 8.1 billion in 2025 to USD 9.5 billion by 2035, registering a CAGR of 1.6% over the forecast period. Germany is expected to maintain its leadership position with a 27.0% market share in 2025, holding steady at 27.0% by 2035, supported by its extensive engineered wood manufacturing infrastructure and major panel production centers in North Rhine-Westphalia, Bavaria, and Lower Saxony serving furniture and construction markets with premium E0/E1 compliant products.
Italy follows with an 18.0% share in 2025, projected to reach 18.5% by 2035, driven by furniture manufacturing concentration and decorative panel production for domestic and export markets. France holds a 16.0% share in 2025, maintaining 16.0% by 2035 through interior refurbishment demand and laminate production applications. The United Kingdom commands a 14.0% share in 2025, easing to 13.5% by 2035 backed by joinery and fitted furniture consumption with high import dependency. Spain accounts for 9.0% in 2025, rising to 9.5% by 2035 on construction recovery and furniture manufacturing growth. Benelux &Nordics maintain 9.0% combined in 2025, reaching 9.5% by 2035 driven by sustainable building practices and quality panel demand. Central &Eastern Europe holds 7.0% in 2025, rising to 6.0% by 2035 reflecting consolidation in leading production markets.
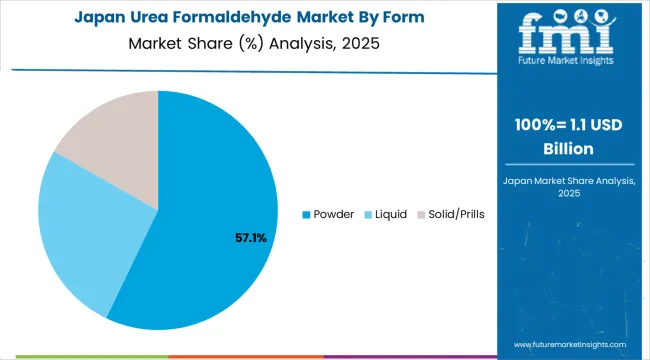
The Japanese urea formaldehyde market demonstrates sophisticated specialization, characterized by high-quality engineered wood panel production for residential construction, precision furniture manufacturing, and interior applications requiring exceptional surface quality and dimensional stability. Japan's emphasis on craftsmanship and quality standards drives demand for premium-grade UF resins meeting stringent formaldehyde emission requirements under Japanese Industrial Standards and Building Standards Law provisions addressing indoor air quality. The market benefits from established relationships between resin suppliers and panel manufacturers producing specialized products for tatami underlayment, decorative panels, and precision furniture components. Panel production facilities in Hokkaido, Tohoku, and Kyushu regions showcase advanced manufacturing where UF-bonded particleboard and MDF achieve superior surface smoothness, density uniformity, and emission performance supporting domestic housing construction and furniture industries.
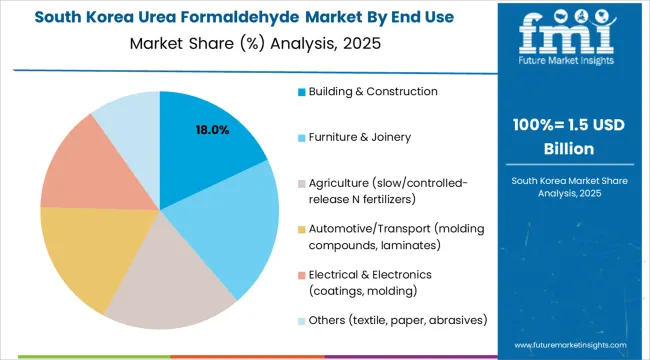
The South Korean urea formaldehyde market is characterized by diversified consumption across furniture manufacturing, construction applications, and industrial molding compounds serving electronics and automotive industries. The market demonstrates emphasis on quality standards and regulatory compliance, as Korean panel manufacturers and furniture producers increasingly adopt low-emission UF resins meeting indoor air quality regulations and export market requirements. Major furniture manufacturing regions including Seoul metropolitan area, Gyeonggi Province, and southern industrial zones utilize particleboard and MDF for residential furniture, office systems, and contract furnishing projects. Korean companies pursue technology advancement in UF chemistry, production process optimization, and alternative adhesive evaluation supporting industry competitiveness while addressing environmental regulations and changing consumer preferences regarding formaldehyde content in building materials and furniture products, with particular emphasis on children's furniture and bedroom applications requiring strictest emission standards.
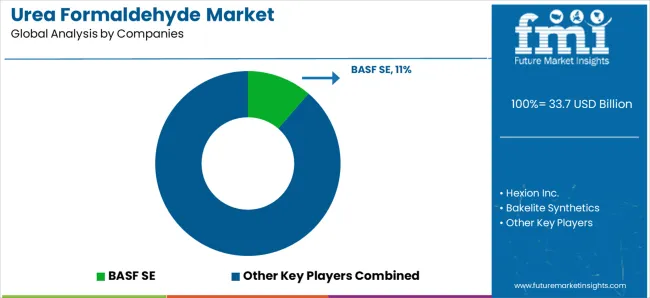
The urea formaldehyde market features approximately 40-50 meaningful players with moderate fragmentation, where the top three companies control roughly 25-30% of global market share through established production assets and regional distribution networks. Competition centers on emission performance, technical service, and regional presence rather than price competition alone. BASF SE leads with approximately 11.5% market share through its comprehensive resin portfolio, global manufacturing footprint, and technical expertise serving engineered wood panel manufacturers worldwide.
Market leaders include BASF SE, Hexion Inc., and Bakelite Synthetics, which maintain competitive advantages through decades of resin chemistry expertise, vertically integrated operations from formaldehyde through finished resins, and comprehensive technical support capabilities assisting panel manufacturers with process optimization, emission control, and regulatory compliance, creating strong customer relationships and switching costs. These companies leverage research and development capabilities advancing ultra-low emission formulations, global production networks enabling regional supply security, and quality assurance systems ensuring consistent performance across diverse panel manufacturing operations and end-use applications.
Challengers encompass Metadynea and Acron PJSC, which compete through specialized product portfolios and strong regional market positions in Europe and CIS markets respectively. Regional specialists including Sadepan Chimica, Capital Resin Corporation, and Asta Chemicals focus on specific geographic markets or application segments, offering differentiated capabilities in custom formulations, local technical service, and flexible supply arrangements serving regional panel manufacturers.
Emerging producers and regional chemical companies create competitive pressure through cost-effective production in high-growth markets, particularly in Asia-Pacific and Latin America where proximity to expanding panel manufacturing capacity provides logistics advantages and enables responsive technical support. Market dynamics favor companies combining proven resin technology with comprehensive emission control capabilities, regulatory expertise supporting customer compliance requirements, and technical service resources helping panel manufacturers optimize production processes while meeting increasingly stringent formaldehyde emission standards across global markets.
Urea formaldehyde represents cost-effective adhesive chemistry enabling engineered wood manufacturers to produce affordable composite panels delivering structural performance and surface quality characteristics essential for construction and furniture applications. With the market projected to grow from USD 33.7 billion in 2025 to USD 40.3 billion by 2035 at a 1.8% CAGR, these thermosetting resin systems offer compelling advantages - production economics, processing efficiency, and versatile performance characteristics - making them essential for building &construction applications (35.0% market share), furniture &joinery (31.0% share), and industries seeking alternatives to solid wood and alternative adhesives lacking cost-effectiveness in mass-market applications.
How Governments Could Spur Local Production and Adoption?
How Industry Bodies Could Support Market Development?
How OEMs and Technology Players Could Strengthen the Ecosystem?
How Suppliers Could Navigate the Shift?
How Investors and Financial Enablers Could Unlock Value?
| Item | Value |
|---|---|
| Quantitative Units | USD 33.7 billion |
| Form | Powder, Liquid, Solid/Prills |
| End Use | Building &Construction, Furniture &Joinery, Agriculture, Automotive/Transport, Electrical &Electronics, Others |
| Regions Covered | Asia Pacific, Europe, North America, Latin America, Middle East &Africa |
| Country Covered | India, China, Brazil, USA, Germany, France, UK, and 40+ countries |
| Key Companies Profiled | BASF SE, Hexion Inc., Bakelite Synthetics, Metadynea, Acron PJSC, Sadepan Chimica, Capital Resin Corporation, Asta Chemicals, ARCL Organics, Biqem |
| Additional Attributes | Dollar sales by form, end use, and regional categories, adoption trends across Asia Pacific, Europe, and North America, competitive landscape with resin producers and specialty chemical manufacturers, formulation specifications and emission control technologies, integration with engineered wood panel manufacturing and furniture production supply chains, innovations in ultra-low emission chemistry and hybrid adhesive systems, and development of E0/E1 compliant formulations with enhanced environmental performance supporting green building certification and indoor air quality requirements. |
The global urea formaldehyde market is estimated to be valued at USD 33.7 billion in 2025.
The market size for the urea formaldehyde market is projected to reach USD 40.3 billion by 2035.
The urea formaldehyde market is expected to grow at a 1.8% CAGR between 2025 and 2035.
The key product types in urea formaldehyde market are powder, liquid and solid/prills.
In terms of end use, building & construction segment to command 18.0% share in the urea formaldehyde market in 2025.


Our Research Products

The "Full Research Suite" delivers actionable market intel, deep dives on markets or technologies, so clients act faster, cut risk, and unlock growth.

The Leaderboard benchmarks and ranks top vendors, classifying them as Established Leaders, Leading Challengers, or Disruptors & Challengers.

Locates where complements amplify value and substitutes erode it, forecasting net impact by horizon

We deliver granular, decision-grade intel: market sizing, 5-year forecasts, pricing, adoption, usage, revenue, and operational KPIs—plus competitor tracking, regulation, and value chains—across 60 countries broadly.

Spot the shifts before they hit your P&L. We track inflection points, adoption curves, pricing moves, and ecosystem plays to show where demand is heading, why it is changing, and what to do next across high-growth markets and disruptive tech

Real-time reads of user behavior. We track shifting priorities, perceptions of today’s and next-gen services, and provider experience, then pace how fast tech moves from trial to adoption, blending buyer, consumer, and channel inputs with social signals (#WhySwitch, #UX).

Partner with our analyst team to build a custom report designed around your business priorities. From analysing market trends to assessing competitors or crafting bespoke datasets, we tailor insights to your needs.
Supplier Intelligence
Discovery & Profiling
Capacity & Footprint
Performance & Risk
Compliance & Governance
Commercial Readiness
Who Supplies Whom
Scorecards & Shortlists
Playbooks & Docs
Category Intelligence
Definition & Scope
Demand & Use Cases
Cost Drivers
Market Structure
Supply Chain Map
Trade & Policy
Operating Norms
Deliverables
Buyer Intelligence
Account Basics
Spend & Scope
Procurement Model
Vendor Requirements
Terms & Policies
Entry Strategy
Pain Points & Triggers
Outputs
Pricing Analysis
Benchmarks
Trends
Should-Cost
Indexation
Landed Cost
Commercial Terms
Deliverables
Brand Analysis
Positioning & Value Prop
Share & Presence
Customer Evidence
Go-to-Market
Digital & Reputation
Compliance & Trust
KPIs & Gaps
Outputs
Full Research Suite comprises of:
Market outlook & trends analysis
Interviews & case studies
Strategic recommendations
Vendor profiles & capabilities analysis
5-year forecasts
8 regions and 60+ country-level data splits
Market segment data splits
12 months of continuous data updates
DELIVERED AS:
PDF EXCEL ONLINE
Formaldehyde Removal Air Purifier Market Size and Share Forecast Outlook 2025 to 2035
Urea Strippers Market Size and Share Forecast Outlook 2025 to 2035
Formaldehyde-Free Resin Market Growth & Demand 2025 to 2035
Thiourea Market Size and Share Forecast Outlook 2025 to 2035
Paraformaldehyde Market Size and Share Forecast Outlook 2025 to 2035
Polyurea Coatings Market Growth - Trends & Forecast 2025 to 2035
Polyurea Greases Market
Blood Urea Nitrogen Diagnostics Market
Blood Urea Nitrogen Testing Market
Melamine Formaldehyde (MF) Market Size and Share Forecast Outlook 2025 to 2035
Service Bureau Market Analysis - Size, Growth, and Forecast 2025 to 2035
Sulphur Coated Urea Market Growth - Trends & Forecast 2025 to 2035
Nitrification and Urease Inhibitors Market Size and Share Forecast Outlook 2025 to 2035
Commercial Vehicle Urea Tank Market Size and Share Forecast Outlook 2025 to 2035
Currency Exchange Bureau Software Market – FinTech Evolution
Alkylation Melamine-Formaldehyde Resin for Coating Market Size and Share Forecast Outlook 2025 to 2035
Sulfonated Melamine Formaldehyde Market

Thank you!
You will receive an email from our Business Development Manager. Please be sure to check your SPAM/JUNK folder too.
Chat With
MaRIA