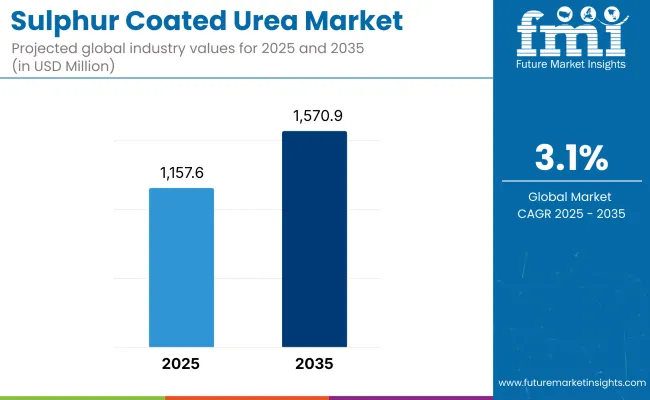
The sulphur coated urea (SCU) market is projected to grow steadily between 2025 and 2035, driven by rising global emphasis on enhanced-efficiency fertilizers (EEFs), increasing adoption of precision agriculture, and a growing focus on nitrogen loss reduction in soil. The market is expected to be valued at USD 1,157.6 million in 2025 and is anticipated to reach USD 1,570.9 million by 2035, reflecting a CAGR of 3.1% over the forecast period.
Sulphur coated urea is a slow-release nitrogen fertilizer that increases nutrient use efficiency while reducing leaching and volatilization, as well as prolonged nitrogen availability. Adoption of sulphur fertilisation is increasing due to the requirement for climate-smart farming practices, mitigation of waterway pollution, and the need for sulphur replenishment in sulphur-deficient soils. While SCU is classic solution for agriculture, there it faces many problems including scopes from polymer depot sources, cost limits in some regions, and also its sensitivity to aesthetic storage.
Some of the notable trends include integration with pre-prepared micronutrient blends, GIS-based variable rate application of fertilizer, carbon credit-linked fertilizer-routing programs, and slow-release urea composition for soils having high salinity.
North America is leading the way with SCU usage due to an established agricultural technology ecosystem, stricter nutrient runoff regulations, and large-scale turf management and golf course applications. SCU is gaining traction among 4R nutrient stewardship in corn and soybean producers in the USA SCU use is supported in sulphur-deficient prairie soils in Canada, with growing demand coming from urban landscaping and recreational turf.
Europe’s market is gaining further momentum by the EU-wide nitrogen use directives, organic transition strategies, and the expanding development of sustainable turf management in municipal areas. SCU is being used in rapeseed production, potato cultivation, and precision fertilizer programs in countries such as Germany, France, UK, Italy, and Netherlands. The region’s stringent emphasis on reducing emissions and minimizing leaching is driving the use of advanced-efficiency nitrogen sources such as SCU.
The fastest growing region, Asia-Pacific, is primarily driven by the demand for high-yield nutrient inputs coupled with the fertilizer efficiency awareness and increasing adoption of the formulations compatible with the drip & fustigation in China, India, Japan, South Korea, and Southeast Asia.
In China, for example, excessive urea application is being reduced as slow-release fertilizers get subsidies, while the government of India has pushed SCU use via soil health care programs and subsidy restructuring. SCU is used in Japan and South Korea for controlled-environment agriculture and ornamental horticulture.
Cost Premiums, Coating Cracks, and Competitive EEF Products
SCU production cost is much greater than conventional urea use, which restrict SCU application in price-sensitive farming environments. The nutrient release potential can be compromised by poor coating quality, which is worse under high humidity storage conditions or mechanical stress. Polymer-coated urea and urease/nitrification inhibitors are alternative technologies and provide much of the same efficiency gain, often more easily handled and with government support.
Climate-Smart Agri-Programs, Coating Innovations, and Sulphur Nutrition
there are opportunities involving SCU products compatible with climate mitigation efforts including carbon farm incentives, greenhouse gas reduction programs and zero-leaching initiatives. Advancements in technology in bio-based coating materials, nano-sulphur infusion, and multi-layer encapsulation are boosting the shelf stability and efficacy of the products. With intensively farmed soils being more sulphur-deficient, SCU is increasingly viewed as a dual-nutrient solution for nitrogen and sulphur management.
Sulphur coated urea market to grow by stable growth rate between 2020 to 2024 due to increasing number of slow and controlled-release fertilizers (CRFs) demand in agriculture, turf management, and horticulture. Its ability to minimize nitrogen loss, reduce leaching and improve nutrient use efficiency enabled SCU to be adapted for commercial farming and for professional landscaping.
The further extension of the market, included measures set up by the government to promote sustainable agriculture and limit environmental runoff. But the market penetration was limited by the availability of cheaper alternatives, inconsistent coating quality, and regulatory scrutiny regarding sulfur dust and microplastic residues in some formulations.
In addition, from 2025 to 2035, the market will be subject to innovations in bio-based coatings, precision nutrient delivery systems, and region-specific product optimization. The SCU will be redesigned with degradable, dust-free coatings and smart-release technologies that respond to soil moisture and temperature.
Its implementation in commercial crop production will be further revolutionized with integration of drone- and AI-assisted nutrient mapping along with climate-adaptive agronomic practices. With carbon-efficient farming being embraced around the globe, SCU will be the nexus between traditional fertilizer systems with next-generation regenerative agriculture.
Market Shifts: A Comparative Analysis 2020 to 2024 vs. 2025 to 2035
| Market Shift | 2020 to 2024 Trends |
|---|---|
| Regulatory Landscape | Compliance with nitrogen emission standards and regional fertilizer labeling laws. |
| Technological Innovation | Use of polymer-sulfur coating, basic release rate modulation via thickness control. |
| Industry Adoption | Popular in row crops, turf grass , golf courses, and horticultural applications. |
| Smart & AI-Enabled Solutions | Limited integration; SCU applied via traditional broadcast and spreader systems. |
| Market Competition | Led by Koch Industries, Agrium (Nutrien), Israel Chemicals Ltd. (ICL), and Helena Agri-Enterprises. |
| Market Growth Drivers | Demand for reduced nitrogen runoff, labor-saving fertilization, and improved crop yield efficiency. |
| Sustainability and Environmental Impact | Concern over microplastic residues and sulfur leaching in poorly coated products. |
| Integration of AI & Digitalization | Minimal use beyond farm-level nutrient planning spreadsheets. |
| Advancements in Product Design | Granular SCU with uniform size, standard sulfur-polymer coating. |
| Market Shift | 2025 to 2035 Projections |
|---|---|
| Regulatory Landscape | Mandatory carbon and leaching impact disclosure, restrictions on non-degradable coatings, and incentives for eco-certified controlled-release inputs. |
| Technological Innovation | Nano-engineered coatings, water-activated release triggers, biodegradable shell technology, and smart-blend SCU for crop-specific timing. |
| Industry Adoption | Expansion into vertical farming, saline soil reclamation, precision regenerative agriculture, and climate-resilient dryland farming. |
| Smart & AI-Enabled Solutions | AI-driven application mapping, drone-integrated delivery for high-value crops, and digital soil-condition-based nutrient release control. |
| Market Competition | Rising competition from biodegradable CRF innovators, localized SCU formulators, and agtech-integrated fertilizer solution providers. |
| Market Growth Drivers | Growth fueled by regenerative farming mandates, climate-smart crop input subsidies, and soil health-focused agronomic policies. |
| Sustainability and Environmental Impact | Full shift to biodegradable coatings, low-emission nutrient release models, and traceable eco-certification of SCU production and application. |
| Integration of AI & Digitalization | Integration with farm management software, AI-predicted release curve optimization, and IoT-linked soil moisture feedback loops. |
| Advancements in Product Design | Multi-layered smart-coated granules, microgranular SCU for root-zone targeting, and crop-cycle-specific nutrient timing customization. |
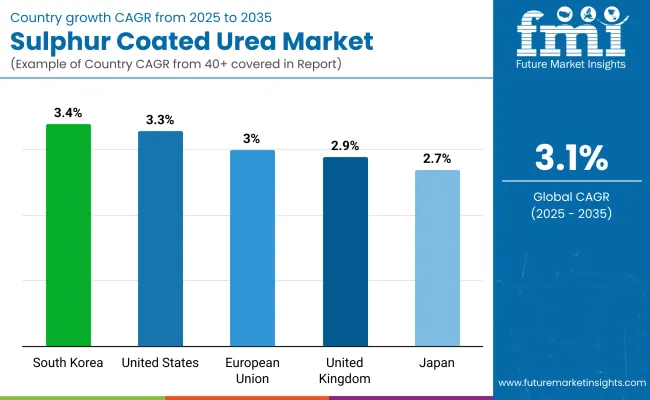
The USA sulphur coated urea market is growing at a steady pace, mainly because of the rise in demand for controlled-release fertilizers in turf management, horticulture, and row crop farming. SCU's efficiency of nutrients and lower leaching make it a major end user including golf courses, sports fields, and municipal landscapes.
In agriculture, as environmental regulations that discourage nitrogen runoff have proliferated, SCU adoption is on the rise. Manufacturers in the United States are prioritizing improvement of coating uniformity and durability, which will result in enhanced nitrogen release profiles and compatibility with precision application systems.
| Country | CAGR (2025 to 2035) |
|---|---|
| United States | 3.3% |
There will be a gradual growth in the sulphur coated urea market in the UK due to sustainable agriculture initiatives and the increasing use of sulphur coated urea in amenity landscaping. SCU is gaining ground with turf care professionals and specialty crop growers seeking more efficient nutrient management and labour efficiency.
SCU usage is being fuelled by the drive for fewer applications of fertiliser and compliance with EU-aligned nitrate directives. Importers and local distributors are offering adjusted blends for golf courses, parks and ornamental nurseries.
| Country | CAGR (2025 to 2035) |
|---|---|
| United Kingdom | 2.9% |
Germany, France and Spain lead the EU sulphur coated urea market due to regulatory pressure to reduce nutrients runoff as well as the need for high-efficiency fertilizers in the intensive and organic farming systems. The use of SCU is becoming more common in fruit orchards, vineyards, and high-value vegetable production.
Controlled-release nutrient technologies are being promoted by EU-wide environmental programs and Common Agricultural Policy (CAP) incentives. With soil and crop needs continuing to change, manufacturers are zeroing in on sulfur-rich coatings and bio-based polymer enhancements.
| Region | CAGR (2025 to 2035) |
|---|---|
| European Union | 3.0% |
Japan's sulphur coated urea demand is growing slowly due to precision farming and low availability of arable land. SCU is preferred by farmers and turf managers for its effectiveness over a longer period and less frequent applications, making it suitable for rice paddies, for tea plantations, and for urban green spaces.
Innovation in micronutrient layering and low-temperature coating technologies are being etched by Japanese agrochemical companies. The country’s sustainability goals are calling for lower-emission fertilizer alternatives, with SCU regarded as a good bridge between conventional and organic systems.
| Country | CAGR (2025 to 2035) |
|---|---|
| Japan | 2.7% |
The sulphur coated urea market in South Korea is growing steadily, underpinned by government-led efforts to modernize fertilizer use and encourage environmental stewardship in agriculture. SCU is employed in greenhouses, specialty crop production, and public landscaping to promote controlled nitrogen release and decrease over-application.
Domestic fertilizer companies are now working on high tech coating systems that are highly advantageous in extending the shelf life of nutrients while protecting the available nutrients from getting degraded in varying climatic conditions. The integration of SCU into smart farming practices is also taking shape across rural cooperatives and high-tech farms.
| Country | CAGR (2025 to 2035) |
|---|---|
| South Korea | 3.4% |
Product Type Market Share (2025)
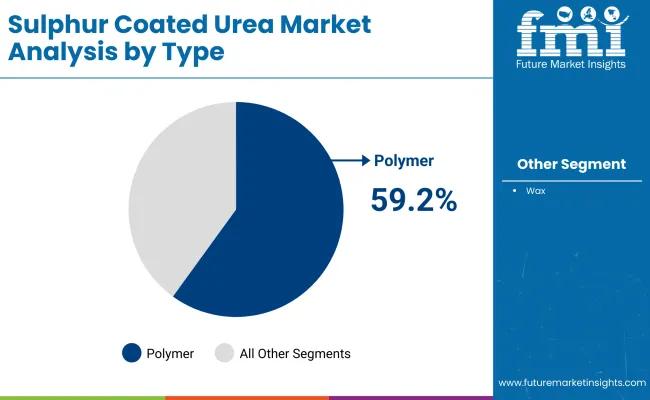
On the basis of the product type, the demand for polymer sulphur coated urea is expected to dominate the global sulphur coated urea market, with a value share of 59.2% by 2025. These coating of this type gives better control over the release of nitrogen with less leaching losses and longer stay in the soil which leads to early uptake of nutrient by the plants.
As concerns grow over environmental sustainability and fertilizer runoff, increasing use has been made of polymer-coated variants in both commercial agriculture and turf management. They have much more durability and performance than old wax coatings, which leads to increased yield and decreased application frequency.
Adoption of polymer sulphur coated urea as fertilisers include high efficiency nutrient management and lower ecological impact is likely to aid retention of leadership by this type in the global polymer sulphur coated urea market.
Application Market Share (2025)
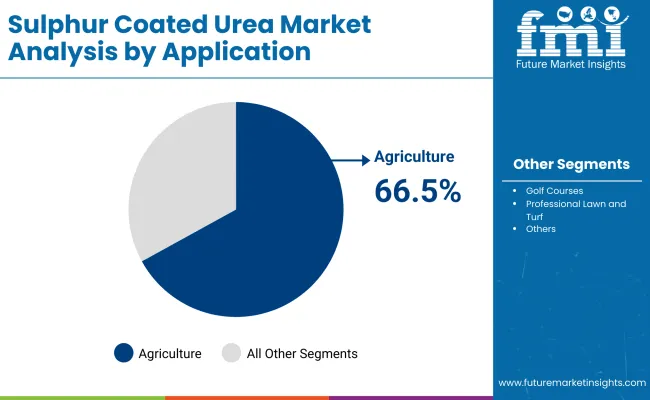
By 2025, agriculture will have represented 66.5% of the global sulphur coated urea market value. As demand for food rises and farmers feel the need to maximize crop output, slow-release fertilizers that enhance nutrient efficiency and reduce nitrogen loss are gaining ground.
Sulphur coated urea is a potent nitrogen source for crops including cereals, oilseeds and vegetables, used for distributed nitrogen application to enable better use of nitrogen from all sources throughout the growing season. Use of the fertilizers decreases the need for several fertilizer applications, making it economical in terms of labour cost as well as field productivity.
Stringent government policies encouraging sustainable nutrient management and a growing awareness about soil health also fuel this segment. Agriculture will remain the leading end user category in terms of driving demand, led by sulphur coated urea, in light of global food security and climate-resilient farming strategies.
The sulphur coated urea (SCU) market is expected to show moderate growth in the coming years. SCU, with extended fertilizer release and lower application frequency along with limited leaching, is also extensively used in agriculture, horticulture, golf courses, and turf management.
Some of the major indicators of the market are growing adoption of precision agriculture, environmental regulations on nitrogen waterway runoff and increasing demand for value-added specialty fertilizers in developed and emerging economies.
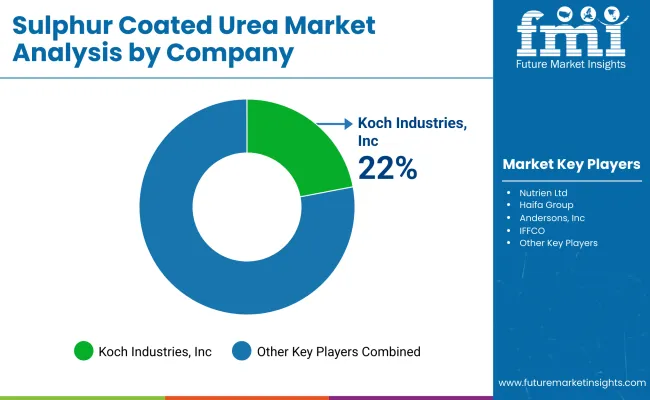
Market Share Analysis by Key Players
| Company/Organization Name | Key Offerings/Activities |
|---|---|
| Koch Industries, Inc. | In 2024 , Koch expanded its AGROTAIN® and Duration® SCU product lines , optimizing release rates for various soil types and climates, with enhanced coatings for reduced nitrogen volatilization. |
| Nutrien Ltd. | As of 2023 , Nutrien developed controlled nutrient release SCU blends tailored for high-value crops, integrating with digital agronomy platforms for precise application and sustainability tracking. |
| Haifa Group | In 2025 , Haifa launched Multicote™ SCU products for horticulture and turf, offering consistent release over 90-120 days, with growing presence in greenhouse and nursery applications. |
| Andersons, Inc. | In 2023 , Andersons released its Poly-S® coated urea series , blending sulphur and polymer coatings to balance longevity and efficiency in turf, golf, and specialty crop markets. |
| IFFCO | As of 2024 , IFFCO ramped up production of SCU in India, promoting its use in urea subsidy schemes and sustainable agricultural practices, particularly in nitrogen-deficient soils. |
Key Market Insights
Koch Industries, Inc. (22-26%)
Market leader in controlled-release nitrogen solutions, Koch offers technologically advanced SCU products with customizable release profiles and strong adoption across row crop and specialty agriculture.
Nutrien Ltd. (16-20%)
Strong in integrated fertilizer systems, Nutrien combines SCU with digital farming tools and crop advisory services, targeting commercial growers with high-efficiency input strategies.
Haifa Group (11-15%)
Specializes in high-performance SCU for horticulture, ornamental, and turf grass applications, with consistent investment in global distribution and water-efficient formulations.
Andersons, Inc. (8-11%)
A key supplier in the turf and golf course market, Andersons focuses on innovative coating technologies that enhance nutrient uptake and reduce application frequency.
IFFCO (6-9%)
Major SCU producer in India, IFFCO supports government-backed sustainable farming programs with localized SCU products aimed at reducing nitrogen waste and improving yield response.
Other Key Players (Combined Share: 20-25%)
A number of regional fertilizer manufacturers and specialty input providers contribute to product innovation, cost-effective blending, and market localization, including:
The overall market size for the sulphur coated urea market was USD 1,157.6 million in 2025.
The sulphur coated urea market is expected to reach USD 1,570.9 million in 2035.
The demand for sulphur coated urea will be driven by increasing focus on improving crop yield and fertilizer efficiency, rising awareness of controlled-release fertilizers, growing global agricultural production, and regulatory support for reducing nitrogen runoff and environmental pollution.
The top 5 countries driving the development of the sulphur coated urea market are the USA, China, India, Brazil, and Canada.
The polymer sulphur coated urea segment is expected to command a significant share over the assessment period.
Table 01: Global Volume (KiloTons) and Value (US$ Million) Forecast by Product Type 2015 to 2032
Table 02: Global Volume (KiloTons) and Value (US$ Million) Forecast by Application, 2015 to 2032
Table 03: Global Market Size (US$ Million) and Volume (KiloTons) Forecast by Region, 2015 to 2032
Table 04: North America Market Size (US$ Million) and Volume (KiloTons) Forecast by Country, 2015 to 2032
Table 05: North America Volume (KiloTons) and Value (US$ Million) Forecast by Product Type 2015 to 2032
Table 06: North America Volume (KiloTons) and Value (US$ Million) Forecast by Application, 2015 to 2032
Table 07: Latin America Market Size (US$ Million) and Volume (KiloTons) Forecast by Country, 2015 to 2032
Table 08: Latin America Volume (KiloTons) and Value (US$ Million) Forecast by Product Type 2015 to 2032
Table 09: Latin America Volume (KiloTons) and Value (US$ Million) Forecast by Application, 2015 to 2032
Table 10: Europe Market Size Value (US$ Million) Forecast by Country, 2015 to 2032
Table 11: Europe Volume (KiloTons) and Value (US$ Million) Forecast by Product Type 2015 to 2032
Table 12: Europe Volume (KiloTons) and Value (US$ Million) Forecast by Application, 2015 to 2032
Table 13: East Asia Market Size (US$ Million) and Volume (KiloTons) Forecast by Country, 2015 to 2032
Table 14: East Asia Volume (KiloTons) and Value (US$ Million) Forecast by Product Type 2015 to 2032
Table 15: East Asia Volume (KiloTons) and Value (US$ Million) Forecast by Application, 2015 to 2032
Table 16: South Asia Pacific Market Size (US$ Million) and Volume (KiloTons) Forecast by Country, 2015 to 2032
Table 17: SAP Volume (KiloTons) and Value (US$ Million) Forecast by Product Type 2015 to 2032
Table 18: South Asia & Pacific Volume (KiloTons) and Value (US$ Million) Forecast by Application, 2015 to 2032
Table 19: MEA Market Size (US$ Million) and Volume (KiloTons) Forecast by Country, 2015 to 2032
Table 20: MEA Volume (KiloTons) and Value (US$ Million) Forecast by Product Type 2015 to 2032
Table 21: MEA Volume (KiloTons) and Value (US$ Million) Forecast by Application, 2015 to 2032
Figure 01: Global Historical Market Volume (Kilo Tons) Analysis, 2015 to 2021
Figure 02: Global Current and Future Market Volume (KiloTons) Analysis, 2022 to 2032
Figure 03: Global Historical Value (US$ Million), 2015 to 2021
Figure 04: Global Value (US$ Million) Forecast, 2022 – 2032
Figure 05: Global Market Absolute $ Opportunity, 2015 to 2021 and 2032
Figure 06: Global Market Share and BPS Analysis by Product Type 2022 to 2032
Figure 07: Global Market Y-o-Y Growth by Product Type 2022 to 2032
Figure 08: Global Market Attractiveness Analysis By Product Type, 2022 to 2032
Figure 09: Global Market Absolute $ Opportunity by Wax Segment, 2015 to 2032
Figure 10: Global Market Absolute $ Opportunity by Polymer Segment, 2015 to 2032
Figure 11: Global Market Share and BPS Analysis by Application, 2022 to 2032
Figure 12: Global Market Y-o-Y Growth by Application, 2022 to 2032
Figure 13: Global Market Attractiveness Analysis Application, 2022 to 2032
Figure 14: Global Market Absolute $ Opportunity by Agriculture Segment, 2015 to 2032
Figure 15: Global Market Absolute $ Opportunity by Golf Courses Segment, 2015 to 2032
Figure 16: Global Market Absolute $ Opportunity by Professional Lawn and Turf Segment, 2015 to 2032
Figure 17: Global Market Absolute $ Opportunity by Other Segment, 2015 to 2032
Figure 18: Global Market Share and BPS Analysis by Region, 2022 to 2032
Figure 19: Global Market Y-o-Y Growth by Region, 2022 to 2032
Figure 20: Global Market Attractiveness Analysis Region, 2022 to 2032
Figure 21: Global Market Absolute $ Opportunity by North America Segment, 2015 to 2032
Figure 22: Global Market Absolute $ Opportunity by Latin America Segment, 2015 to 2032
Figure 23: Global Market Absolute $ Opportunity by Europe Segment, 2015 to 2032
Figure 24: Global Market Absolute $ Opportunity by East Asia Segment, 2015 to 2032
Figure 25: Global Market Absolute $ Opportunity by South Asia Pacific Segment, 2015 to 2032
Figure 26: Global Market Absolute $ Opportunity by MEA Segment, 2015 to 2032
Figure 27: North America Market Share and BPS Analysis by Country, 2022 to 2032
Figure 28: North America Market Y-o-Y Growth by Country, 2022 to 2032
Figure 29: North America Market Attractiveness Analysis Country, 2022 to 2032
Figure 30: North America Market Share and BPS Analysis by Product Type 2022 to 2032
Figure 31: North America Market Y-o-Y Growth by Product Type 2022 to 2032
Figure 32: North America Market Attractiveness Analysis Product Type, 2022 to 2032
Figure 33: North America Market Share and BPS Analysis by Application, 2022 to 2032
Figure 34: North America Market Y-o-Y Growth by Application, 2022 to 2032
Figure 35: North America Market Attractiveness Analysis Application, 2022 to 2032
Figure 36: Latin America Market Share and BPS Analysis by Country, 2022 to 2032
Figure 37: Latin America Market Y-o-Y Growth by Country, 2022 to 2032
Figure 38: Latin America Market Attractiveness Analysis Country, 2022 to 2032
Figure 39: Latin America Market Share and BPS Analysis by Product Type 2022 to 2032
Figure 40: Latin America Market Y-o-Y Growth by Product Type 2022 to 2032
Figure 41: Latin America Market Attractiveness Analysis Product Type, 2022 to 2032
Figure 42: Latin America Market Share and BPS Analysis by Application, 2022 to 2032
Figure 43: Latin America Market Y-o-Y Growth by Application, 2022 to 2032
Figure 44: Latin America Market Attractiveness Analysis Application, 2022 to 2032
Figure 45: Europe Market Share and BPS Analysis by Country, 2022 to 2032
Figure 46: Europe Market Y-o-Y Growth by Country, 2022 to 2032
Figure 47: Europe Market Attractiveness Analysis Country, 2022 to 2032
Figure 48: Europe Market Share and BPS Analysis by Product Type 2022 to 2032
Figure 49: Europe Market Y-o-Y Growth by Product Type 2022 to 2032
Figure 50: Europe Market Attractiveness Analysis Product Type, 2022 to 2032
Figure 51: Europe Market Share and BPS Analysis by Application, 2022 to 2032
Figure 52: Europe Market Y-o-Y Growth by Application, 2022 to 2032
Figure 53: Europe Market Attractiveness Analysis Application, 2022 to 2032
Figure 54: East Asia Market Share and BPS Analysis by Country, 2022 to 2032
Figure 55: East Asia Market Y-o-Y Growth by Country, 2022 to 2032
Figure 56: East Asia Market Attractiveness Analysis Country, 2022 to 2032
Figure 57: East Asia Market Share and BPS Analysis by Product Type 2022 to 2032
Figure 58: East Asia Market Y-o-Y Growth by Product Type 2022 to 2032
Figure 59: East Asia Market Attractiveness Analysis Product Type, 2022 to 2032
Figure 60: East Asia Market Share and BPS Analysis by Application, 2022 to 2032
Figure 61: East Asia Market Y-o-Y Growth by Application, 2022 to 2032
Figure 62: East Asia Market Attractiveness Analysis Application, 2022 to 2032
Figure 63: South Asia Pacific Market Share and BPS Analysis by Country, 2022 to 2032
Figure 64: South Asia Pacific Market Y-o-Y Growth by Country, 2022 to 2032
Figure 65: South Asia Pacific Market Attractiveness Analysis Country, 2022 to 2032
Figure 66: South Asia & Pacific Market Share and BPS Analysis by Product Type 2022 to 2032
Figure 66: South Asia & Pacific Market Y-o-Y Growth by Product Type 2022 to 2032
Figure 67: South Asia & Pacific Market Attractiveness Analysis Product Type, 2022 to 2032
Figure 68: South Asia & Pacific Market Share and BPS Analysis by Application, 2022 to 2032
Figure 69: South Asia & Pacific Market Y-o-Y Growth by Application, 2022 to 2032
Figure 70: South Asia & Pacific Market Attractiveness Analysis Application, 2022 to 2032
Figure 71: MEA Market Share and BPS Analysis by Country, 2022 to 2032
Figure 72: MEA Market Y-o-Y Growth by Country, 2022 to 2032
Figure 73: MEA Market Attractiveness Analysis Country, 2022 to 2032
Figure 74: MEA Market Share and BPS Analysis by Product Type 2022 to 2032
Figure 75: MEA Market Y-o-Y Growth by Product Type 2022 to 2032
Figure 76: MEA Market Attractiveness Analysis Product Type, 2022 to 2032
Figure 77: MEA Market Share and BPS Analysis by Application, 2022 to 2032
Figure 78: MEA Market Y-o-Y Growth by Application, 2022 to 2032
Figure 79: MEA Market Attractiveness Analysis Application, 2022 to 2032


Our Research Products

The "Full Research Suite" delivers actionable market intel, deep dives on markets or technologies, so clients act faster, cut risk, and unlock growth.

The Leaderboard benchmarks and ranks top vendors, classifying them as Established Leaders, Leading Challengers, or Disruptors & Challengers.

Locates where complements amplify value and substitutes erode it, forecasting net impact by horizon

We deliver granular, decision-grade intel: market sizing, 5-year forecasts, pricing, adoption, usage, revenue, and operational KPIs—plus competitor tracking, regulation, and value chains—across 60 countries broadly.

Spot the shifts before they hit your P&L. We track inflection points, adoption curves, pricing moves, and ecosystem plays to show where demand is heading, why it is changing, and what to do next across high-growth markets and disruptive tech

Real-time reads of user behavior. We track shifting priorities, perceptions of today’s and next-gen services, and provider experience, then pace how fast tech moves from trial to adoption, blending buyer, consumer, and channel inputs with social signals (#WhySwitch, #UX).

Partner with our analyst team to build a custom report designed around your business priorities. From analysing market trends to assessing competitors or crafting bespoke datasets, we tailor insights to your needs.
Supplier Intelligence
Discovery & Profiling
Capacity & Footprint
Performance & Risk
Compliance & Governance
Commercial Readiness
Who Supplies Whom
Scorecards & Shortlists
Playbooks & Docs
Category Intelligence
Definition & Scope
Demand & Use Cases
Cost Drivers
Market Structure
Supply Chain Map
Trade & Policy
Operating Norms
Deliverables
Buyer Intelligence
Account Basics
Spend & Scope
Procurement Model
Vendor Requirements
Terms & Policies
Entry Strategy
Pain Points & Triggers
Outputs
Pricing Analysis
Benchmarks
Trends
Should-Cost
Indexation
Landed Cost
Commercial Terms
Deliverables
Brand Analysis
Positioning & Value Prop
Share & Presence
Customer Evidence
Go-to-Market
Digital & Reputation
Compliance & Trust
KPIs & Gaps
Outputs
Full Research Suite comprises of:
Market outlook & trends analysis
Interviews & case studies
Strategic recommendations
Vendor profiles & capabilities analysis
5-year forecasts
8 regions and 60+ country-level data splits
Market segment data splits
12 months of continuous data updates
DELIVERED AS:
PDF EXCEL ONLINE
Coated Label Market Size and Share Forecast Outlook 2025 to 2035
Coated Fabrics Market Size and Share Forecast Outlook 2025 to 2035
Sulphur Bentonite Market Size and Share Forecast Outlook 2025 to 2035
Urea Strippers Market Size and Share Forecast Outlook 2025 to 2035
Urea Formaldehyde Market Size and Share Forecast Outlook 2025 to 2035
coated-paper-packaging-box-market-market-value-analysis
Coated Recycled Boxboard Market Size and Share Forecast Outlook 2025 to 2035
Coated Recycled Paperboard Market Size and Share Forecast Outlook 2025 to 2035
Coated Casing Market Size and Share Forecast Outlook 2025 to 2035
Sulphur Recovery Technology Market Analysis - Size, Share, and Forecast Outlook 2025 to 2035
Sulphur Hexafluoride Market Growth 2025 to 2035
Coated Fabrics for Defense Market 2025 to 2035
Market Share Breakdown of Coated Recycled Boxboard Manufacturers
Competitive Landscape of Coated Recycled Paperboard Providers
Coated White Board Paper Market
Coated Sack Kraft Paper Market
Coated Duplex Board Market
Sulphur Chemicals Market
Uncoated Fine Papers Market Size and Share Forecast Outlook 2025 to 2035
Uncoated White Top Testliner Market Size and Share Forecast Outlook 2025 to 2035

Thank you!
You will receive an email from our Business Development Manager. Please be sure to check your SPAM/JUNK folder too.
Chat With
MaRIA