Solid Sulphur Market Size and Share Forecast Outlook From 2025 to 2035
The solid sulphur market is expanding steadily, supported by increasing demand across fertilizer, chemical, and industrial applications. Rising global agricultural productivity requirements have elevated the consumption of sulphur-based fertilizers, making solid sulphur a vital commodity in the agrochemical supply chain.
The market benefits from stable crude oil and gas refining outputs, as sulphur is a key byproduct of desulphurization processes. Ongoing investments in refinery capacity and sulfur recovery units have ensured consistent supply.
The product’s solid form offers logistical advantages, including safer handling, easier storage, and reduced transport costs compared to liquid forms. With growing emphasis on sustainable soil management and industrial chemical synthesis, the outlook for solid sulphur remains positive, driven by both agricultural expansion and industrial diversification.
Quick Stats for Solid Sulphur Market
- Solid Sulphur Market Industry Value (2025): USD 3.9 billion
- Solid Sulphur Market Forecast Value (2035): USD 5.7 billion
- Solid Sulphur Market Forecast CAGR: 3.7%
- Leading Segment in Solid Sulphur Market in 2025: Frasch Process (68.4%)
- Key Growth Region in Solid Sulphur Market: North America, Asia-Pacific, Europe
- Top Key Players in Solid Sulphur Market: Saudi Aramco, Abu Dhabi National Oil Company (ADNOC), Gazprom, Chemtrade, Oxbow Corporation, Valero Energy Corporation, Exxon Mobil Corporation, Marathon Petroleum Corporation, Tengizchevroil LLP, PVS Chemicals, Inc.
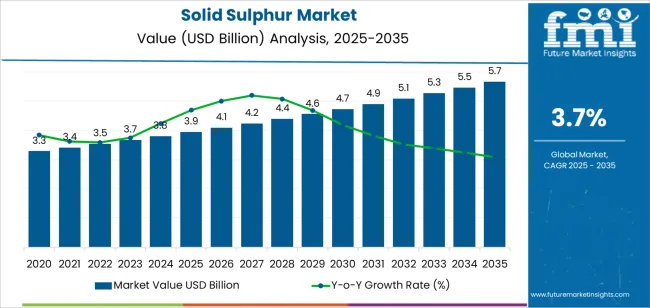
| Metric |
Value |
| Solid Sulphur Market Estimated Value in (2025 E) |
USD 3.9 billion |
| Solid Sulphur Market Forecast Value in (2035 F) |
USD 5.7 billion |
| Forecast CAGR (2025 to 2035) |
3.7% |
Segmental Analysis
The market is segmented by Manufacturing Process and Application and region. By Manufacturing Process, the market is divided into Frasch Process and Claus Process. In terms of Application, the market is classified into Fertilizer, Chemical Processing, Metal Processing, Rubber Processing, and Others. Regionally, the market is classified into North America, Latin America, Western Europe, Eastern Europe, Balkan & Baltic Countries, Russia & Belarus, Central Asia, East Asia, South Asia & Pacific, and the Middle East & Africa.
Insights into the Frasch Process Segment
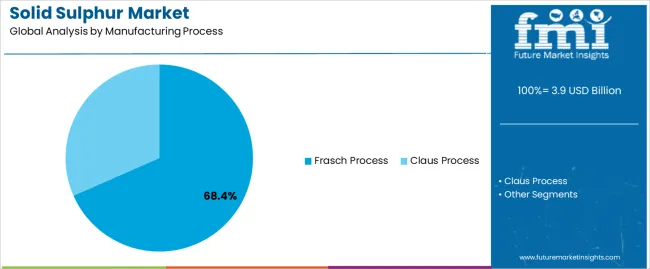
The Frasch process segment dominates the manufacturing process category with approximately 68.4% share, due to its efficiency in extracting high-purity elemental sulphur from underground deposits. This method’s ability to produce large volumes of solid sulphur with minimal environmental contamination has ensured its continued industrial preference.
The segment benefits from technological improvements that enhance recovery rates and reduce operational costs. Regions with extensive sulphur reserves, such as North America and the Middle East, have heavily relied on this process for consistent supply.
With rising fertilizer production and industrial demand, the Frasch process remains the cornerstone of global sulphur extraction, supporting stable market growth in the long term.
Insights into the Fertilizer Segment
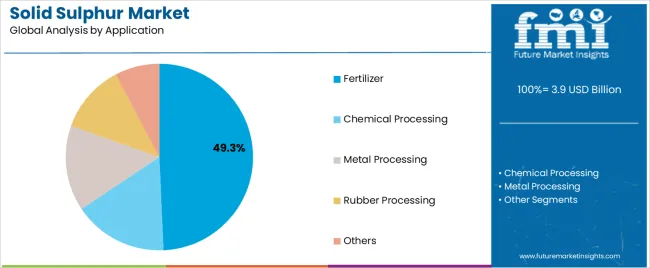
The fertilizer segment holds approximately 49.3% share of the application category, reflecting its status as the dominant end-use sector. Solid sulphur is extensively utilized in the production of sulphuric acid and subsequent fertilizer formulations such as ammonium sulphate and superphosphates.
The segment’s growth is fueled by increasing agricultural productivity requirements and nutrient management programs aimed at improving soil health. Emerging markets in Asia-Pacific and Africa have driven demand for sulphur-enriched fertilizers due to rising crop cultivation.
The segment also benefits from government initiatives promoting balanced fertilizer usage. With the global population rising and food security remaining a priority, the fertilizer segment is expected to maintain its leading share in the forecast period.
Top Insights Shaping the Global Solid Sulphur Industry
The growth of the agriculture sector is expected to drive the growth of the market in the coming years.
- The use of fertilizers is essential for enhancing crop yield and maintaining soil fertility.
- Sulphur is a key component of several types of fertilizers, including single superphosphate, triple superphosphate, and ammonium sulphate.
- The demand for these fertilizers has been increasing due to the need for high-quality crops and the growing population.
Demand for solid sulphur in the chemical industry is evident.
- Sulphuric acid, which is produced from sulphur, is a vital component in the production of several chemicals, including detergents, fertilizers, and pharmaceuticals.
- The growth of these industries is driving the demand for sulphuric acid, which, in turn, is driving the demand for solid sulphur.
Rising demand for sulphur in the oil and gas industry is also driving the growth of the solid sulphur market.
- Sulphur is used in the refining process to remove impurities from crude oil and natural gas.
- The demand for refined petroleum products is increasing due to the growing population and the increasing need for energy.
The transportation of solid sulphur has become more accessible, and new markets have opened up for the export of solid sulphur.
- The availability of transportation infrastructure has made it easier to transport solid sulphur.
The demand for solid sulphur has increased in several regions of the world, including Asia Pacific, Europe, and North America.
Emerging Opportunities in the Solid Sulphur Market
- Focus on the development of innovative technologies for the extraction and processing of sulphur is likely to enable industries to enhance efficiency and reduce environmental impact. This is anticipated to allow manufacturers to produce high-quality products that meet the needs of their customers while reducing costs and increasing efficiency.
- Exploring new applications for sulphur-based products is expected to create significant opportunities during the forecast period. For example, sulphur can be used in the production of pharmaceuticals, pesticides, and even batteries. By expanding their product offerings and exploring new applications, manufacturers can tap into new markets and increase their revenue streams.
- Focusing on sustainability and environmental responsibility by implementing eco-friendly practices in their production processes is likely to help manufacturers reduce their carbon footprint and appeal to consumers who are increasingly concerned about the environmental impact of the products they purchase.
- The increasing demand for sulphur-based products in multiple industries, including the chemical and fertilizer industries, is evident. In addition, the growing demand for sulphur in the production of sulphuric acid is another key factor driving the growth of this market.
Factors Restraining the Demand for Solid Sulphur
- There is increasing competition from substitutes such as liquid sulphur and sulphuric acid. These substitutes are becoming increasingly popular due to their ease of handling and transportation, making it difficult for solid sulphur manufacturers to maintain their market share.
- The volatility in the prices of raw materials also presents a significant challenge. The prices of raw materials such as natural gas and crude oil have a significant impact on the production cost of solid sulphur. This volatility in the prices of raw materials makes it difficult for manufacturers to maintain a stable profit margin.
- The transportation and logistics costs associated with the solid sulphur market are also major challenges. Solid sulphur is a heavy and bulky material, making it difficult to transport over long distances. This results in higher transportation costs, which further add to the production cost of solid sulphur.
Solid Sulphur Industry Analysis by Top Investment Segments
The Frasch Process Segment Dominates the Market by Manufacturing Process
| Attributes |
Details |
| Manufacturing Process |
Frasch process |
| Forecasted CAGR from 2025 to 2035 |
3.5% |
- Frasch process’ cost-effectiveness and efficiency make it appealing to end users.
- Frasch process melts sulphur underground with superheated water, making it easily transportable and preferable to less efficient methods like mining and gas processing recovery.
- The Frasch process yields high-purity sulphur, which is in high demand for industrial applications such as fertilizers, chemicals, and pharmaceuticals.
The Fertilizer Segment Dominates the Market by Application
| Attributes |
Details |
| Application |
Fertilizer |
| Forecasted CAGR from 2025 to 2035 |
3.3% |
- Demand for sulphur-containing fertilizers, such as ammonium sulphate, single superphosphate, and triple superphosphate, is skyrocketing. Sulphur is an essential nutrient for plant growth and is used in large quantities in agriculture.
- Solid sulphur is an important raw material for manufacturing these fertilizers. The use of solid sulphur as a soil conditioner to improve soil fertility and lower the pH of alkaline soil is also contributing to the growth of the fertilizer segment in the solid sulphur market.
Analysis of Top Countries, Producing and Exporting Solid Sulphur
| Countries |
Forecasted CAGR through 2025 to 2035 |
| United States |
3.9% |
| United Kingdom |
5.0% |
| China |
4.4% |
| Japan |
5.1% |
| South Korea |
5.4% |
Surge in Oil and Gas Production in the United States Fuels Market Growth
- The growing demand for sulphur-based fertilizers in agriculture in the United States is driven by the essential role sulphur plays in plant growth and development. It aids in the formation of proteins and chlorophyll, which are vital for plant growth.
- The increase in oil and gas production in the United States has led to a surge in sulphur availability, a byproduct of oil and gas processing. Sulphur is utilized in the production of various chemicals, such as sulphuric acid, essential for manufacturing fertilizers, detergents, and other industrial products. This increased availability has further fueled the solid sulphur market expansion.
- The increasing use of sulphur in food production in the United States is notable. Sulphur dioxide, a sulphur derivative, serves as a preservative in food products like dried fruits, wine, and beer.
- The rising demand for natural preservatives, driven by growing health awareness regarding the harmful effects of artificial preservatives, has boosted the demand for sulphur dioxide as a safer alternative in the market.
Increasing Use of Solid Sulphur in the Chemical Industry in the United Kingdom
- The expansion of the fertilizer industry in the United Kingdom is apparent. Sulphur is a critical nutrient for plant growth and a key ingredient in the production of many fertilizers. Consequently, the demand for solid sulphur in the agricultural sector is high, particularly in countries where the soil is deficient in sulphur.
- There is an increasing use of solid sulphur in the chemical industry in the United Kingdom. Sulphur is a critical raw material used in the production of a wide range of chemical products, including sulphuric acid, sulphites, and detergents. The growth of the chemical industry in the United Kingdom has led to an increase in demand for solid sulphur in recent years.
- The oil and gas industry is another key driver of the solid sulphur market in the United Kingdom. The United Kingdom is a net importer of crude oil and gas, leading to increased demand for solid sulphur due to the country's dependence on these industries.
Rising Focus on Agricultural Development in China Sparks Sulphur’s Demand
- China's industrial sector has been expanding at a rapid pace, leading to an increased demand for solid sulphur. Sulphur is a key component in the production of various industrial chemicals, including fertilizers, detergents, and rubber. As China's industrial sector continues to grow, the demand for these chemicals is also expected to increase, driving the growth of the solid sulphur market.
- Solid sulphur is also a critical component in China’s agriculture industry. With China's focus on agricultural development, the demand for solid sulphur in the country has also increased.
- There is a growing emphasis on clean energy sources in China. Solid sulphur is a key component in the production of sulphuric acid, which is used in the manufacturing of batteries for electric vehicles. As China continues to promote the use of electric vehicles, the demand for solid sulphur is expected to increase.
Increasing Production of Fertilizers in the Japan Rises Adoption of Solid Sulphur
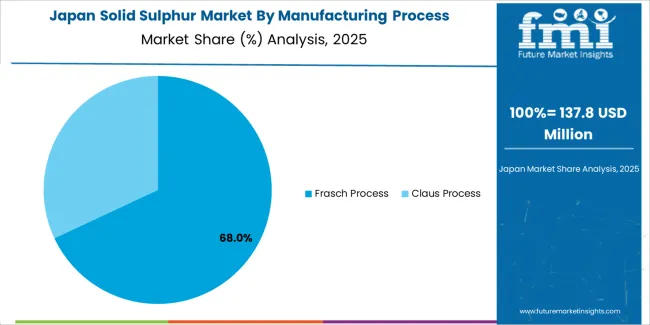
- The country's heavy reliance on sulphur as a key component in fertilizer production is notable. Japan ranks among the world's largest importers of fertilizers, and sulphur is a critical ingredient in the production of many types of fertilizers.
- Solid sulphur is also utilized in various industrial processes such as paper production, detergent manufacturing, and chemical production. The growth of these industries in Japan has further contributed to the increase in demand for solid sulphur in the country.
- The growth of Japan's construction industry is noteworthy. Sulphur is used in asphalt production, which is widely employed in road construction. With Japan's focus on improving its infrastructure, the demand for solid sulphur is expected to continue rising.
Expansion of the Petrochemical Industry in South Korea Sparks Market Expansion
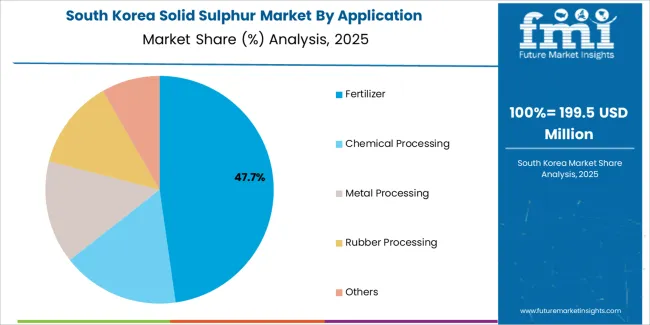
- South Korea is one of the world's leading exporters of fertilizers, and solid sulphur is a key ingredient in fertilizer production. The rising demand for food and agricultural products has led to increased demand for fertilizers, thereby driving the solid sulphur market progression.
- The growing demand for petrochemicals has resulted in a surge in demand for solid sulphur. South Korea's petrochemical industry is booming, and solid sulphur is a critical component in the production of various petrochemical products.
- The government has implemented various policies to promote the use of renewable energy sources like solar power. Solid sulphur is used in the production of solar panels, and the increasing demand for renewable energy has led to an increase in solid sulphur demand.
Key Players and Market Concentration in the Solid Sulphur Industry
The market is quite diverse and constantly evolving. There are numerous players in the market, ranging from large multinational corporations to small local companies. Leading companies offer a wide range of solid sulphur products, including countertops, sinks, and wall panels, among others.
In addition to these established players, there are also several new entrants in the market who are trying to gain a foothold in this highly competitive industry. Overall, the solid sulphur market is highly competitive, and companies need to constantly innovate and differentiate themselves to succeed.
Recent Developments
- In December 2025, LANXESS, a specialty chemicals company, successfully increased its production capacity for sustainable light-color sulphur carriers by several kilotons. The project, involving a double-digit million-dollar investment, was completed at the Mannheim site within the planned two-year timeframe.
- In April 2024, ADNOC (Abu Dhabi) invested in boosting its oil production capacity from 3 to 3.8 million barrels per day by April 2024. This expansion is also going to lead to a rise in sulphur production from oil refineries, catering to the increasing demand for sulphur in the Middle East & Africa, APAC, and Europe.
Leading Suppliers of Solid Sulphur
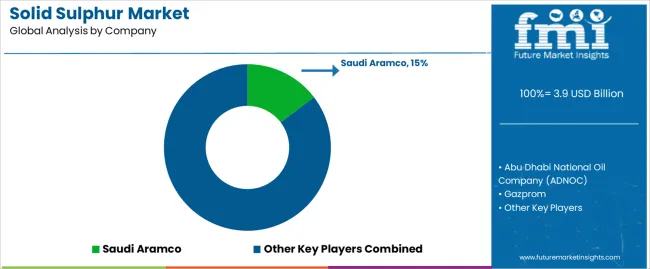
- The Saudi Arabian Oil Company (Saudi Aramco)
- Abu Dhabi National Oil Company (ADNOC)
- Gazprom
- Chemtrade
- Oxbow Corporation
- Valero Energy Corporation
- Exxon Mobil Corporation
- Marathon Petroleum Corporation
- Tengizchevroil LLP
- PVS Chemicals, Inc.
Top Segments Studied in the Solid Sulphur Market
By Manufacturing Process:
- Frasch Process
- Claus Process
By Application:
- Fertilizer
- Chemical processing
- Metal processing
- Rubber Processing
- Others
By Region:
- North America
- Latin America
- East Asia
- South Asia
- Europe
- Oceania
- MEA
Frequently Asked Questions
How big is the solid sulphur market in 2025?
The global solid sulphur market is estimated to be valued at USD 3.9 billion in 2025.
What will be the size of solid sulphur market in 2035?
The market size for the solid sulphur market is projected to reach USD 5.7 billion by 2035.
How much will be the solid sulphur market growth between 2025 and 2035?
The solid sulphur market is expected to grow at a 3.7% CAGR between 2025 and 2035.
What are the key product types in the solid sulphur market?
The key product types in solid sulphur market are frasch process and claus process.
Which application segment to contribute significant share in the solid sulphur market in 2025?
In terms of application, fertilizer segment to command 49.3% share in the solid sulphur market in 2025.


