Solid State Drive (SSD) Market Size and Share Forecast Outlook (2022 to 2032)

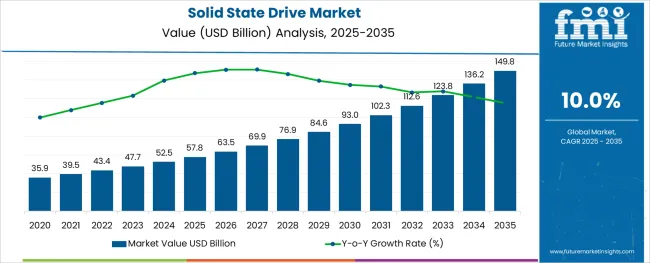
The global demand for the solid-state drive market is expected to rise at a healthy CAGR of 10% per year to USD 43.4 billion in 2022, supported by the following:

  • Increasing awareness of the positive aspects of SSDs, such as reduced latency and low failure rates, to offset the advantage that hard drives hold over SSDs in terms of cost.
  • There is a growing trend among solid-state drive manufacturers to increase the number of solid-state drives with different interfaces, such as SATA drive (serial advanced technology attachment), SAS drive (serial-attached SCSI drive), and PCI-E drive (PCI-E solid-state drive).
  • Technology is developing at a rapid pace, largely driven by the pace of digitization of business processes around the world, which has increased the pace of technological advancements.
Attributes Details
Global Solid State Drive Market Size (2022) USD 43.4 Billion
Global Solid State Drive Market Size (2032) USD 113 Billion
Global Solid State Drive Market CAGR (2022 to 2032) 10%
USA Solid State Drive Market Size (2032) USD 39.2 Billion
Key Companies Covered Intel Corporation; Samsung Group; Micron Technology, Inc.; Toshiba Corporation; Western Digital Corporation, Inc.; ADATA Technology Co. Ltd; Transcend Information Inc.; Kingston Technology Corporation; SK Hynix Inc.; Teclast Electronics Co., Limited?

Next-Gen Architecture and Cost Reduction Driving SSD Adoption

It is expected that solid-state enterprise storage will become less expensive in the coming years. Even though SSDs are a dollar more expensive per gigabyte than HDDs, businesses tend to switch to SSDs when they see quick profits. As technology advances from SLC (single-level cell) to MLC (multi-level cell) to TLC (3 bits per cell), this development is attributed to improvements in scaling and the transition from the 2D to the 3D era.

It is currently possible to add multiple layers to the cell structure to make it more cost-effective. The emergence of new device categories and architectures, including the emergence of computational storage in Ethernet SSDs, is expected to eliminate system bottlenecks. To improve the performance of applications and improve the efficiency of the infrastructure, computational storage would reduce data movement and offload post-processing, for example.

QLC-based SSDs are suited for read-intensive workloads, resulting in a reduction of the total number of P/E cycles for read-intensive workloads. In addition to real-time analytics, machine and deep learning, artificial intelligence, streaming media, delivering content, and backing up data, QLC technology is suitable for a variety of workloads.

Aside from the cloud, CDNs, all-flash arrays, and other tiered solutions are also found in many applications. Many end-market applications will experience data growth as a result of trends such as cloud, artificial intelligence, 5G, and IoT. These trends will extend to public and private cloud environments, traditional IT environments, the edge, and endpoints.

Comparison of SSD Sales Outlook from 2017 to 2021 vs Forecast to 2032

As per the SSD Market research by Future Market Insights - a market research and competitive intelligence provider, historically, from 2017 to 2021, the market value of the SSD Market increased at around 10% CAGR.

The growth of cloud computing services for personal use by organizations and individuals to store their data will boost the growing need for SSDs in the years ahead.

Smart Devices Fueling SSD Demand in the Asia Pacific Market

During the past few years, the Asia Pacific solid state drive market has held the top share of the global market. One of the key drivers of the regional market's growth is its large consumer base. As mobile devices such as smart gadgets become more popular, the demand for advanced storage devices has increased, spurring the Asia Pacific solid state drive market's revenue growth.

There is also a large manufacturing base in the Asia Pacific solid state drive market, which has propelled the market. Both large and small drive manufacturers are eager to unveil technologically advanced storage & memory devices. As a result, several of them are developing new techniques for enhancing SSD read and write performance substantially.

Recent Developments in the Global SSD Market

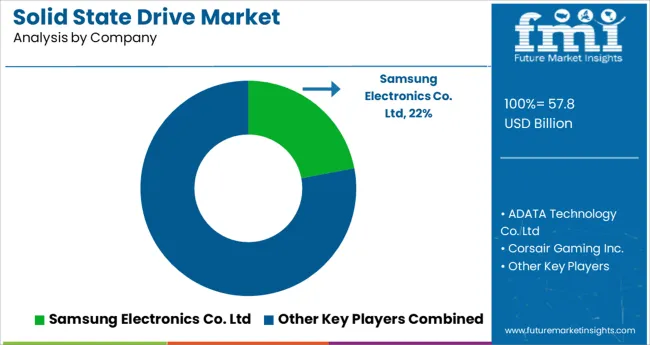
The solid-state drive (SSD) market is dominated by several major vendors, such as Intel, Micron Technology, Samsung Electronics, and Western Digital Corporation. Since the entry barriers to the SSD market are high, it is difficult for new players to enter the market. It is widely accepted that the existing vendors in the market are investing heavily in the research and development of new and innovative products.

Some of the recent developments in the market are:

  • SK Hynix Inc. announced on January 4, 2022, that it had completed the first phase of the purchase of Intel's NAND and solid-state drive (SSD) businesses. It is likely that the newly established USA subsidiary, which would oversee the newly acquired SSD business, will be referred to as Solididigm.
  • On the 17th of August 2021, SK Hynix launched the 2TB 'Gold P31' Ultra-low-power solid-state drive, which is intended to cater to users seeking high-capacity storage, such as gamers and content creators.

Key Drivers Fueling Demand for SSD

The increased usage of social media, expanding online commerce, and growth in media content will all play a significant part in boosting the SSD market throughout the projected period. Due to the high usage of tablets and smartphones, which have enabled customers to produce massive amounts of digital data, the average household's storage consumption is likely to expand in the future years. As a result, there is an increasing demand for sufficient storage.

It is also observed that SSD usage in data centers has been increasing due to a variety of factors, including improved efficacy in contrast to conventional HDD storage, rising need for storage facilities, and breakthroughs in enterprise-level SSD reliability and performance. SSDs are preferred by businesses since they require less energy, which further enables less dispersion, resulting in a reduced environmental imprint.

Additionally, SSDs are capturing the attention of people all over the world due to their benefits such as rapid read-write efficiency, minimal noise, lower power consumption, and mobility, among others. It has the potential to provide a quicker, more energy-efficient, highly secure, and reliable data storage experience. Furthermore, with the increase in game loading speed, the demand for responsive and multi-task processing storage has also surged.?

Solid state drives are also gaining traction in the automotive industry for next-generation connected automobiles and multimedia passenger vehicles, which is fuelling SSD market development. They are utilized in connected automotive applications to address the demand for high-definition graphics, data storage, and networking.

Flash memory-based solid-state drives offer solutions that help to supply high-performance storage and dependability in a variety of in-vehicle applications such as driver-assist technologies, entertainment systems, navigation systems, and 3D mapping.

Regional Analysis of the SSD Market

Which Region is Projected to Offer the Largest Opportunity for the SSD Market?

During the projected period, the market in North America is expected to continue being the largest market for Solid State Drive with a projected value of over USD 40 Billion by 2032. The large IT corporations in the region require significant data storage solutions at an uncompromised speed. While most of the documentation, as well as records, have started to go on the cloud, the need for solid-state drives is expected to surge in the region.
Country-wise Insights in the SSD Market

Which Country Lies at the CenterStage for SSD Market Revenue?

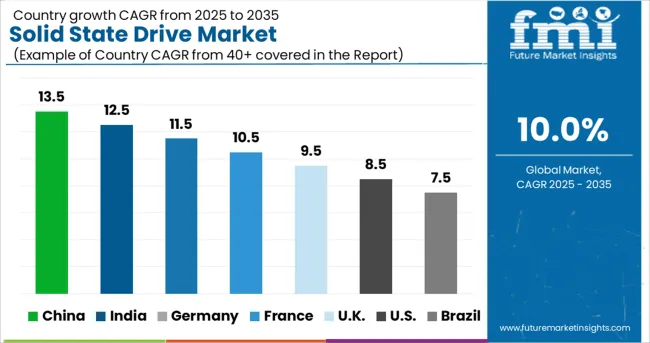
China is expected to account for the highest Solid State Drive (SSD) Market Share. The market in the country is projected to reach a valuation of USD 794.2 Million by the end of 2032 with an expected CAGR of 35.8% by the end of 2032.

The key element driving market expansion includes the decline in the price of SSDs and the general degradation of the price of data storage. Besides, several global memory manufacturers are spending massive sums, which are bolstered by government initiatives such as Made in China 2025.

The Chinese data center industry is predicted to increase due to the supporting government measures and foreign investments. The government's quest for AI in intelligence and security applications is expected to boost the market for SSDs in the region. China is both a massive IoT market and a key provider of component technology.

According to Axa Insurance, by 2020, there will be 200 Billion IoT-connected modules and gadgets in the world, with China producing 95% of them. As a result of the increased volume of Big Data generated by IoT gadgets and corporate applications, the need for faster storage has risen to the top of the priority list.

Category-wise Insights in the SSD Market

Which Application Type of SSD is Expected to Score Highest Growth in the Coming Years?

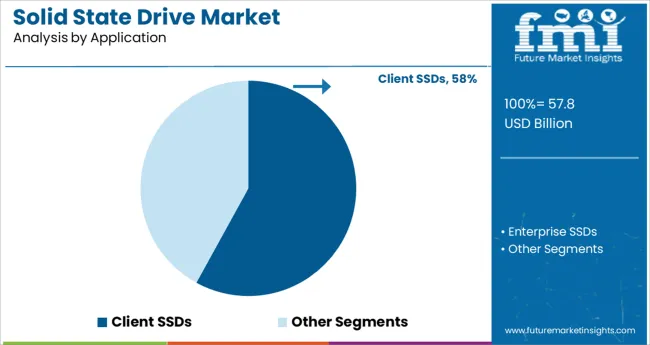
SSD utilization by Enterprises is forecasted to grow at the highest CAGR of around 10% from 2022 to 2032. The worldwide enterprise SSD market is growing due to greater efficiency, high throughput, and improved power efficiency of business SSD. Furthermore, fast developments in high-end cloud services are imparting a substantial influence on the higher usage of SSD solutions for data center applications.

NAND-based flash memory solutions are witnessing substantial demand from organizations due to their long durability, low cost, and quicker storage with a low error rate. This drives the need for SSD solutions in enterprises globally.

The market of enterprise SSD is predicted to develop significantly during the forecast period, due to the rising introduction of high-tech cloud computing in organizations. Furthermore, the significant rise in the utility of SSD over Hard Disc Drive (HDD) in the key business verticals is projected to drive market expansion.

However, the expensive cost of implementing SSD solutions is a significant market barrier. On the contrary, an increase in unstructured data combined with real-time analysis is likely to create a significant potential for the demand of the enterprise SS.
Competitive Landscape of the SSD Market

Since the market's entry barriers are high, it is difficult for new firms to enter. The market's existing suppliers are substantially spending on research and development to improve their existing portfolio. The top solid-state drive manufacturers include Intel Corporation, Samsung Group, Micron Technology, Inc., Toshiba Corporation, Western Digital Corporation, Inc., ADATA Technology Co. Ltd., Transcend Information Inc., Kingston Technology Corporation, SK Hynix Inc., and Teclast Electronics Co., Limited.

Some of the recent developments in Solid State Drive Market are as follows:

  • In February 2021, Seagate introduced the FireCuda 120 SATA SSDs. It has a sequential read/write speed of 560/540 MB/s. It has capacities ranging between 500GB to 4TB. It is intended for gamers and offers speed, durability, and large storage.
  • In April 2021, Samsung introduced a new business SSD with improved performance. They produced a high-performance industrial solid-state drive that covers the most recent Serial ATA (SATA) interface. According to Samsung, the PM1653 is the industry's first 24G SAS SSD manufactured that uses sixth-generation V-NAND memory devices, with storage capacities starting from 800 GB to 30.72 TB for corporate server systems. A high-speed data transfer link such as SAS SSD is utilized in servers and large computer storage devices.
  • In March 2021, Western Digital has announced the release of various new consumer-oriented compact SSDs with 4TB Storage under the WD, SanDisk, and WD Black brands. The latest 4TB SSDs are intended for gamers, multimedia makers, and creative workers that want more storage. The WD Black has read rates of up to 2000 MB/s and is compatible with PC, PlayStation, and Xbox One game collections.

Similarly, recent developments related to solid-state drive companies have been tracked by the team at Future Market Insights, which are available in the full report.

Top Segments Studied in the SSD Market Research Report

By Type:

  • External
  • Internal

By Interface Type:

  • SATA SSD
  • SAS SSD
  • PCI-E SSD

By Form Factor:

  • 1.8”/2.5”
  • 3.5”
  • M.2
  • U.2
  • FHHL/ HHHL

By Storage:

  • Under 500 GB SSD
  • 599 GB - 1 TB SSD
  • 1 TB - 2 TB SSD
  • Above 2 TB SSD

By Application:

  • Enterprise SSDs
  • Client SSDs

By Region:

  • North America
  • Europe
  • Asia Pacific
  • Middle East and Africa
  • Latin America

Table of Content

  • 1. Executive Summary | Solid State Drive Market
  • 2. Market Overview
  • 3. Market Background
  • 4. Global Market Analysis 2017 to 2021 and Forecast, 2022 to 2032
  • 5. Global Market Analysis 2017 to 2021 and Forecast 2022 to 2032, By Type
    • 5.1. External
    • 5.2. Internal
  • 6. Global Market Analysis 2017 to 2021 and Forecast 2022 to 2032, By Interface
    • 6.1. SATA
    • 6.2. SAS
    • 6.3. PCIe
  • 7. Global Market Analysis 2017 to 2021 and Forecast 2022 to 2032, By Form Factor
    • 7.1. 1.8”/2.5”
    • 7.2. 3.5”
    • 7.3. M.2
    • 7.4. U.2 (SFF 8639)
    • 7.5. FHHL and HHHL
  • 8. Global Market Analysis 2017 to 2021 and Forecast 2022 to 2032, By Storage
    • 8.1. Under 500 GB
    • 8.2. 500 GB -1 TB
    • 8.3. 1 TB - 2 TB
    • 8.4. Above 2 TB
  • 9. Global Market Analysis 2017 to 2021 and Forecast 2022 to 2032, By Application
    • 9.1. Enterprise
    • 9.2. Client
    • 9.3. Others
  • 10. Global Market Analysis 2017 to 2021 and Forecast 2022 to 2032, By Region
    • 10.1. North America
    • 10.2. Latin America
    • 10.3. Europe
    • 10.4. Asia Pacific
    • 10.5. Middle East and Africa
  • 11. North America Market Analysis 2017 to 2021 and Forecast 2022 to 2032, By Country
  • 12. Latin America Market Analysis 2017 to 2021 and Forecast 2022 to 2032, By Country
  • 13. Europe Market Analysis 2017 to 2021 and Forecast 2022 to 2032, By Country
  • 14. Asia Pacific Market Analysis 2017 to 2021 and Forecast 2022 to 2032, By Country
  • 15. Middle East and Africa Market Analysis 2017 to 2021 and Forecast 2022 to 2032, By Country
  • 16. Key Countries Market Analysis
  • 17. Market Structure Analysis
  • 18. Competition Analysis
    • 18.1. ADATA Technology Co. Ltd
    • 18.2. Corsair Gaming Inc.
    • 18.3. Kingston Technology Corporation
    • 18.4. KIOXIA Holdings Corporation
    • 18.5. Micron Technology Inc.
    • 18.6. Samsung Electronics Co. Ltd
    • 18.7. Seagate Technology LLC
    • 18.8. SK hynix Inc.
    • 18.9. Toshiba Corporation
    • 18.10. Transcend Information Inc
    • 18.11. Western Digital Corporation
  • 19. Assumptions & Acronyms Used
  • 20. Research Methodology

List of Tables

Table 1: Global Market Value (US$ Million) Forecast by Region, 2017 to 2032

Table 2: Global Market Volume (Units) Forecast by Region, 2017 to 2032

Table 3: Global Market Value (US$ Million) Forecast by Type, 2017 to 2032

Table 4: Global Market Volume (Units) Forecast by Type, 2017 to 2032

Table 5: Global Market Value (US$ Million) Forecast by Interface, 2017 to 2032

Table 6: Global Market Volume (Units) Forecast by Interface, 2017 to 2032

Table 7: Global Market Value (US$ Million) Forecast by Form Factor, 2017 to 2032

Table 8: Global Market Volume (Units) Forecast by Form Factor, 2017 to 2032

Table 9: Global Market Value (US$ Million) Forecast by Storage, 2017 to 2032

Table 10: Global Market Volume (Units) Forecast by Storage, 2017 to 2032

Table 11: Global Market Value (US$ Million) Forecast by Application, 2017 to 2032

Table 12: Global Market Volume (Units) Forecast by Application, 2017 to 2032

Table 13: North America Market Value (US$ Million) Forecast by Country, 2017 to 2032

Table 14: North America Market Volume (Units) Forecast by Country, 2017 to 2032

Table 15: North America Market Value (US$ Million) Forecast by Type, 2017 to 2032

Table 16: North America Market Volume (Units) Forecast by Type, 2017 to 2032

Table 17: North America Market Value (US$ Million) Forecast by Interface, 2017 to 2032

Table 18: North America Market Volume (Units) Forecast by Interface, 2017 to 2032

Table 19: North America Market Value (US$ Million) Forecast by Form Factor, 2017 to 2032

Table 20: North America Market Volume (Units) Forecast by Form Factor, 2017 to 2032

Table 21: North America Market Value (US$ Million) Forecast by Storage, 2017 to 2032

Table 22: North America Market Volume (Units) Forecast by Storage, 2017 to 2032

Table 23: North America Market Value (US$ Million) Forecast by Application, 2017 to 2032

Table 24: North America Market Volume (Units) Forecast by Application, 2017 to 2032

Table 25: Latin America Market Value (US$ Million) Forecast by Country, 2017 to 2032

Table 26: Latin America Market Volume (Units) Forecast by Country, 2017 to 2032

Table 27: Latin America Market Value (US$ Million) Forecast by Type, 2017 to 2032

Table 28: Latin America Market Volume (Units) Forecast by Type, 2017 to 2032

Table 29: Latin America Market Value (US$ Million) Forecast by Interface, 2017 to 2032

Table 30: Latin America Market Volume (Units) Forecast by Interface, 2017 to 2032

Table 31: Latin America Market Value (US$ Million) Forecast by Form Factor, 2017 to 2032

Table 32: Latin America Market Volume (Units) Forecast by Form Factor, 2017 to 2032

Table 33: Latin America Market Value (US$ Million) Forecast by Storage, 2017 to 2032

Table 34: Latin America Market Volume (Units) Forecast by Storage, 2017 to 2032

Table 35: Latin America Market Value (US$ Million) Forecast by Application, 2017 to 2032

Table 36: Latin America Market Volume (Units) Forecast by Application, 2017 to 2032

Table 37: Europe Market Value (US$ Million) Forecast by Country, 2017 to 2032

Table 38: Europe Market Volume (Units) Forecast by Country, 2017 to 2032

Table 39: Europe Market Value (US$ Million) Forecast by Type, 2017 to 2032

Table 40: Europe Market Volume (Units) Forecast by Type, 2017 to 2032

Table 41: Europe Market Value (US$ Million) Forecast by Interface, 2017 to 2032

Table 42: Europe Market Volume (Units) Forecast by Interface, 2017 to 2032

Table 43: Europe Market Value (US$ Million) Forecast by Form Factor, 2017 to 2032

Table 44: Europe Market Volume (Units) Forecast by Form Factor, 2017 to 2032

Table 45: Europe Market Value (US$ Million) Forecast by Storage, 2017 to 2032

Table 46: Europe Market Volume (Units) Forecast by Storage, 2017 to 2032

Table 47: Europe Market Value (US$ Million) Forecast by Application, 2017 to 2032

Table 48: Europe Market Volume (Units) Forecast by Application, 2017 to 2032

Table 49: Asia Pacific Market Value (US$ Million) Forecast by Country, 2017 to 2032

Table 50: Asia Pacific Market Volume (Units) Forecast by Country, 2017 to 2032

Table 51: Asia Pacific Market Value (US$ Million) Forecast by Type, 2017 to 2032

Table 52: Asia Pacific Market Volume (Units) Forecast by Type, 2017 to 2032

Table 53: Asia Pacific Market Value (US$ Million) Forecast by Interface, 2017 to 2032

Table 54: Asia Pacific Market Volume (Units) Forecast by Interface, 2017 to 2032

Table 55: Asia Pacific Market Value (US$ Million) Forecast by Form Factor, 2017 to 2032

Table 56: Asia Pacific Market Volume (Units) Forecast by Form Factor, 2017 to 2032

Table 57: Asia Pacific Market Value (US$ Million) Forecast by Storage, 2017 to 2032

Table 58: Asia Pacific Market Volume (Units) Forecast by Storage, 2017 to 2032

Table 59: Asia Pacific Market Value (US$ Million) Forecast by Application, 2017 to 2032

Table 60: Asia Pacific Market Volume (Units) Forecast by Application, 2017 to 2032

Table 61: Middle East and Africa Market Value (US$ Million) Forecast by Country, 2017 to 2032

Table 62: Middle East and Africa Market Volume (Units) Forecast by Country, 2017 to 2032

Table 63: Middle East and Africa Market Value (US$ Million) Forecast by Type, 2017 to 2032

Table 64: Middle East and Africa Market Volume (Units) Forecast by Type, 2017 to 2032

Table 65: Middle East and Africa Market Value (US$ Million) Forecast by Interface, 2017 to 2032

Table 66: Middle East and Africa Market Volume (Units) Forecast by Interface, 2017 to 2032

Table 67: Middle East and Africa Market Value (US$ Million) Forecast by Form Factor, 2017 to 2032

Table 68: Middle East and Africa Market Volume (Units) Forecast by Form Factor, 2017 to 2032

Table 69: Middle East and Africa Market Value (US$ Million) Forecast by Storage, 2017 to 2032

Table 70: Middle East and Africa Market Volume (Units) Forecast by Storage, 2017 to 2032

Table 71: Middle East and Africa Market Value (US$ Million) Forecast by Application, 2017 to 2032

Table 72: Middle East and Africa Market Volume (Units) Forecast by Application, 2017 to 2032

List of Figures

Figure 1: Global Market Value (US$ Million) by Type, 2022 to 2032

Figure 2: Global Market Value (US$ Million) by Interface, 2022 to 2032

Figure 3: Global Market Value (US$ Million) by Form Factor, 2022 to 2032

Figure 4: Global Market Value (US$ Million) by Storage, 2022 to 2032

Figure 5: Global Market Value (US$ Million) by Application, 2022 to 2032

Figure 6: Global Market Value (US$ Million) by Region, 2022 to 2032

Figure 7: Global Market Value (US$ Million) Analysis by Region, 2017 to 2032

Figure 8: Global Market Volume (Units) Analysis by Region, 2017 to 2032

Figure 9: Global Market Value Share (%) and BPS Analysis by Region, 2022 to 2032

Figure 10: Global Market Y-o-Y Growth (%) Projections by Region, 2022 to 2032

Figure 11: Global Market Value (US$ Million) Analysis by Type, 2017 to 2032

Figure 12: Global Market Volume (Units) Analysis by Type, 2017 to 2032

Figure 13: Global Market Value Share (%) and BPS Analysis by Type, 2022 to 2032

Figure 14: Global Market Y-o-Y Growth (%) Projections by Type, 2022 to 2032

Figure 15: Global Market Value (US$ Million) Analysis by Interface, 2017 to 2032

Figure 16: Global Market Volume (Units) Analysis by Interface, 2017 to 2032

Figure 17: Global Market Value Share (%) and BPS Analysis by Interface, 2022 to 2032

Figure 18: Global Market Y-o-Y Growth (%) Projections by Interface, 2022 to 2032

Figure 19: Global Market Value (US$ Million) Analysis by Form Factor, 2017 to 2032

Figure 20: Global Market Volume (Units) Analysis by Form Factor, 2017 to 2032

Figure 21: Global Market Value Share (%) and BPS Analysis by Form Factor, 2022 to 2032

Figure 22: Global Market Y-o-Y Growth (%) Projections by Form Factor, 2022 to 2032

Figure 23: Global Market Value (US$ Million) Analysis by Storage, 2017 to 2032

Figure 24: Global Market Volume (Units) Analysis by Storage, 2017 to 2032

Figure 25: Global Market Value Share (%) and BPS Analysis by Storage, 2022 to 2032

Figure 26: Global Market Y-o-Y Growth (%) Projections by Storage, 2022 to 2032

Figure 27: Global Market Value (US$ Million) Analysis by Application, 2017 to 2032

Figure 28: Global Market Volume (Units) Analysis by Application, 2017 to 2032

Figure 29: Global Market Value Share (%) and BPS Analysis by Application, 2022 to 2032

Figure 30: Global Market Y-o-Y Growth (%) Projections by Application, 2022 to 2032

Figure 31: Global Market Attractiveness by Type, 2022 to 2032

Figure 32: Global Market Attractiveness by Interface, 2022 to 2032

Figure 33: Global Market Attractiveness by Form Factor, 2022 to 2032

Figure 34: Global Market Attractiveness by Storage, 2022 to 2032

Figure 35: Global Market Attractiveness by Application, 2022 to 2032

Figure 36: Global Market Attractiveness by Region, 2022 to 2032

Figure 37: North America Market Value (US$ Million) by Type, 2022 to 2032

Figure 38: North America Market Value (US$ Million) by Interface, 2022 to 2032

Figure 39: North America Market Value (US$ Million) by Form Factor, 2022 to 2032

Figure 40: North America Market Value (US$ Million) by Storage, 2022 to 2032

Figure 41: North America Market Value (US$ Million) by Application, 2022 to 2032

Figure 42: North America Market Value (US$ Million) by Country, 2022 to 2032

Figure 43: North America Market Value (US$ Million) Analysis by Country, 2017 to 2032

Figure 44: North America Market Volume (Units) Analysis by Country, 2017 to 2032

Figure 45: North America Market Value Share (%) and BPS Analysis by Country, 2022 to 2032

Figure 46: North America Market Y-o-Y Growth (%) Projections by Country, 2022 to 2032

Figure 47: North America Market Value (US$ Million) Analysis by Type, 2017 to 2032

Figure 48: North America Market Volume (Units) Analysis by Type, 2017 to 2032

Figure 49: North America Market Value Share (%) and BPS Analysis by Type, 2022 to 2032

Figure 50: North America Market Y-o-Y Growth (%) Projections by Type, 2022 to 2032

Figure 51: North America Market Value (US$ Million) Analysis by Interface, 2017 to 2032

Figure 52: North America Market Volume (Units) Analysis by Interface, 2017 to 2032

Figure 53: North America Market Value Share (%) and BPS Analysis by Interface, 2022 to 2032

Figure 54: North America Market Y-o-Y Growth (%) Projections by Interface, 2022 to 2032

Figure 55: North America Market Value (US$ Million) Analysis by Form Factor, 2017 to 2032

Figure 56: North America Market Volume (Units) Analysis by Form Factor, 2017 to 2032

Figure 57: North America Market Value Share (%) and BPS Analysis by Form Factor, 2022 to 2032

Figure 58: North America Market Y-o-Y Growth (%) Projections by Form Factor, 2022 to 2032

Figure 59: North America Market Value (US$ Million) Analysis by Storage, 2017 to 2032

Figure 60: North America Market Volume (Units) Analysis by Storage, 2017 to 2032

Figure 61: North America Market Value Share (%) and BPS Analysis by Storage, 2022 to 2032

Figure 62: North America Market Y-o-Y Growth (%) Projections by Storage, 2022 to 2032

Figure 63: North America Market Value (US$ Million) Analysis by Application, 2017 to 2032

Figure 64: North America Market Volume (Units) Analysis by Application, 2017 to 2032

Figure 65: North America Market Value Share (%) and BPS Analysis by Application, 2022 to 2032

Figure 66: North America Market Y-o-Y Growth (%) Projections by Application, 2022 to 2032

Figure 67: North America Market Attractiveness by Type, 2022 to 2032

Figure 68: North America Market Attractiveness by Interface, 2022 to 2032

Figure 69: North America Market Attractiveness by Form Factor, 2022 to 2032

Figure 70: North America Market Attractiveness by Storage, 2022 to 2032

Figure 71: North America Market Attractiveness by Application, 2022 to 2032

Figure 72: North America Market Attractiveness by Country, 2022 to 2032

Figure 73: Latin America Market Value (US$ Million) by Type, 2022 to 2032

Figure 74: Latin America Market Value (US$ Million) by Interface, 2022 to 2032

Figure 75: Latin America Market Value (US$ Million) by Form Factor, 2022 to 2032

Figure 76: Latin America Market Value (US$ Million) by Storage, 2022 to 2032

Figure 77: Latin America Market Value (US$ Million) by Application, 2022 to 2032

Figure 78: Latin America Market Value (US$ Million) by Country, 2022 to 2032

Figure 79: Latin America Market Value (US$ Million) Analysis by Country, 2017 to 2032

Figure 80: Latin America Market Volume (Units) Analysis by Country, 2017 to 2032

Figure 81: Latin America Market Value Share (%) and BPS Analysis by Country, 2022 to 2032

Figure 82: Latin America Market Y-o-Y Growth (%) Projections by Country, 2022 to 2032

Figure 83: Latin America Market Value (US$ Million) Analysis by Type, 2017 to 2032

Figure 84: Latin America Market Volume (Units) Analysis by Type, 2017 to 2032

Figure 85: Latin America Market Value Share (%) and BPS Analysis by Type, 2022 to 2032

Figure 86: Latin America Market Y-o-Y Growth (%) Projections by Type, 2022 to 2032

Figure 87: Latin America Market Value (US$ Million) Analysis by Interface, 2017 to 2032

Figure 88: Latin America Market Volume (Units) Analysis by Interface, 2017 to 2032

Figure 89: Latin America Market Value Share (%) and BPS Analysis by Interface, 2022 to 2032

Figure 90: Latin America Market Y-o-Y Growth (%) Projections by Interface, 2022 to 2032

Figure 91: Latin America Market Value (US$ Million) Analysis by Form Factor, 2017 to 2032

Figure 92: Latin America Market Volume (Units) Analysis by Form Factor, 2017 to 2032

Figure 93: Latin America Market Value Share (%) and BPS Analysis by Form Factor, 2022 to 2032

Figure 94: Latin America Market Y-o-Y Growth (%) Projections by Form Factor, 2022 to 2032

Figure 95: Latin America Market Value (US$ Million) Analysis by Storage, 2017 to 2032

Figure 96: Latin America Market Volume (Units) Analysis by Storage, 2017 to 2032

Figure 97: Latin America Market Value Share (%) and BPS Analysis by Storage, 2022 to 2032

Figure 98: Latin America Market Y-o-Y Growth (%) Projections by Storage, 2022 to 2032

Figure 99: Latin America Market Value (US$ Million) Analysis by Application, 2017 to 2032

Figure 100: Latin America Market Volume (Units) Analysis by Application, 2017 to 2032

Figure 101: Latin America Market Value Share (%) and BPS Analysis by Application, 2022 to 2032

Figure 102: Latin America Market Y-o-Y Growth (%) Projections by Application, 2022 to 2032

Figure 103: Latin America Market Attractiveness by Type, 2022 to 2032

Figure 104: Latin America Market Attractiveness by Interface, 2022 to 2032

Figure 105: Latin America Market Attractiveness by Form Factor, 2022 to 2032

Figure 106: Latin America Market Attractiveness by Storage, 2022 to 2032

Figure 107: Latin America Market Attractiveness by Application, 2022 to 2032

Figure 108: Latin America Market Attractiveness by Country, 2022 to 2032

Figure 109: Europe Market Value (US$ Million) by Type, 2022 to 2032

Figure 110: Europe Market Value (US$ Million) by Interface, 2022 to 2032

Figure 111: Europe Market Value (US$ Million) by Form Factor, 2022 to 2032

Figure 112: Europe Market Value (US$ Million) by Storage, 2022 to 2032

Figure 113: Europe Market Value (US$ Million) by Application, 2022 to 2032

Figure 114: Europe Market Value (US$ Million) by Country, 2022 to 2032

Figure 115: Europe Market Value (US$ Million) Analysis by Country, 2017 to 2032

Figure 116: Europe Market Volume (Units) Analysis by Country, 2017 to 2032

Figure 117: Europe Market Value Share (%) and BPS Analysis by Country, 2022 to 2032

Figure 118: Europe Market Y-o-Y Growth (%) Projections by Country, 2022 to 2032

Figure 119: Europe Market Value (US$ Million) Analysis by Type, 2017 to 2032

Figure 120: Europe Market Volume (Units) Analysis by Type, 2017 to 2032

Figure 121: Europe Market Value Share (%) and BPS Analysis by Type, 2022 to 2032

Figure 122: Europe Market Y-o-Y Growth (%) Projections by Type, 2022 to 2032

Figure 123: Europe Market Value (US$ Million) Analysis by Interface, 2017 to 2032

Figure 124: Europe Market Volume (Units) Analysis by Interface, 2017 to 2032

Figure 125: Europe Market Value Share (%) and BPS Analysis by Interface, 2022 to 2032

Figure 126: Europe Market Y-o-Y Growth (%) Projections by Interface, 2022 to 2032

Figure 127: Europe Market Value (US$ Million) Analysis by Form Factor, 2017 to 2032

Figure 128: Europe Market Volume (Units) Analysis by Form Factor, 2017 to 2032

Figure 129: Europe Market Value Share (%) and BPS Analysis by Form Factor, 2022 to 2032

Figure 130: Europe Market Y-o-Y Growth (%) Projections by Form Factor, 2022 to 2032

Figure 131: Europe Market Value (US$ Million) Analysis by Storage, 2017 to 2032

Figure 132: Europe Market Volume (Units) Analysis by Storage, 2017 to 2032

Figure 133: Europe Market Value Share (%) and BPS Analysis by Storage, 2022 to 2032

Figure 134: Europe Market Y-o-Y Growth (%) Projections by Storage, 2022 to 2032

Figure 135: Europe Market Value (US$ Million) Analysis by Application, 2017 to 2032

Figure 136: Europe Market Volume (Units) Analysis by Application, 2017 to 2032

Figure 137: Europe Market Value Share (%) and BPS Analysis by Application, 2022 to 2032

Figure 138: Europe Market Y-o-Y Growth (%) Projections by Application, 2022 to 2032

Figure 139: Europe Market Attractiveness by Type, 2022 to 2032

Figure 140: Europe Market Attractiveness by Interface, 2022 to 2032

Figure 141: Europe Market Attractiveness by Form Factor, 2022 to 2032

Figure 142: Europe Market Attractiveness by Storage, 2022 to 2032

Figure 143: Europe Market Attractiveness by Application, 2022 to 2032

Figure 144: Europe Market Attractiveness by Country, 2022 to 2032

Figure 145: Asia Pacific Market Value (US$ Million) by Type, 2022 to 2032

Figure 146: Asia Pacific Market Value (US$ Million) by Interface, 2022 to 2032

Figure 147: Asia Pacific Market Value (US$ Million) by Form Factor, 2022 to 2032

Figure 148: Asia Pacific Market Value (US$ Million) by Storage, 2022 to 2032

Figure 149: Asia Pacific Market Value (US$ Million) by Application, 2022 to 2032

Figure 150: Asia Pacific Market Value (US$ Million) by Country, 2022 to 2032

Figure 151: Asia Pacific Market Value (US$ Million) Analysis by Country, 2017 to 2032

Figure 152: Asia Pacific Market Volume (Units) Analysis by Country, 2017 to 2032

Figure 153: Asia Pacific Market Value Share (%) and BPS Analysis by Country, 2022 to 2032

Figure 154: Asia Pacific Market Y-o-Y Growth (%) Projections by Country, 2022 to 2032

Figure 155: Asia Pacific Market Value (US$ Million) Analysis by Type, 2017 to 2032

Figure 156: Asia Pacific Market Volume (Units) Analysis by Type, 2017 to 2032

Figure 157: Asia Pacific Market Value Share (%) and BPS Analysis by Type, 2022 to 2032

Figure 158: Asia Pacific Market Y-o-Y Growth (%) Projections by Type, 2022 to 2032

Figure 159: Asia Pacific Market Value (US$ Million) Analysis by Interface, 2017 to 2032

Figure 160: Asia Pacific Market Volume (Units) Analysis by Interface, 2017 to 2032

Figure 161: Asia Pacific Market Value Share (%) and BPS Analysis by Interface, 2022 to 2032

Figure 162: Asia Pacific Market Y-o-Y Growth (%) Projections by Interface, 2022 to 2032

Figure 163: Asia Pacific Market Value (US$ Million) Analysis by Form Factor, 2017 to 2032

Figure 164: Asia Pacific Market Volume (Units) Analysis by Form Factor, 2017 to 2032

Figure 165: Asia Pacific Market Value Share (%) and BPS Analysis by Form Factor, 2022 to 2032

Figure 166: Asia Pacific Market Y-o-Y Growth (%) Projections by Form Factor, 2022 to 2032

Figure 167: Asia Pacific Market Value (US$ Million) Analysis by Storage, 2017 to 2032

Figure 168: Asia Pacific Market Volume (Units) Analysis by Storage, 2017 to 2032

Figure 169: Asia Pacific Market Value Share (%) and BPS Analysis by Storage, 2022 to 2032

Figure 170: Asia Pacific Market Y-o-Y Growth (%) Projections by Storage, 2022 to 2032

Figure 171: Asia Pacific Market Value (US$ Million) Analysis by Application, 2017 to 2032

Figure 172: Asia Pacific Market Volume (Units) Analysis by Application, 2017 to 2032

Figure 173: Asia Pacific Market Value Share (%) and BPS Analysis by Application, 2022 to 2032

Figure 174: Asia Pacific Market Y-o-Y Growth (%) Projections by Application, 2022 to 2032

Figure 175: Asia Pacific Market Attractiveness by Type, 2022 to 2032

Figure 176: Asia Pacific Market Attractiveness by Interface, 2022 to 2032

Figure 177: Asia Pacific Market Attractiveness by Form Factor, 2022 to 2032

Figure 178: Asia Pacific Market Attractiveness by Storage, 2022 to 2032

Figure 179: Asia Pacific Market Attractiveness by Application, 2022 to 2032

Figure 180: Asia Pacific Market Attractiveness by Country, 2022 to 2032

Figure 181: Middle East and Africa Market Value (US$ Million) by Type, 2022 to 2032

Figure 182: Middle East and Africa Market Value (US$ Million) by Interface, 2022 to 2032

Figure 183: Middle East and Africa Market Value (US$ Million) by Form Factor, 2022 to 2032

Figure 184: Middle East and Africa Market Value (US$ Million) by Storage, 2022 to 2032

Figure 185: Middle East and Africa Market Value (US$ Million) by Application, 2022 to 2032

Figure 186: Middle East and Africa Market Value (US$ Million) by Country, 2022 to 2032

Figure 187: Middle East and Africa Market Value (US$ Million) Analysis by Country, 2017 to 2032

Figure 188: Middle East and Africa Market Volume (Units) Analysis by Country, 2017 to 2032

Figure 189: Middle East and Africa Market Value Share (%) and BPS Analysis by Country, 2022 to 2032

Figure 190: Middle East and Africa Market Y-o-Y Growth (%) Projections by Country, 2022 to 2032

Figure 191: Middle East and Africa Market Value (US$ Million) Analysis by Type, 2017 to 2032

Figure 192: Middle East and Africa Market Volume (Units) Analysis by Type, 2017 to 2032

Figure 193: Middle East and Africa Market Value Share (%) and BPS Analysis by Type, 2022 to 2032

Figure 194: Middle East and Africa Market Y-o-Y Growth (%) Projections by Type, 2022 to 2032

Figure 195: Middle East and Africa Market Value (US$ Million) Analysis by Interface, 2017 to 2032

Figure 196: Middle East and Africa Market Volume (Units) Analysis by Interface, 2017 to 2032

Figure 197: Middle East and Africa Market Value Share (%) and BPS Analysis by Interface, 2022 to 2032

Figure 198: Middle East and Africa Market Y-o-Y Growth (%) Projections by Interface, 2022 to 2032

Figure 199: Middle East and Africa Market Value (US$ Million) Analysis by Form Factor, 2017 to 2032

Figure 200: Middle East and Africa Market Volume (Units) Analysis by Form Factor, 2017 to 2032

Figure 201: Middle East and Africa Market Value Share (%) and BPS Analysis by Form Factor, 2022 to 2032

Figure 202: Middle East and Africa Market Y-o-Y Growth (%) Projections by Form Factor, 2022 to 2032

Figure 203: Middle East and Africa Market Value (US$ Million) Analysis by Storage, 2017 to 2032

Figure 204: Middle East and Africa Market Volume (Units) Analysis by Storage, 2017 to 2032

Figure 205: Middle East and Africa Market Value Share (%) and BPS Analysis by Storage, 2022 to 2032

Figure 206: Middle East and Africa Market Y-o-Y Growth (%) Projections by Storage, 2022 to 2032

Figure 207: Middle East and Africa Market Value (US$ Million) Analysis by Application, 2017 to 2032

Figure 208: Middle East and Africa Market Volume (Units) Analysis by Application, 2017 to 2032

Figure 209: Middle East and Africa Market Value Share (%) and BPS Analysis by Application, 2022 to 2032

Figure 210: Middle East and Africa Market Y-o-Y Growth (%) Projections by Application, 2022 to 2032

Figure 211: Middle East and Africa Market Attractiveness by Type, 2022 to 2032

Figure 212: Middle East and Africa Market Attractiveness by Interface, 2022 to 2032

Figure 213: Middle East and Africa Market Attractiveness by Form Factor, 2022 to 2032

Figure 214: Middle East and Africa Market Attractiveness by Storage, 2022 to 2032

Figure 215: Middle East and Africa Market Attractiveness by Application, 2022 to 2032

Figure 216: Middle East and Africa Market Attractiveness by Country, 2022 to 2032

Frequently Asked Questions

How much is the current worth of the SSD Market?

The global SSD Market is worth more than USD 37.6 Billion at present.

What is the sales forecast for SSD Market?

The value of the SSD Market is projected to increase at a CAGR of around 10% from 2022 to 2032.

What was the last 5 year’s market CAGR?

The value of the SSD Market increased at a CAGR of around 15.7% from 2017 to 2021.

What is a key trend shaping the growth of SSD Market?

New product development, technological advancements, rising need for memory devices, faster user interface, strong government support, and foreign investments are the trends shaping the market growth.

At what percentage is sales of SSD Market going to register growth in US?

The market for SSD Market in the US is projected to expand at a CAGR of around 9.1% from 2022 to 2032.

Explore Electronics & Components Insights

Future Market Insights

Solid State Drive Market