

- Industry Size (2026)
- USD 6.0 Bn
- Forecast (2036)
- USD 12.8 Bn
- CAGR (2026 to 2036)
- 7.8%
Demand for Compounding Pharmacies in USA Size, Market Forecast and Outlook By FMI
The demand for compounding pharmacies in usa was valued at USD 5.6 billion in 2025. The market is set to reach USD 6.0 billion by 2026-end and grow at a CAGR of 7.8% between 2026-2036 to reach USD 12.8 billion by 2036. oral medication will dominate with a 33.0% share, while 503A Pharmacies will lead with a 65.0% share.
Summary of the Demand for Compounding Pharmacies in USA
- Demand and Growth Drivers
- Regulatory approvals and clinical adoption of new therapeutic modalities are likely to support procurement growth across key treatment segments during the forecast period.
- Reimbursement expansion in North America and Europe is expected to sustain volume uptake as healthcare systems allocate budgets toward advanced treatment options.
- Demand in South reflects rising clinical infrastructure investment and increasing treatment access across both public and private healthcare channels.
- Product and Segment View
- 503A Pharmacies is likely to remain the leading pharmacy type segment at 65.0%, supported by established procurement channels and consistent end use demand.
- Oral medication accounts for 33.0% of the product type segment, reflecting growing buyer preference for specialized product configurations.
- Demand patterns across product type, pharmacy type, and therapeutic area categories indicate a market moving toward application specific procurement rather than commodity purchasing.
- Geography and Competitive Outlook
- South is likely to remain a key growth market at 8.1%, supported by expanding production capacity and increasing domestic consumption.
- North America and Europe account for a significant share of global demand, with procurement shaped by regulatory standards and premiumization trends.
- Companies with integrated manufacturing, multi region distribution, and regulatory compliance capabilities are likely to consolidate market position during the forecast period.
- Analyst Opinion
- Nandini Roy Choudhury, Principal Consultant at FMI says, 'The demand for compounding pharmacies in usa is transitioning from volume driven growth toward value led differentiation. Companies that can align product development with regulatory requirements, end use specifications, and regional procurement preferences are likely to strengthen their competitive position through 2036. Cost competitiveness, reliability of supply chain and certification compliance continue to be the key considerations for buyers’ decisions across key markets.'
- The demand for compounding pharmacies in usa is transitioning from a commodity supply category to a more organized, specification driven procurement segment.
- Stringent quality requirements, growing end use applications and increasing focus on supply chain traceability are driving the adoption.
- Demand is further supported by regional capacity expansion, regulatory harmonization, and increasing investment in product development.
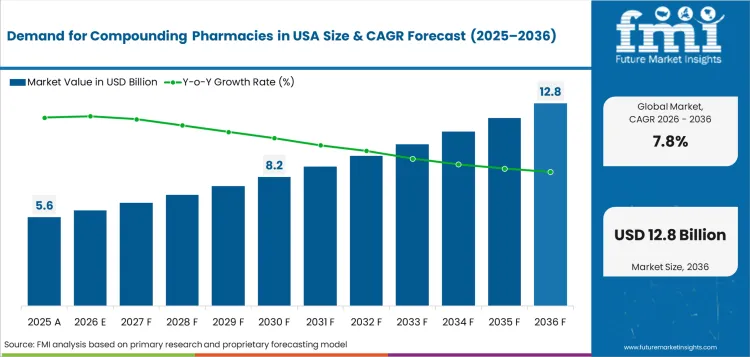
Key Takeaways, Market Size, and Forecast
| Metric | Value |
|---|---|
| Market Size (2025) | USD 5.60 Billion |
| Market Size (2036) | USD 12.79 Billion |
| CAGR (2026–2036) | 7.8% |
| Incremental Opportunity (2026–2036) | USD 6.76 Billion |
| Leading Pharmacy Type (2026) | 503A Pharmacies (65.0%) |
| Fastest-Growing Regions | South (8.1% CAGR), Midwest (7.9% CAGR) |
Demand for Compounding Pharmacies in USA Definition
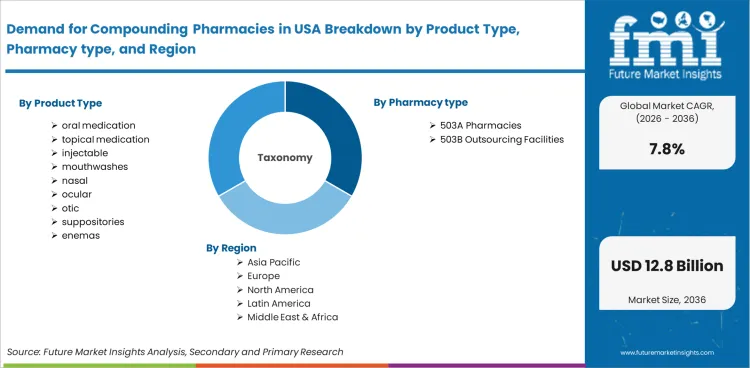
The demand for compounding pharmacies in usa encompasses all commercially traded products and services classified under this category, including oral medication, topical medication, injectable, mouthwashes, and nasal. The market scope covers procurement, manufacturing, and distribution activities across product type, pharmacy type, therapeutic area dimensions, with revenue tracked from 2026 to 2036.
Demand for Compounding Pharmacies in USA Inclusions
Market scope encompasses all commercially traded products categorized by product type (oral medication, topical medication, injectable, mouthwashes); pharmacy type (503A Pharmacies, 503B Outsourcing Facilities); therapeutic area (Pain Management, Hormone Replacement Therapy (HRT), Dermatology, Pediatrics); application (adults, pediatrics, geriatrics , veterinary). Revenue coverage spans from 2026 to 2036 across all major regions.
Demand for Compounding Pharmacies in USA Exclusions
The scope does not include unprocessed raw materials sold without commercial grading, products manufactured exclusively for internal consumption without commercial distribution, or adjacent categories that fall outside the defined segmentation taxonomy.
Demand for Compounding Pharmacies in USA Research Methodology
- Primary Research: FMI analysts interviewed manufacturers, distributors, procurement specialists and end use operators across key markets to validate demand patterns and pricing structures.
- Desk Research: Aggregated data from industry associations, regulatory filings, trade publications and manufacturer disclosures to set baseline market parameters.
- Market sizing and forecasting: Bottom-up aggregation across product segments, end use categories and regional markets calibrated to top-down macro-economic and industry production data
- Data Validation: Weekly cross checks against production statistics, trade data and manufacturer reported figures to maintain forecast accuracy.
Why is the Demand for Compounding Pharmacies in USA Growing?
- Clinical adoption expansion and regulatory pathway clarity across North America and Europe are creating sustained procurement demand for advanced therapeutic solutions in this category.
- Increased reimbursement coverage in major markets is lowering cost barriers for healthcare providers, leading to better patient access and higher treatment numbers.
- South at 8.1% is an acceleration in investment in clinical infrastructure and growing public health budgets for treatment modernization.
The compounding pharmacies market in usa is projected to grow at a CAGR of 7.8% during 2026-2036, supported by structural demand shifts across end use categories and regions. Growth is driven by increasing specification requirements, procurement formalization and the shift from commodity sourcing to value driven supplier selection. On the basis of pharmacy type, the 503A Pharmacies segment is estimated to account for 65.0% of the total pharmacy type, indicating concentrated demand in the established product configurations.
Pricing dynamics are still influenced by reimbursement policies, patent life and the time to get regulatory approvals. Companies with wide therapeutic portfolios and clinical evidence to support claims of efficacy are well placed to pick up margin as healthcare systems consolidate procurement towards proven solutions. North American and European geographic demand concentration indicates mature regulatory infrastructure and growth in South and Midwest indicates growing clinical access and public health investment.
Market Segmentation Analysis
- 503A Pharmacies holds 65.0% of the pharmacy type segment, reflecting concentrated demand in established product configurations with proven end use performance.
- oral medication accounts for 33.0% of product type demand, indicating growing procurement preference for specialized formats.
- Segmentation patterns indicate a market transitioning toward specification driven procurement across product type, pharmacy type, therapeutic area categories.
The demand for compounding pharmacies in usa is segmented by product type, pharmacy type, therapeutic area, application, end user. Demand concentration in 503a pharmacies reflects established supply chain positioning and consistent buyer preference for proven product configurations.
Insights into the Product Type Segment
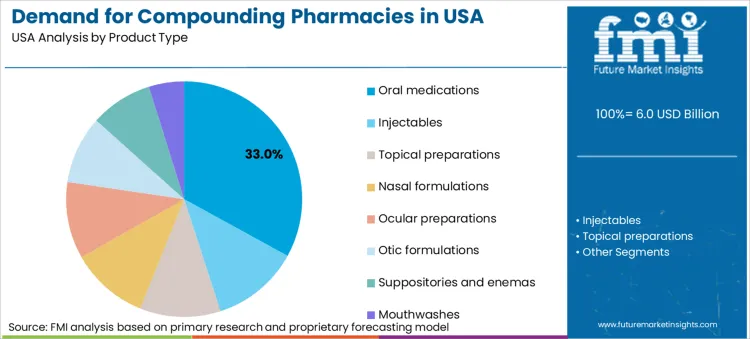
Oral medication accounts for 33.0% of product type demand in 2026. This concentration is reflective of well established procurement patterns and consistent end use requirements across key application areas.
Other product type categories such as topical medication, injectable, mouthwashes indicate growing application scope and diversifying buyer requirements. Growth in these sub segments indicates a maturity of the market beyond single format dependency.
Insights into the Pharmacy type Segment
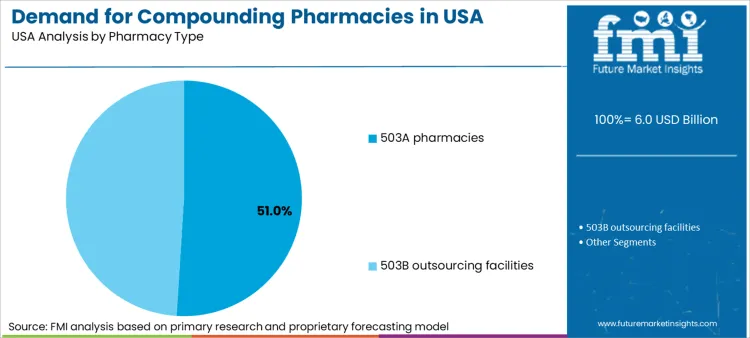
The demand for 503A pharmacies will be 65.0% of the pharmacy type in 2026. Such concentration reflects established procurement patterns and stable end use requirements across major application areas.
Expanding application scope and diversifying buyer requirements are also reflected in other pharmacy type categories including 503B Outsourcing Facilities. The growth of these sub segments shows that the market is maturing beyond a single format dependency.
Demand for Compounding Pharmacies in USA Drivers, Restraints, and Opportunities
- The rise in regulatory approval and reimbursement coverage is creating a structured demand for advanced treatment solutions in key therapeutic areas.
- Smaller manufacturers face limited margin expansion and market access due to high development costs, long approval times and pricing pressure from health systems.
- Growth opportunities in emerging markets are likely to be supported by investments in clinical infrastructure and programs to improve access to treatment, leading to a larger patient population to be treated with advanced therapies.
The demand for compounding pharmacies in usa continues to grow on the back of structural demand drivers, regulatory frameworks and changing end use requirements. Growth is guided by cost, scale and compliance complexity constraints and is directed to established players with integrated capabilities.
Regulatory Pathway Expansion and Clinical Adoption
Demand from increased regulatory approvals and broader clinical adoption across key therapeutic areas. Spending on procurement of advanced treatment solutions is on the rise in North America and Europe, while emerging markets are improving access via public health programs and infrastructure investments. The regulatory certainty from recent approval cycles is shortening time to market, allowing manufacturers to plan production capacity with more confidence.
Reimbursement Framework Evolution
Reimbursement coverage expansion in government and private payer systems drives growth. As clinical evidence and treatment protocols become more standardized, payers are willing to pay for advanced therapies. This structural shift from out of pocket to reimbursed purchasing creates predictability of volume and enables manufacturers to invest in scale of production.
Cost and Access Constraints
Adoption is constrained by high development costs, pricing pressure from consolidated healthcare purchasing organizations, and long timelines for regulatory approval in multiple jurisdictions. Payers are demanding evidence based pricing, volume based discounts putting pressure on manufacturers to compress margins. Companies with diversified portfolios and multi market regulatory presence are better placed to absorb these pressures.
Analysis of Demand for Compounding Pharmacies in USA by Key Countries
.webp "Top Country Growth Comparison Demand For Compounding Pharmacies In Usa Cagr (2026 2036)")
| Country | CAGR |
|---|---|
| South | 8.1% |
| Midwest | 7.9% |
| West | 7.5% |
| Northeast | 7.2% |
- South at 8.1% reflects strong structural demand supported by expanding end use capacity, regulatory investment, and procurement modernization.
- Midwest at 7.9% reflects strong structural demand supported by expanding end use capacity, regulatory investment, and procurement modernization.
- West at 7.5% reflects strong structural demand supported by expanding end use capacity, regulatory investment, and procurement modernization.
- Northeast (7.2%) show sustained growth supported by regulatory alignment and increasing market formalization.
The global demand for compounding pharmacies in usa is projected to expand at 7.8% from 2026 to 2036. The analysis covers more than 30 countries, with the key markets detailed below.
Demand Outlook for Demand for Compounding Pharmacies in USA in South
South is expected to grow at 8.1% through 2036. Growth is a sign of increasing capacity, increasing demand and more regulatory alignment.
- Increasing demand for procurement with production capacity expansion and infrastructure investment.
- Regional market access and regulatory harmonization help to competitively position for international trade.
- Sustained demand across application segments due to growing domestic consumption and industrial development.
Future Outlook for Demand for Compounding Pharmacies in USA in the Midwest
The Midwest is expected to increase by 7.9% through 2036. Growth drivers include aging rural population in the region requiring specialized medication, consolidation of the hospital system resulting in centralized compounding procurement and demand from agricultural communities for veterinary compounding.
- Aging rural populations with limited access to standard pharmacy options drive demand for compounded hormone replacement, pain management and specialty medications.
- Midwest hospital system consolidation leads to centralized compounding procurement for sterile injectables and custom dosage forms.
- Veterinary practices in the agricultural community generate compounding demand for livestock and equine medications not available in standard commercial formulations.
Opportunity Analysis of Demand for Compounding Pharmacies in USA in West
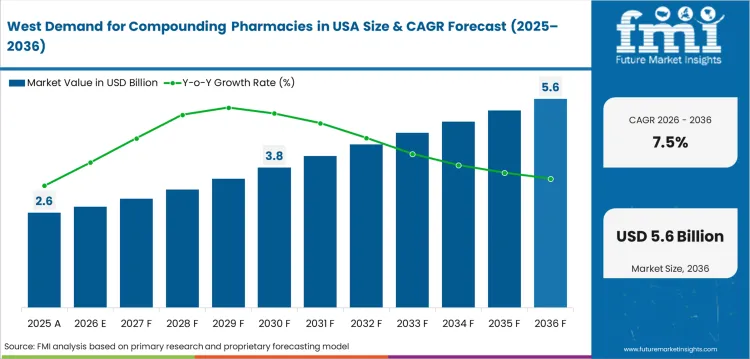
West is forecast to grow 7.7% through 2036. Growth is powered by the region’s embrace of integrative medicine, demand for dermatology and anti aging compounding in metropolitan markets, and state regulatory frameworks that support pharmacy compounding innovation.
- The volume of prescriptions for customized supplement and hormone formulations is generated by integrative and functional medicine practitioners in western metropolitan areas.
- Markets such as Los Angeles, San Francisco and Seattle have a high demand for dermatology and anti aging compounding, creating a premium procurement for topical and injectable preparations.
- State Board of Pharmacy regulations in California, Oregon and Washington foster compounding innovation and quality and safety oversight frameworks.
In-depth Analysis of Demand for Compounding Pharmacies in USA in Northeast
Northeastern growth is forecast at 7.5 percent through 2036. Growth is fueled by the region’s density of academic medical centers, the compounding needs of pediatric specialties and the concentration of specialty pharmacy operations focused on complex patient populations.
- Northeast has a high density of academic medical centers which drives the need for sterile compounding services, clinical trial preparations, and orphan drug formulations.
- Pediatric hospitals that need age-appropriate dosage forms and flavor modifications have a structured compounding procurement for non-standard medication preparations.
- Demand for complex compounded formulations for oncology and rare disease patients continues to be driven by specialty concentration in Boston, New York and Philadelphia corridors.
Competitive Landscape and Strategic Positioning
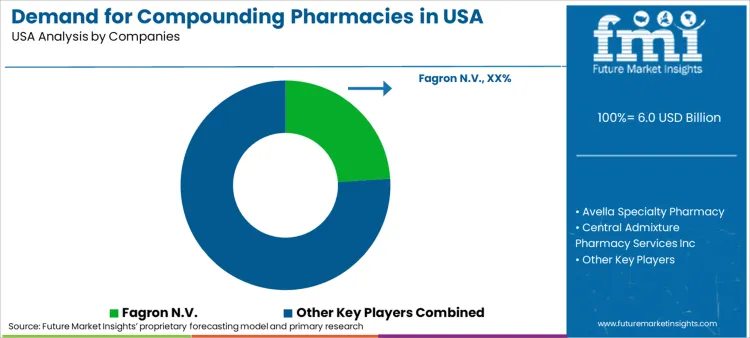
- Fagron N.V. holds a leading position with integrated manufacturing capabilities, multi-region distribution and established end use relationships.
- Avella Specialty Pharmacy and Central Admixture Pharmacy Services Inc compete on product breadth, technical capability and geographic coverage in key demand markets.
- New entrants are targeting specialized applications, niche product configurations and regional market penetration to gain competitive positions.
Fagron N.V. has a strong position in the demand for compounding pharmacies in usa through integrated manufacturing capabilities and established distribution relationships across key markets. The company competes on product breadth, production scale and multi region supply chain coverage.
Avella Specialty Pharmacy and Central Admixture Pharmacy Services Inc. compete on technical capability, customer relationships and geographic presence with a diversified product portfolio. Hoye’s Pharmacy is concentrating on specific application segments where the key players have the expertise and knowledge of the regional market.
Barriers to competition include economies of scale, regulatory approvals, supply chain relationships and capital requirements to increase capacity. Strategic priorities for leading players include cost optimization, geographical expansion, widening product portfolio and enhancing end use customer relationships.
Key Companies in the Demand for Compounding Pharmacies in USA
Key global companies leading the demand for compounding pharmacies in usa include:
- Fagron N.V., Avella Specialty Pharmacy, Central Admixture Pharmacy Services Inc, Hoye's Pharmacy maintain leading positions through integrated manufacturing infrastructure, established distribution networks, and broad product portfolios serving multiple end use segments and geographies.
- Vertisis Custom Pharmacy, Smith Caldwell Drug Store, Sixth Avenue Medical Pharmacy have established regional leadership through specialized product capabilities, local market knowledge, and targeted application expertise.
- Cantrell Drug Company, Clinigen Group, Dougherty's Pharmacy represent emerging competitive positions, focusing on niche applications, advanced technology, and specialized product configurations.
Competitive Benchmarking: Demand for Compounding Pharmacies in USA
| Company | Product Portfolio | Clinical Evidence | Regulatory Reach | Distribution Coverage |
|---|---|---|---|---|
| Fagron N.V. | High | High | Strong | Global |
| Avella Specialty Pharmacy | High | Medium | Strong | Global |
| Central Admixture Pharmacy Services Inc | Medium | High | Moderate | Regional |
| Hoye's Pharmacy | High | High | Strong | Global |
| Vertisis Custom Pharmacy | Medium | Medium | Moderate | Regional |
| Smith Caldwell Drug Store | Medium | High | Moderate | Regional |
| Sixth Avenue Medical Pharmacy | Low | High | Low | Regional |
| Cantrell Drug Company | Medium | High | Low | Regional |
| Clinigen Group | Low | Medium | Low | Regional |
| Dougherty's Pharmacy | Medium | High | Low | Regional |
Source: Future Market Insights competitive analysis, 2026.
Key Developments in Demand for Compounding Pharmacies in USA
- In 2025, Fagron N.V. expanded its sterile compounding and personalized medicine offerings through investments in 503B outsourcing facilities and specialty pharmaceutical services across North America.
- In 2025, Optum continued expanding specialty pharmacy and home delivery capabilities to support rising prescription and compounded therapy demand in the USA market.
Key Players in the Demand for Compounding Pharmacies in USA:
Major Global Players
- Fagron N.V.
- Avella Specialty Pharmacy
- Central Admixture Pharmacy Services Inc
- Hoye's Pharmacy
- Vertisis Custom Pharmacy
- Smith Caldwell Drug Store
- Sixth Avenue Medical Pharmacy
Emerging Players/Startups
- Cantrell Drug Company
- Clinigen Group
- Dougherty's Pharmacy
Report Scope and Coverage
| Parameter | Details |
|---|---|
| Quantitative Units | USD 6.04 billion to USD 12.79 billion, at a CAGR of 7.8% |
| Market Definition | The demand for compounding pharmacies in usa encompasses all commercially traded products and services within the defined segmentation scope, covering product type, pharmacy type, therapeutic area categories across major global markets. |
| Regions Covered | North America, Latin America, Europe, East Asia, South Asia and Pacific, Middle East and Africa |
| Countries Covered | South, Midwest, West, Northeast, 30 plus countries |
| Key Companies Profiled | Fagron N.V., Avella Specialty Pharmacy, Central Admixture Pharmacy Services Inc, Hoye's Pharmacy, Vertisis Custom Pharmacy, Smith Caldwell Drug Store, Sixth Avenue Medical Pharmacy, Cantrell Drug Company, Clinigen Group, Dougherty's Pharmacy |
| Forecast Period | 2026 to 2036 |
| Approach | Hybrid bottom up and top down methodology starting with verified transaction data, projecting adoption velocity across segments and regions. |
Market Segmentation Analysis
Demand for Compounding Pharmacies in USA Market Segmented by Product Type:
- oral medication
- solid medication
- capsules
- tablets
- mixtures
- lollipops
- lozenges
- liquid medication
- syrup
- solution
- emulsion
- suspension
- solid medication
- topical medication
- gels
- ointments
- creams
- lotions
- injectable
- mouthwashes
- nasal
- ocular
- otic
- suppositories
- enemas
Demand for Compounding Pharmacies in USA Market Segmented by Pharmacy type:
- 503A Pharmacies
- Traditional Compounding
- Patient-specific Prescriptions
- Local Pharmacies
- Small-scale Operations
- Customized Medications
- Community Pharmacies
- Traditional Compounding
- 503B Outsourcing Facilities
- Large-scale Compounding
- Batch Production
- Hospital Supply
- Registered Facilities
- FDA-regulated
- Sterile Compounding
- Large-scale Compounding
Demand for Compounding Pharmacies in USA Market Segmented by Therapeutic Area:
- Pain Management
- Chronic Pain
- Neuropathic Pain
- Arthritis
- Acute Pain
- Post-surgical Pain
- Injury-related Pain
- Chronic Pain
- Hormone Replacement Therapy (HRT)
- Menopause Treatment
- Estrogen Therapy
- Progesterone Therapy
- Testosterone Therapy
- Male Hormone Deficiency
- Androgen Replacement
- Menopause Treatment
- Dermatology
- Skin Disorders
- Acne
- Psoriasis
- Aesthetic Treatments
- Anti-aging
- Pigmentation
- Skin Disorders
- Pediatrics
- Pediatric Formulations
- Flavored Medicines
- Dose Customization
- Special Needs
- Allergy-free Formulations
- Sugar-free Medicines
- Pediatric Formulations
- Veterinary Medicine
- Pet Medications
- Flavored Drugs
- Custom Dosages
- Livestock Treatments
- Farm Animals
- Bulk Medications
- Pet Medications
Demand for Compounding Pharmacies in USA Market Segmented by Application:
- adults
- pediatrics
- geriatrics
- veterinary
Demand for Compounding Pharmacies in USA Market Segmented by End User:
- Hospitals
- Inpatient Pharmacy
- Critical Care
- Surgical Units
- Outpatient Pharmacy
- Routine Prescriptions
- Follow-up Care
- Inpatient Pharmacy
- Clinics
- Specialty Clinics
- Pain Clinics
- Dermatology Clinics
- General Clinics
- Primary Care
- Family Medicine
- Specialty Clinics
- Homecare Settings
- Personal Use
- Chronic Therapy
- Long-term Medication
- Elderly Care
- Customized Dosages
- Ease of Administration
- Personal Use
- Veterinary Clinics
- Pet Clinics
- Compounded Drugs
- Custom Formulations
- Animal Hospitals
- Large Animal Care
- Special Treatments
- Pet Clinics
Demand for Compounding Pharmacies in USA Market by Region:
- North America
- USA
- Canada
- Mexico
- Latin America
- Brazil
- Chile
- Rest of Latin America
- Western Europe
- Germany
- UK
- Italy
- Spain
- France
- Nordic
- BENELUX
- Rest of Western Europe
- Eastern Europe
- Russia
- Poland
- Hungary
- Balkan & Baltic
- Rest of Eastern Europe
- East Asia
- China
- Japan
- South Korea
- South Asia and Pacific
- India
- ASEAN
- Australia & New Zealand
- Rest of South Asia and Pacific
- Middle East & Africa
- Kingdom of Saudi Arabia
- Other GCC Countries
- Turkiye
- South Africa
- Other African Union
- Rest of Middle East & Africa
Research Sources and Bibliography
- 1. World Health Organization. (2025). Global Health Expenditure Database. WHO.
- 2. USA Food and Drug Administration. (2025). FDA Approved Drug Products Database. FDA.
- 3. European Medicines Agency. (2025). EMA Annual Report on Regulatory Activities. EMA.
- 4. International Society for Pharmaceutical Engineering. (2025). ISPE Industry Reports. ISPE.
- 5. World Bank. (2025). World Development Indicators: Health Expenditure. World Bank.
This bibliography is provided for reader reference. The full Future Market Insights report contains the complete reference list with publication dates, URLs, and supporting data for all cited works.
This Report Answers
- Estimating the size of the demand for compounding pharmacies in usa and revenue projections from 2026 to 2036.
- Segmentation analysis by product type, pharmacy type, therapeutic area, application.
- Regional and country level market insights covering more than 30 markets.
- Competitive landscape assessment including market positioning and strategic benchmarking.
- Identification of growth drivers, restraints, and commercial opportunities across segments.
- Technology and production analysis across key manufacturing and distribution channels.
- Investment opportunity identification across high growth segments and geographies.
- Supply chain and procurement pattern analysis.
- Delivery of data in PDF and Excel formats.
Frequently Asked Questions
What is the global market demand for Demand for Compounding Pharmacies in USA in 2026?
In 2026, the global demand for compounding pharmacies in usa is expected to be worth USD 6.04 billion.
How big will the Demand for Compounding Pharmacies in USA be in 2036?
By 2036, the demand for compounding pharmacies in usa is expected to be worth USD 12.79 billion.
How much is demand for Demand for Compounding Pharmacies in USA expected to grow between 2026 and 2036?
Between 2026 and 2036, demand for demand for compounding pharmacies in usa is expected to grow at a CAGR of 7.8%.
Which pharmacy type segment is likely to lead globally by 2026?
503A Pharmacies is projected to account for 65.0% of pharmacy type demand in 2026, reflecting established procurement patterns and consistent end use requirements.
What is causing demand to rise in South?
South is projected to grow at 8.1% through 2036, reflecting expanding production capacity, increasing domestic consumption, and government led investment in quality infrastructure.
What is causing demand to rise in Midwest?
Midwest is projected to grow at 7.9% through 2036, supported by regulatory modernization, premiumization trends, and increasing emphasis on supply chain quality.
What does this report mean by Demand for Compounding Pharmacies in USA definition?
The demand for compounding pharmacies in usa encompasses all commercially traded products and services within the defined segmentation scope, covering product type, pharmacy type, therapeutic area categories across major global markets.
How does FMI make the Demand for Compounding Pharmacies in USA forecast and validate it?
Forecasting models use a hybrid bottom up and top down approach, starting with verified transaction data and validating against industry production statistics, trade data, and manufacturer disclosures.
Preview the report firsthand - request a free sample
Get SampleGet the brochure for pricing and purchase details.
Get PDFTable of Content
- Executive Summary
- Global Market Outlook
- Demand-side Trends
- Supply-side Trends
- Technology Roadmap Analysis
- Analysis and Recommendations
- Market Overview
- Market Coverage / Taxonomy
- Market Definition / Scope / Limitations
- Research Methodology
- Chapter Orientation
- Analytical Lens and Working Hypotheses
- Market Structure, Signals, and Trend Drivers
- Benchmarking and Cross-market Comparability
- Market Sizing, Forecasting, and Opportunity Mapping
- Research Design and Evidence Framework
- Desk Research Programme (Secondary Evidence)
- Company Annual and Sustainability Reports
- Peer-reviewed Journals and Academic Literature
- Corporate Websites, Product Literature, and Technical Notes
- Earnings Decks and Investor Briefings
- Statutory Filings and Regulatory Disclosures
- Technical White Papers and Standards Notes
- Trade Journals, Industry Magazines, and Analyst Briefs
- Conference Proceedings, Webinars, and Seminar Materials
- Government Statistics Portals and Public Data Releases
- Press Releases and Reputable Media Coverage
- Specialist Newsletters and Curated Briefings
- Sector Databases and Reference Repositories
- FMI Internal Proprietary Databases and Historical Market Datasets
- Subscription Datasets and Paid Sources
- Social Channels, Communities, and Digital Listening Inputs
- Additional Desk Sources
- Expert Input and Fieldwork (Primary Evidence)
- Primary Modes
- Qualitative Interviews and Expert Elicitation
- Quantitative Surveys and Structured Data Capture
- Blended Approach
- Why Primary Evidence is Used
- Field Techniques
- Interviews
- Surveys
- Focus Groups
- Observational and In-context Research
- Social and Community Interactions
- Stakeholder Universe Engaged
- C-suite Leaders
- Board Members
- Presidents and Vice Presidents
- R&D and Innovation Heads
- Technical Specialists
- Domain Subject-matter Experts
- Scientists
- Physicians and Other Healthcare Professionals
- Governance, Ethics, and Data Stewardship
- Research Ethics
- Data Integrity and Handling
- Primary Modes
- Tooling, Models, and Reference Databases
- Desk Research Programme (Secondary Evidence)
- Data Engineering and Model Build
- Data Acquisition and Ingestion
- Cleaning, Normalisation, and Verification
- Synthesis, Triangulation, and Analysis
- Quality Assurance and Audit Trail
- Market Background
- Market Dynamics
- Drivers
- Restraints
- Opportunity
- Trends
- Scenario Forecast
- Demand in Optimistic Scenario
- Demand in Likely Scenario
- Demand in Conservative Scenario
- Opportunity Map Analysis
- Product Life Cycle Analysis
- Supply Chain Analysis
- Investment Feasibility Matrix
- Value Chain Analysis
- PESTLE and Porter’s Analysis
- Regulatory Landscape
- Regional Parent Market Outlook
- Production and Consumption Statistics
- Import and Export Statistics
- Market Dynamics
- Global Market Analysis 2021 to 2025 and Forecast, 2026 to 2036
- Historical Market Size Value (USD Million) Analysis, 2021 to 2025
- Current and Future Market Size Value (USD Million) Projections, 2026 to 2036
- Y-o-Y Growth Trend Analysis
- Absolute $ Opportunity Analysis
- Global Market Pricing Analysis 2021 to 2025 and Forecast 2026 to 2036
- Global Market Analysis 2021 to 2025 and Forecast 2026 to 2036, By Product Type
- Introduction / Key Findings
- Historical Market Size Value (USD Million) Analysis By Product Type, 2021 to 2025
- Current and Future Market Size Value (USD Million) Analysis and Forecast By Product Type, 2026 to 2036
- oral medication
- solid medication
- capsules
- tablets
- mixtures
- lollipops
- lozenges
- liquid medication
- syrup
- solution
- emulsion
- topical medication
- gels
- ointments
- creams
- lotions
- injectable
- mouthwashes
- nasal
- ocular
- otic
- suppositories
- enemas
- oral medication
- Y-o-Y Growth Trend Analysis By Product Type, 2021 to 2025
- Absolute $ Opportunity Analysis By Product Type, 2026 to 2036
- Global Market Analysis 2021 to 2025 and Forecast 2026 to 2036, By Pharmacy type
- Introduction / Key Findings
- Historical Market Size Value (USD Million) Analysis By Pharmacy type, 2021 to 2025
- Current and Future Market Size Value (USD Million) Analysis and Forecast By Pharmacy type, 2026 to 2036
- 503A Pharmacies
- Traditional Compounding
- Patient-specific Prescriptions
- Local Pharmacies
- Small-scale Operations
- Customized Medications
- Community Pharmacies
- 503B Outsourcing Facilities
- Large-scale Compounding
- Batch Production
- Hospital Supply
- Registered Facilities
- FDA-regulated
- 503A Pharmacies
- Y-o-Y Growth Trend Analysis By Pharmacy type, 2021 to 2025
- Absolute $ Opportunity Analysis By Pharmacy type, 2026 to 2036
- Global Market Analysis 2021 to 2025 and Forecast 2026 to 2036, By Therapeutic Area
- Introduction / Key Findings
- Historical Market Size Value (USD Million) Analysis By Therapeutic Area, 2021 to 2025
- Current and Future Market Size Value (USD Million) Analysis and Forecast By Therapeutic Area, 2026 to 2036
- Pain Management
- Chronic Pain
- Neuropathic Pain
- Arthritis
- Acute Pain
- Post-surgical Pain
- Injury-related Pain
- Hormone Replacement Therapy (HRT)
- Menopause Treatment
- Estrogen Therapy
- Progesterone Therapy
- Testosterone Therapy
- Male Hormone Deficiency
- Dermatology
- Skin Disorders
- Acne
- Psoriasis
- Aesthetic Treatments
- Anti-aging
- Pediatrics
- Pediatric Formulations
- Flavored Medicines
- Dose Customization
- Special Needs
- Allergy-free Formulations
- Veterinary Medicine
- Pet Medications
- Flavored Drugs
- Custom Dosages
- Livestock Treatments
- Farm Animals
- Pain Management
- Y-o-Y Growth Trend Analysis By Therapeutic Area, 2021 to 2025
- Absolute $ Opportunity Analysis By Therapeutic Area, 2026 to 2036
- Global Market Analysis 2021 to 2025 and Forecast 2026 to 2036, By Application
- Introduction / Key Findings
- Historical Market Size Value (USD Million) Analysis By Application, 2021 to 2025
- Current and Future Market Size Value (USD Million) Analysis and Forecast By Application, 2026 to 2036
- adults
- pediatrics
- geriatrics
- veterinary
- adults
- Y-o-Y Growth Trend Analysis By Application, 2021 to 2025
- Absolute $ Opportunity Analysis By Application, 2026 to 2036
- Global Market Analysis 2021 to 2025 and Forecast 2026 to 2036, By End User
- Introduction / Key Findings
- Historical Market Size Value (USD Million) Analysis By End User, 2021 to 2025
- Current and Future Market Size Value (USD Million) Analysis and Forecast By End User, 2026 to 2036
- Hospitals
- Inpatient Pharmacy
- Critical Care
- Surgical Value (USD Million)s
- Outpatient Pharmacy
- Routine Prescriptions
- Follow-up Care
- Clinics
- Specialty Clinics
- Pain Clinics
- Dermatology Clinics
- General Clinics
- Primary Care
- Homecare Settings
- Personal Use
- Chronic Therapy
- Long-term Medication
- Elderly Care
- Customized Dosages
- Veterinary Clinics
- Pet Clinics
- Compounded Drugs
- Custom Formulations
- Animal Hospitals
- Large Animal Care
- Hospitals
- Y-o-Y Growth Trend Analysis By End User, 2021 to 2025
- Absolute $ Opportunity Analysis By End User, 2026 to 2036
- Global Market Analysis 2021 to 2025 and Forecast 2026 to 2036, By Region
- Introduction
- Historical Market Size Value (USD Million) Analysis By Region, 2021 to 2025
- Current Market Size Value (USD Million) Analysis and Forecast By Region, 2026 to 2036
- North America
- Latin America
- Western Europe
- Eastern Europe
- East Asia
- South Asia and Pacific
- Middle East & Africa
- Market Attractiveness Analysis By Region
- North America Market Analysis 2021 to 2025 and Forecast 2026 to 2036, By Country
- Historical Market Size Value (USD Million) Trend Analysis By Market Taxonomy, 2021 to 2025
- Market Size Value (USD Million) Forecast By Market Taxonomy, 2026 to 2036
- By Country
- USA
- Canada
- Mexico
- By Product Type
- By Pharmacy type
- By Therapeutic Area
- By Application
- By End User
- By Country
- Market Attractiveness Analysis
- By Country
- By Product Type
- By Pharmacy type
- By Therapeutic Area
- By Application
- By End User
- Key Takeaways
- Latin America Market Analysis 2021 to 2025 and Forecast 2026 to 2036, By Country
- Historical Market Size Value (USD Million) Trend Analysis By Market Taxonomy, 2021 to 2025
- Market Size Value (USD Million) Forecast By Market Taxonomy, 2026 to 2036
- By Country
- Brazil
- Chile
- Rest of Latin America
- By Product Type
- By Pharmacy type
- By Therapeutic Area
- By Application
- By End User
- By Country
- Market Attractiveness Analysis
- By Country
- By Product Type
- By Pharmacy type
- By Therapeutic Area
- By Application
- By End User
- Key Takeaways
- Western Europe Market Analysis 2021 to 2025 and Forecast 2026 to 2036, By Country
- Historical Market Size Value (USD Million) Trend Analysis By Market Taxonomy, 2021 to 2025
- Market Size Value (USD Million) Forecast By Market Taxonomy, 2026 to 2036
- By Country
- Germany
- UK
- Italy
- Spain
- France
- Nordic
- BENELUX
- Rest of Western Europe
- By Product Type
- By Pharmacy type
- By Therapeutic Area
- By Application
- By End User
- By Country
- Market Attractiveness Analysis
- By Country
- By Product Type
- By Pharmacy type
- By Therapeutic Area
- By Application
- By End User
- Key Takeaways
- Eastern Europe Market Analysis 2021 to 2025 and Forecast 2026 to 2036, By Country
- Historical Market Size Value (USD Million) Trend Analysis By Market Taxonomy, 2021 to 2025
- Market Size Value (USD Million) Forecast By Market Taxonomy, 2026 to 2036
- By Country
- Russia
- Poland
- Hungary
- Balkan & Baltic
- Rest of Eastern Europe
- By Product Type
- By Pharmacy type
- By Therapeutic Area
- By Application
- By End User
- By Country
- Market Attractiveness Analysis
- By Country
- By Product Type
- By Pharmacy type
- By Therapeutic Area
- By Application
- By End User
- Key Takeaways
- East Asia Market Analysis 2021 to 2025 and Forecast 2026 to 2036, By Country
- Historical Market Size Value (USD Million) Trend Analysis By Market Taxonomy, 2021 to 2025
- Market Size Value (USD Million) Forecast By Market Taxonomy, 2026 to 2036
- By Country
- China
- Japan
- South Korea
- By Product Type
- By Pharmacy type
- By Therapeutic Area
- By Application
- By End User
- By Country
- Market Attractiveness Analysis
- By Country
- By Product Type
- By Pharmacy type
- By Therapeutic Area
- By Application
- By End User
- Key Takeaways
- South Asia and Pacific Market Analysis 2021 to 2025 and Forecast 2026 to 2036, By Country
- Historical Market Size Value (USD Million) Trend Analysis By Market Taxonomy, 2021 to 2025
- Market Size Value (USD Million) Forecast By Market Taxonomy, 2026 to 2036
- By Country
- India
- ASEAN
- Australia & New Zealand
- Rest of South Asia and Pacific
- By Product Type
- By Pharmacy type
- By Therapeutic Area
- By Application
- By End User
- By Country
- Market Attractiveness Analysis
- By Country
- By Product Type
- By Pharmacy type
- By Therapeutic Area
- By Application
- By End User
- Key Takeaways
- Middle East & Africa Market Analysis 2021 to 2025 and Forecast 2026 to 2036, By Country
- Historical Market Size Value (USD Million) Trend Analysis By Market Taxonomy, 2021 to 2025
- Market Size Value (USD Million) Forecast By Market Taxonomy, 2026 to 2036
- By Country
- Kingdom of Saudi Arabia
- Other GCC Countries
- Turkiye
- South Africa
- Other African Union
- Rest of Middle East & Africa
- By Product Type
- By Pharmacy type
- By Therapeutic Area
- By Application
- By End User
- By Country
- Market Attractiveness Analysis
- By Country
- By Product Type
- By Pharmacy type
- By Therapeutic Area
- By Application
- By End User
- Key Takeaways
- Key Countries Market Analysis
- USA
- Pricing Analysis
- Market Share Analysis, 2025
- By Product Type
- By Pharmacy type
- By Therapeutic Area
- By Application
- By End User
- Canada
- Pricing Analysis
- Market Share Analysis, 2025
- By Product Type
- By Pharmacy type
- By Therapeutic Area
- By Application
- By End User
- Mexico
- Pricing Analysis
- Market Share Analysis, 2025
- By Product Type
- By Pharmacy type
- By Therapeutic Area
- By Application
- By End User
- Brazil
- Pricing Analysis
- Market Share Analysis, 2025
- By Product Type
- By Pharmacy type
- By Therapeutic Area
- By Application
- By End User
- Chile
- Pricing Analysis
- Market Share Analysis, 2025
- By Product Type
- By Pharmacy type
- By Therapeutic Area
- By Application
- By End User
- Germany
- Pricing Analysis
- Market Share Analysis, 2025
- By Product Type
- By Pharmacy type
- By Therapeutic Area
- By Application
- By End User
- UK
- Pricing Analysis
- Market Share Analysis, 2025
- By Product Type
- By Pharmacy type
- By Therapeutic Area
- By Application
- By End User
- Italy
- Pricing Analysis
- Market Share Analysis, 2025
- By Product Type
- By Pharmacy type
- By Therapeutic Area
- By Application
- By End User
- Spain
- Pricing Analysis
- Market Share Analysis, 2025
- By Product Type
- By Pharmacy type
- By Therapeutic Area
- By Application
- By End User
- France
- Pricing Analysis
- Market Share Analysis, 2025
- By Product Type
- By Pharmacy type
- By Therapeutic Area
- By Application
- By End User
- India
- Pricing Analysis
- Market Share Analysis, 2025
- By Product Type
- By Pharmacy type
- By Therapeutic Area
- By Application
- By End User
- ASEAN
- Pricing Analysis
- Market Share Analysis, 2025
- By Product Type
- By Pharmacy type
- By Therapeutic Area
- By Application
- By End User
- Australia & New Zealand
- Pricing Analysis
- Market Share Analysis, 2025
- By Product Type
- By Pharmacy type
- By Therapeutic Area
- By Application
- By End User
- China
- Pricing Analysis
- Market Share Analysis, 2025
- By Product Type
- By Pharmacy type
- By Therapeutic Area
- By Application
- By End User
- Japan
- Pricing Analysis
- Market Share Analysis, 2025
- By Product Type
- By Pharmacy type
- By Therapeutic Area
- By Application
- By End User
- South Korea
- Pricing Analysis
- Market Share Analysis, 2025
- By Product Type
- By Pharmacy type
- By Therapeutic Area
- By Application
- By End User
- Russia
- Pricing Analysis
- Market Share Analysis, 2025
- By Product Type
- By Pharmacy type
- By Therapeutic Area
- By Application
- By End User
- Poland
- Pricing Analysis
- Market Share Analysis, 2025
- By Product Type
- By Pharmacy type
- By Therapeutic Area
- By Application
- By End User
- Hungary
- Pricing Analysis
- Market Share Analysis, 2025
- By Product Type
- By Pharmacy type
- By Therapeutic Area
- By Application
- By End User
- Kingdom of Saudi Arabia
- Pricing Analysis
- Market Share Analysis, 2025
- By Product Type
- By Pharmacy type
- By Therapeutic Area
- By Application
- By End User
- Turkiye
- Pricing Analysis
- Market Share Analysis, 2025
- By Product Type
- By Pharmacy type
- By Therapeutic Area
- By Application
- By End User
- South Africa
- Pricing Analysis
- Market Share Analysis, 2025
- By Product Type
- By Pharmacy type
- By Therapeutic Area
- By Application
- By End User
- USA
- Market Structure Analysis
- Competition Dashboard
- Competition Benchmarking
- Market Share Analysis of Top Players
- By Regional
- By Product Type
- By Pharmacy type
- By Therapeutic Area
- By Application
- By End User
- Competition Analysis
- Competition Deep Dive
- Fagron N.V.
- Overview
- Product Portfolio
- Profitability by Market Segments (Product/Age /Sales Channel/Region)
- Sales Footprint
- Strategy Overview
- Marketing Strategy
- Product Strategy
- Channel Strategy
- Avella Specialty Pharmacy
- Central Admixture Pharmacy Services Inc
- Hoye's Pharmacy
- Vertisis Custom Pharmacy
- Smith Caldwell Drug Store
- Sixth Avenue Medical Pharmacy
- Cantrell Drug Company
- Clinigen Group
- Dougherty's Pharmacy
- Fagron N.V.
- Competition Deep Dive
- Assumptions & Acronyms Used


