

- Market Size (2026)
- USD 2860.7 Mn
- Forecast (2036)
- USD 6408.6 Mn
- CAGR (2026 to 2036)
- 8.4%
How big is the Wet Chemical Station Market?
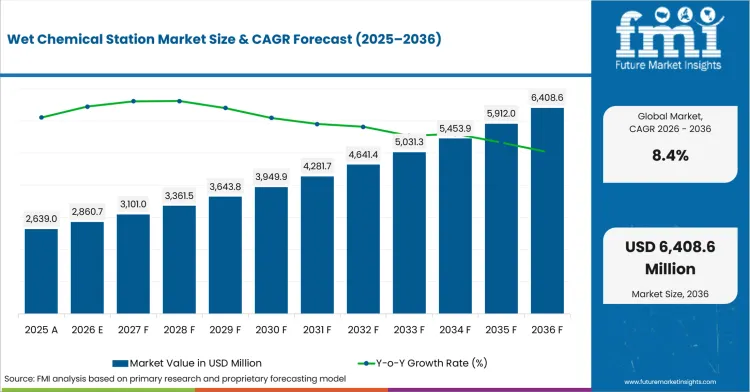
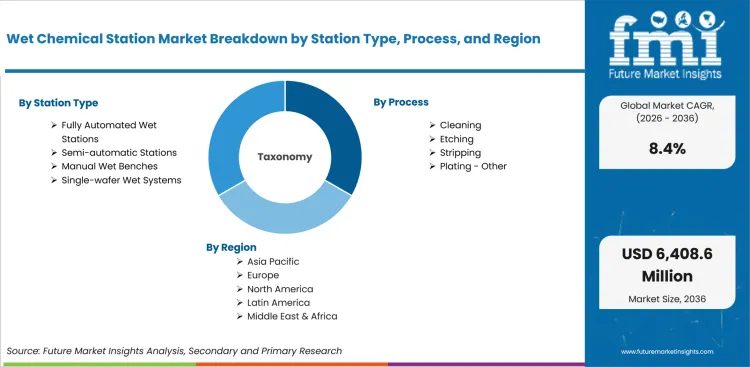
The Wet Chemical Station Market is projected to grow from USD 2860.7 million in 2026 to USD 6408.6 million by 2036, at a CAGR of 8.4%.
The Wet Chemical Station Market was valued at USD 2,639.02 million in 2025 and is expected to reach USD 2860.7 million in 2026. The market is forecast to reach USD 6408.6 million by 2036 at a CAGR of 8.4% from 2026 to 2036. Fully Automated Wet Stations are projected to account for a 37.5% share in 2026, while Cleaning is expected to hold a 44.0% share by process.
In February 2024, TSMC said JASM would expand in Kumamoto and total investment across the Japanese venture would exceed USD 20 billion. This supports wet process tool demand in Japan. In February 2024, India approved Tata Electronics’ Dholera fab with 50,000 wafer starts per month capacity. The project creates first-wave demand for wet stations and fab facility systems.
The market is moving from lab-style wet benches toward controlled wet stations that reduce chemical waste and improve repeatability.
| Metric | Value |
|---|---|
| 2025 Market Size | USD 2,639.02 million |
| 2026 Market Size | USD 2,860.7 million |
| 2036 Market Size | USD 6,408.6 million |
| Forecast CAGR (2026-2036) | 8.4% |
| Leading Station Type | Fully Automated Wet Stations |
| Fully Automated Wet Stations Share (2026) | 37.5% |
| Leading Process | Cleaning |
| Cleaning Share (2026) | 44.0% |
| Fastest-growing Country | India |
| India CAGR by 2036 | 10.2% |
Summary of the Wet Chemical Station Market
| Market Signal | Commercial Impact |
|---|---|
| Demand and Growth Drivers | Demand for semiconductor wet chemical stations is increasing as advanced wafer fabrication requires higher cleaning precision, improved chemical management, and automated wafer handling.
|
| Product and Segment View | Fully automated wet stations, cleaning applications, and semiconductor fabrication continue to represent the leading commercial opportunities across the market.
|
| Geography and Growth Outlook | Asia and Europe continue to drive market expansion through semiconductor fabrication investments, advanced manufacturing projects, and domestic chip production initiatives.
|
| Competitive Landscape | Competition increasingly focuses on process uniformity, chemical reduction, automation, and advanced wafer cleaning performance.
|
| Analyst Perspective | Semiconductor wet chemical stations are evolving from conventional process equipment into critical manufacturing platforms that improve yield, process consistency, and chemical efficiency.
- Sudip saha, Principal Consultant at Future Market Insights |
Why is the Wet Chemical Station Market growing?
New 300mm fabs need wet process stations before high-volume wafer starts can qualify. Advanced cleaning steps expand as smaller geometries reduce tolerance for particles and residues.
- New 300mm fabs need wet process stations before high-volume wafer starts can qualify.
- Advanced cleaning steps expand as smaller geometries reduce tolerance for particles and residues.
- Chemical reduction is moving into purchase decisions as acid use affects cost and waste treatment.
New fab construction creates the first demand wave for wet chemical stations since stations must be installed before process recipes are qualified. SEMI said in January 2025 that 18 new fab construction projects were expected to start in 2025, including three 200mm and fifteen 300mm facilities. This supports demand for both large automated stations and smaller specialty benches. Buyers plan wet stations early since exhaust, drains, chemical compatibility and cleanroom placement affect facility design. Tool suppliers with layout support and local startup teams have an advantage before price discussions begin. The second driver is process intensity inside existing fabs as cleaning becomes more selective and more costly.
How is the Wet Chemical Station Market segmented?
The Wet Chemical Station Market is segmented by station type, process, end use, material, sales channel, and region.
- With an estimated 37.5% share in 2026, Fully Automated Wet Stations is expected to lead the station type category because fabs reduce manual wafer movement.
- Cleaning is projected to account for 44.0% of process demand in 2026 given its role after etch, strip and CMP steps.
- Semiconductor Fabs are anticipated to represent 70.0% of end-use demand in 2026 with a large budgets for qualified wet process tools.
How does Fully Automated Wet Stations contribute to the station type category?
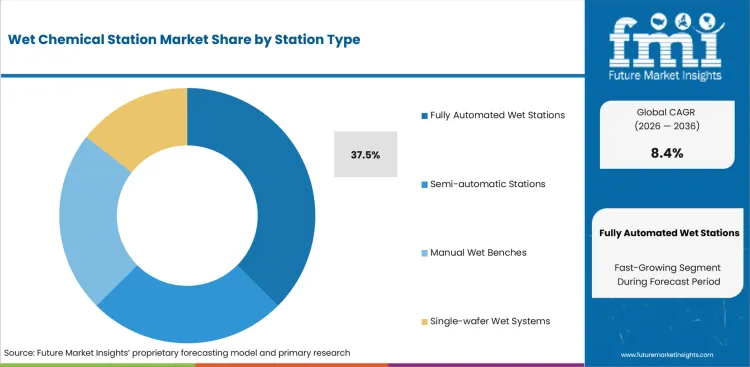
- Fully Automated Wet Stations are projected to account for a 37.5% share in 2026 as 300mm fabs need robotics, recipe control and safer acid handling inside controlled cleanroom layouts.
- Automation changes the service model since buyers inspect robot uptime, SECS/GEM links and chemical exhaust control before accepting the final tool at the fab.
What supports demand for Cleaning?
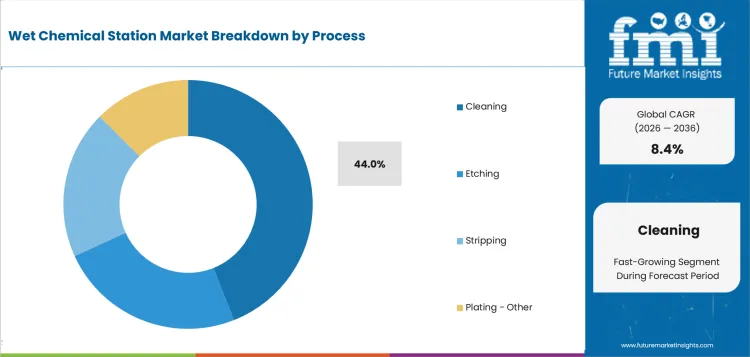
- Cleaning is expected to hold a 44.0% share in 2026 as wafer surfaces need particle and residue control before deposition, lithography and metrology steps.
- Cleaning systems carry a hidden cost test since sulfuric peroxide mix use affects chemical buying, waste treatment and facility permits across high-volume fabs.
How do buyers evaluate Semiconductor Fabs within the end use category?
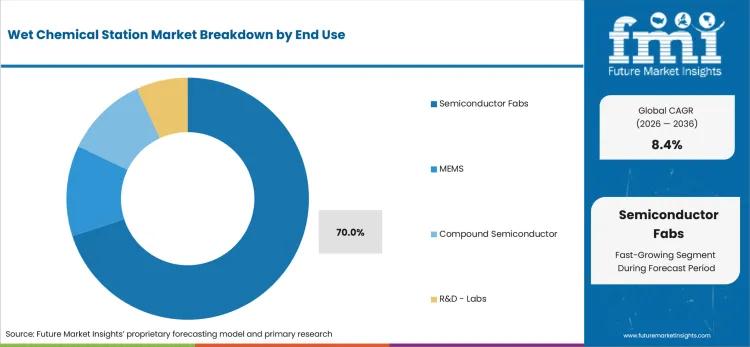
- Semiconductor Fabs are anticipated to represent a 70.0% share in 2026 as front-end production sites buy a large number of qualified wet process tools.
- Fab buyers often freeze tool choices before facility startup since drain layout, exhaust routing and chemical supply lines must match the wet station design.
What market factors influence demand for PP / PVDF?
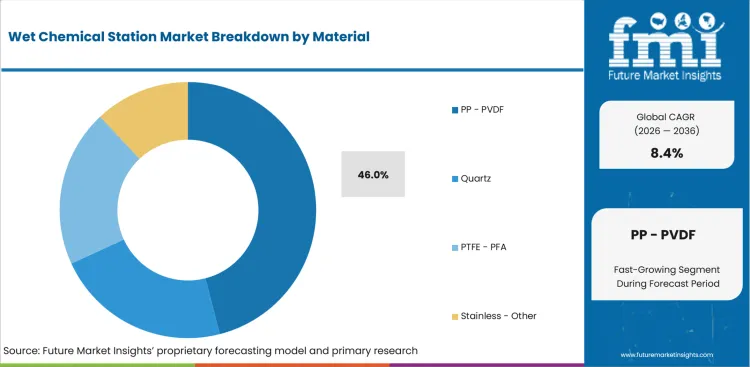
- PP / PVDF is estimated to hold a 46.0% share in 2026 as polymer construction balances acid resistance, fabrication cost and cleanroom repair access.
- Quartz and PTFE / PFA serve harsher or cleaner chemistries, but PP / PVDF keeps price advantage in many acid bench and rinse station builds.
How does Direct OEM affect the sales channel outlook?
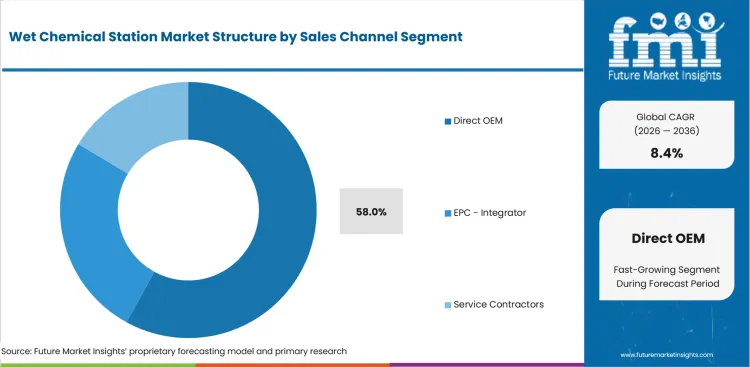
- Direct OEM is projected to account for a 58.0% share in 2026 as large fabs prefer direct qualification, warranty control and recipe support from tool makers.
- EPC and integrator routes work well for facility tie-ins, while service contractors win recurring work in exhaust, drain and chemical safety modifications.
What drives and restrains the market?
Driver: Fab localization programs create station demand as new cleanrooms need qualified wet benches before wafer starts; restraint: Long qualification cycles restrain new entrants as fabs avoid unproven wet process platforms; opportunity: specialty wafers create opportunity for semi-automatic stations serving MEMS and compound semiconductor lines.
The market reflects a balance between the identified demand driver, adoption constraints, and the supplier opportunity outlined below.
- Driver: Fab localization programs create station demand as new cleanrooms need qualified wet benches before wafer starts.
- Restraint: Long qualification cycles restrain new entrants as fabs avoid unproven wet process platforms.
- Opportunity: specialty wafers create opportunity for semi-automatic stations serving MEMS and compound semiconductor lines.
Chemical Use Reduction: Chemical use reduction is becoming a core purchase filter in wet process tools. ACM Research states that its Ultra C Tahoe combines batch and single-wafer cleaning and can cut sulfuric acid consumption by up to 75%. That figure changes the tool discussion from purchase price to operating cost and waste handling. Fabs running SPM processes face acid buying, disposal cost and local environmental review. A station that lowers chemical load without losing particle performance can justify a higher capital price.
Single-Wafer Process Control: Single-wafer wet systems are gaining attention where each wafer needs tight process tracking. SCREEN says its SU-3400 single-wafer cleaner can reach throughput of up to 1,200 wafers per hour through robot and chamber layout changes. That shows why advanced fabs no longer treat single-wafer cleaning as only a low-throughput option. The practical gain is better traceability and recipe control with productivity closer to batch systems. Buyers will compare particle removal, drying risk and chamber count before accepting a tool for advanced production. Qualification Cycle Risk: Qualification time is the main restraint for smaller wet station suppliers.
Which factors support expansion?
Commercial expansion is reinforced by the value, workflow, and recurring-demand factors below.
- Fab tool budgets are rising as 300mm projects add cleaning and etching modules before process qualification can start.
- Chemical cost is becoming a buying filter as SPM and HF processes carry waste treatment and safety costs.
- Automated stations gain preference as fabs limit manual wafer handling and reduce operator exposure to acids and solvents.
Which country markets are included in the CAGR comparison?
The selected CAGR comparison covers India (10.2%), China (9.1%), Japan (8.8%), Germany (8.7%), and South Korea (8.6%) through 2036.
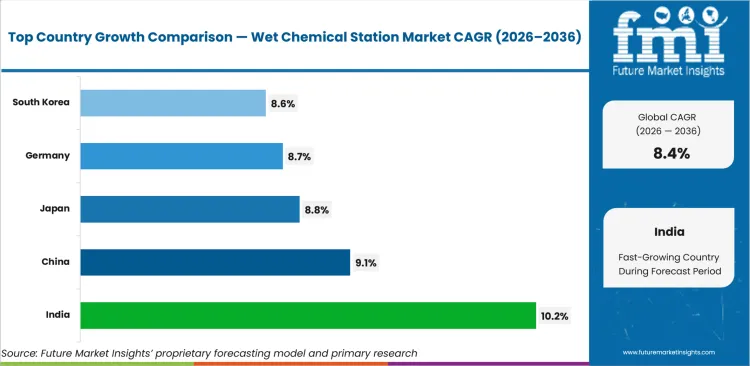
| Country | CAGR |
|---|---|
| India | 10.2% |
| China | 9.1% |
| Japan | 8.8% |
| Germany | 8.7% |
| South Korea | 8.6% |
Source: Future Market Insights analysis.
How do country-level CAGRs compare?
- India (CAGR: 10.2%): First-generation fabs and OSAT projects create early wet station demand.
- China (CAGR: 9.1%): China remains a major buyer of semiconductor manufacturing equipment.
- Japan (CAGR: 8.8%): Kumamoto and Hokkaido projects support new process tool demand.
- Germany (CAGR: 8.7%): Dresden is expanding as a major European semiconductor manufacturing hub.
- South Korea (CAGR: 8.6%): Memory and foundry fabs create high-volume wet station demand.
The global Wet Chemical Station Market is forecast to record a CAGR of 8.4% from 2026 to 2036. The study covers 30+ countries across the report regions.
How is the Wet Chemical Station Market developing in India?
India is projected to record a CAGR of 10.2% through 2036. The country outlook identifies this demand signal: First-generation fabs and OSAT projects create early wet station demand.
Country Market Snapshot
| Country | India |
|---|---|
| Forecast CAGR | 10.2% |
| Demand anchor | First-generation fabs and OSAT projects create early wet station demand. |
| Proof point | India approved a Tata Electronics fab with 50,000 wafer starts per month capacity in February 2024. |
| Policy context | India Semiconductor Mission supports fab, packaging and design projects. |
| Procurement route | New fabs rely on technology partners and global OEM qualification. |
| Application mix | Mature-node logic, power management and display driver chips shape early demand. |
| Restraint | India has limited local wet process service depth compared with East Asia. |
| Company context | Companies active in or serving this market include SCREEN Semiconductor Solutions, Tokyo Electron, Lam Research, ACM Research, and Applied Materials. |
Market Outlook
India is projected to record a 10.2% CAGR through 2036 as local wafer manufacturing starts from a small base. India’s Press Information Bureau said in February 2024 that Tata Electronics would build a Dholera fab with 50,000 wafer starts per month capacity. That project creates direct demand for wet stations and related facility systems. The first wave of orders will likely follow technology partner standards rather than local supplier selection.
Key Growth Drivers
- Dholera and other approved projects create first-cycle wafer fab equipment demand.
- Government-backed semiconductor programs improve visibility for tool vendors.
- Local OSAT and display driver projects expand wet process support needs.
- First-generation fabs and OSAT projects create early wet station demand.
Key Restraints
- Limited local service talent can raise startup and maintenance risk.
- Early fab projects may depend heavily on foreign technology partners.
- India has limited local wet process service depth compared with East Asia.
Country Market FAQs
What should C-suite teams prioritize in India?
C-suite teams should prioritize qualification requirements, procurement routes, local service coverage, and implementation economics before committing capital or supplier volume.
How should suppliers approach the India market?
Suppliers should align technical evidence, local channel support, and account-specific commercial terms with the buying process used by major customers in India.
What can weaken the business case in India?
India has limited local wet process service depth compared with East Asia. Executives should test this exposure during supplier, investment, and rollout reviews.
How is the Wet Chemical Station Market developing in China?
China is projected to record a CAGR of 9.1% through 2036. The country outlook identifies this demand signal: China remains a major buyer of semiconductor manufacturing equipment.
Country Market Snapshot
| Country | China |
|---|---|
| Forecast CAGR | 9.1% |
| Demand anchor | China remains a major buyer of semiconductor manufacturing equipment. |
| Proof point | Silverado Policy Accelerator reported China’s semiconductor manufacturing equipment imports reached USD 51.1 billion in 2025. |
| Supply trend | Local suppliers compete harder in cleaning and wet bench categories. |
| Procurement behavior | Domestic fabs balance imported tools with localization targets. |
| Application mix | Mature-node logic, memory and power devices support broad wet station demand. |
| Restraint | Export controls can limit access to some advanced tool platforms. |
| Company context | Companies active in or serving this market include ACM Research, NAURA Technology Group, Kingsemi, SCREEN Semiconductor Solutions, and Tokyo Electron. |
Market Outlook
China is forecast to grow at a CAGR of 9.1% through 2036 as large fab spending and tool localization shape wet station purchases. Silverado Policy Accelerator reported in February 2026 that China’s semiconductor manufacturing equipment imports reached USD 51.1 billion in 2025, up 4% from 2024. This shows the scale of equipment demand despite rising domestic supply efforts. Wet chemical stations benefit from both imported advanced tools and local wet bench production.
Key Growth Drivers
- Large 300mm and mature-node fab programs support wet station orders.
- Domestic substitution targets increase interest in local wet process suppliers.
- Power and analog device output creates steady cleaning and etching demand.
- China remains a major buyer of semiconductor manufacturing equipment.
Key Restraints
- Export controls can limit some advanced station components and recipes.
- Buyer pressure on price can reduce margins for local suppliers.
- Export controls can slow access to some advanced systems, which creates openings for domestic wet process vendors.
Country Market FAQs
What should C-suite teams prioritize in China?
C-suite teams should prioritize qualification requirements, procurement routes, local service coverage, and implementation economics before committing capital or supplier volume.
How should suppliers approach the China market?
Suppliers should align technical evidence, local channel support, and account-specific commercial terms with the buying process used by major customers in China.
What can weaken the business case in China?
Export controls can limit access to some advanced tool platforms. Executives should test this exposure during supplier, investment, and rollout reviews.
How is the Wet Chemical Station Market developing in Japan?
Japan is projected to record a CAGR of 8.8% through 2036. The country outlook identifies this demand signal: Kumamoto and Hokkaido projects support new process tool demand.
Country Market Snapshot
| Country | Japan |
|---|---|
| Forecast CAGR | 8.8% |
| Demand anchor | Kumamoto and Hokkaido projects support new process tool demand. |
| Company context | Companies active in or serving this market include SCREEN Holdings, Tokyo Electron, Kokusai Electric, Shibaura Mechatronics, and RENA Technologies. |
| Proof point | Rapidus secured JPY 267.6 billion in February 2026 from government and private investors. |
| Application mix | Logic, image sensors and specialty devices drive diverse wet station needs. |
| Channel route | Direct OEM relationships dominate advanced fab qualification. |
| Restraint | Advanced-node tools require strict proof of defect control and drying performance. |
| Executive implication | Executive teams should compare qualification requirements, local service depth, and total implementation economics before selecting suppliers. |
Market Outlook
Japan is projected to grow at a CAGR of 8.8% through 2036 as domestic fab renewal and supplier strength reinforce wet station demand. Rapidus announced in February 2026 that it secured JPY 267.6 billion from the Japan government and private companies to progress toward 2nm mass production by 2027. This type of project increases demand for advanced cleaning and surface preparation tools. Japan’s market is unusual because it contains both strong buyers and established equipment suppliers.
Key Growth Drivers
- Rapidus and JASM projects lift demand for advanced wet process tools.
- SCREEN and Tokyo Electron give local fabs strong access to wet cleaning expertise.
- Image sensor and logic manufacturing supports both 200mm and 300mm wet station demand.
- Kumamoto and Hokkaido projects support new process tool demand.
Key Restraints
- Advanced process qualification can slow supplier switching.
- High expectations for uptime and process proof create barriers for new suppliers.
- Advanced-node tools require strict proof of defect control and drying performance.
Country Market FAQs
What should C-suite teams prioritize in Japan?
C-suite teams should prioritize qualification requirements, procurement routes, local service coverage, and implementation economics before committing capital or supplier volume.
How should suppliers approach the Japan market?
Suppliers should align technical evidence, local channel support, and account-specific commercial terms with the buying process used by major customers in Japan.
What can weaken the business case in Japan?
Advanced-node tools require strict proof of defect control and drying performance. Executives should test this exposure during supplier, investment, and rollout reviews.
How is the Wet Chemical Station Market developing in Germany?
Germany is projected to record a CAGR of 8.7% through 2036. The country outlook identifies this demand signal: Dresden is expanding as a major European semiconductor manufacturing hub.
Country Market Snapshot
| Country | Germany |
|---|---|
| Forecast CAGR | 8.7% |
| Demand anchor | Dresden is expanding as a major European semiconductor manufacturing hub. |
| Policy signal | The European Commission approved EUR 5 billion of German aid for ESMC. |
| Buyer type | Automotive and industrial chip customers shape mature-node wet process needs. |
| Supply base | RENA Technologies and AP&S International give Germany local wet process depth. |
| Channel route | Direct OEM sales are often paired with facility and automation integrators. |
| Restraint | Energy and construction costs can affect fab schedules and tool timing. |
| Company context | Companies active in or serving this market include RENA Technologies, AP&S International, SÜSS MicroTec, Sempa Systems, and PVA TePla. |
Market Outlook
Germany is forecast to grow at a CAGR of 8.7% through 2036 as Dresden fab investment strengthens European demand for wet chemical stations. The European Commission approved EUR 5 billion in German aid in August 2024 to support ESMC’s new Dresden semiconductor plant. This project matters for wet stations since automotive and industrial chips still need cleaning, etching and stripping steps in high-volume flows. German buyers place high weight on engineering documentation and automation integration.
Key Growth Drivers
- Dresden’s ESMC project lifts demand for mature-node and specialty wet process tools.
- German automotive semiconductor needs support cleaning and etching station purchases.
- Local wet process OEMs shorten engineering and service response times.
- Dresden is expanding as a major European semiconductor manufacturing hub.
Key Restraints
- High energy and facility costs can slow fab ramp timing.
- Strict safety reviews lengthen wet chemistry installation approvals.
- Energy and construction costs can affect fab schedules and tool timing.
Country Market FAQs
What should C-suite teams prioritize in Germany?
C-suite teams should prioritize qualification requirements, procurement routes, local service coverage, and implementation economics before committing capital or supplier volume.
How should suppliers approach the Germany market?
Suppliers should align technical evidence, local channel support, and account-specific commercial terms with the buying process used by major customers in Germany.
What can weaken the business case in Germany?
Energy and construction costs can affect fab schedules and tool timing. Executives should test this exposure during supplier, investment, and rollout reviews.
How is the Wet Chemical Station Market developing in South Korea?
South Korea is projected to record a CAGR of 8.6% through 2036. The country outlook identifies this demand signal: Memory and foundry fabs create high-volume wet station demand.
Country Market Snapshot
| Country | South Korea |
|---|---|
| Forecast CAGR | 8.6% |
| Demand anchor | Memory and foundry fabs create high-volume wet station demand. |
| Policy proof | South Korea announced a KRW 622 trillion semiconductor cluster plan in January 2024. |
| Buyer structure | Samsung Electronics and SK Hynix shape most high-volume tool buying behavior. |
| Application mix | DRAM, NAND, HBM and foundry processes need advanced cleaning steps. |
| Channel route | Direct OEM qualification dominates supplier access. |
| Restraint | High buyer concentration limits access for smaller wet station vendors. |
| Company context | Companies active in or serving this market include SEMES, PSK, DMS Co., Ltd., SCREEN Semiconductor Solutions, and Lam Research. |
Market Outlook
South Korea is expected to record a CAGR of 8.6% through 2036 as memory and foundry capacity keep wet process tools in high-volume demand. South Korea’s science ministry said in January 2024 that the planned mega cluster involved KRW 622 trillion of fab investment. That scale supports demand for automated stations and single-wafer cleaning systems across memory and logic fabs. Korean buyers are technically demanding and concentrated. Suppliers must prove uptime, particle performance and support speed for high-volume lines.
Key Growth Drivers
- Memory and HBM output supports large-scale wet cleaning demand.
- Mega-cluster spending strengthens demand for station fleets and service contracts.
- Foundry expansion creates process variety beyond memory-only cleaning requirements.
- Memory and foundry fabs create high-volume wet station demand.
Key Restraints
- A small number of large buyers control a large share of advanced tool access.
- Qualification cycles can be strict for suppliers without Korean fab references.
- High buyer concentration limits access for smaller wet station vendors.
Country Market FAQs
What should C-suite teams prioritize in South Korea?
C-suite teams should prioritize qualification requirements, procurement routes, local service coverage, and implementation economics before committing capital or supplier volume.
How should suppliers approach the South Korea market?
Suppliers should align technical evidence, local channel support, and account-specific commercial terms with the buying process used by major customers in South Korea.
What can weaken the business case in South Korea?
High buyer concentration limits access for smaller wet station vendors. Executives should test this exposure during supplier, investment, and rollout reviews.
Which companies are discussed in the Wet Chemical Station Market?
The preview discusses SCREEN Holdings, Tokyo Electron, Lam Research, ACM Research, and Modutek among the companies active in this market.
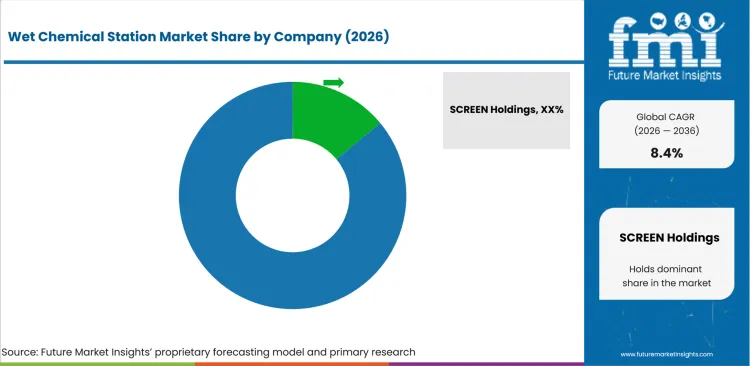
The market is moderately concentrated since advanced fabs qualify only proven wet process suppliers. SCREEN and Tokyo Electron stand out in single-wafer cleaning depth and high-volume fab relationships. ACM Research competes through hybrid cleaning architecture and reduced SPM chemical consumption.
RENA Technologies and AP&S International compete in batch, specialty and European wet process systems. Entry barriers are high as process qualification, service reach and chemical safety proof take years. Established wet station suppliers compete on process proof rather than catalog breadth.
How is competition structured?
Competition reflects differences in specialization, portfolio scope, geographic reach, evidence, and customer access.
The competitive structure is best understood by supplier role, since wet stations serve production fabs, specialty lines and research cleanrooms.
- Advanced Fab Wet Cleaning Leaders: SCREEN Holdings, Tokyo Electron, Lam Research and ACM Research serve advanced fab buyers through single-wafer cleaning, wet clean and wet etch platforms.
- Batch and Specialty Wet Process Specialists: RENA Technologies and AP&S International compete where customers need batch immersion, semi-automatic operation and flexible wafer formats. RENA offers manual, semi-automated and fully automated immersion wet benches up to 300mm.
- Custom Bench and Plating-Oriented Suppliers: Modutek and ClassOne Technology serve buyers needing custom benches, lab systems or wet processing tied to plating and advanced microelectronics. Modutek offers wet benches for cleaning, etching, rinsing and wafer treatment.
How do selected companies compare?
The selected companies differ in portfolio focus, geographic reach, evidence depth, and channel strength.
| Company | Competitive position |
|---|---|
| SCREEN Holdings | SCREEN Holdings is assessed for fab qualification, process capability, field service, and regional semiconductor customer support. |
| Tokyo Electron | Tokyo Electron is assessed for fab qualification, process capability, field service, and regional semiconductor customer support. |
| Lam Research | Lam Research is assessed for fab qualification, process capability, field service, and regional semiconductor customer support. |
| ACM Research | ACM Research is assessed for fab qualification, process capability, field service, and regional semiconductor customer support. |
| Modutek | Modutek is assessed for fab qualification, process capability, field service, and regional semiconductor customer support. |
What are the key developments in the Wet Chemical Station Market?
- In November 2024, ACM Research announced a performance breakthrough for its Ultra C Tahoe cleaning tool. The update strengthened its position in advanced wafer-cleaning applications.
- In July 2025, ACM Research announced major upgrades to its Ultra C wb wet-bench cleaning tool. The release expanded process flexibility for semiconductor manufacturers.
- In November 2025, RENA Technologies introduced Vanguard, a single-wafer platform for wet chemical cleaning, etching, and drying of 200 mm and 300 mm wafers. The launch added a direct product-development signal for advanced wet processing.
Selected Companies in the Wet Chemical Station Market
Companies referenced in this preview
- SCREEN Holdings.
- Tokyo Electron.
- Lam Research.
- ACM Research.
- Modutek.
- RENA Technologies.
- AP&S International.
- SEMES.
Market Scope & Definition
| Metric | Value |
|---|---|
| Market definition | Wet chemical stations are controlled process systems used to clean, etch, strip and plate semiconductor wafers with liquid chemicals. The scope includes manual wet benches, semi-automatic stations, fully automated wet stations and single-wafer wet systems. |
| Functions covered | Manual Wet Benches, Semi-automatic Stations, Fully Automated Wet Stations, Single-wafer Wet Systems |
| Applications covered | Cleaning, Etching, Stripping, Plating / Other |
| End-use industries | Semiconductor Fabs, MEMS, Compound Semiconductor, R&D / Labs |
| Inclusions | Market scope covers Manual Wet Benches, Semi-automatic Stations, Fully Automated Wet Stations, Single-wafer Wet Systems, Cleaning, Etching, Stripping, Plating / Other, Semiconductor Fabs, MEMS, Compound Semiconductor, R&D / Labs, PP / PVDF, Quartz, PTFE / PFA, Stainless / Other, Direct OEM, EPC / Integrator and Service Contractors across 30+ countries. |
| Exclusions | Market scope excludes dry etch chambers, CMP polishers, photoresist coaters, standalone chemical cabinets, bulk chemical supply skids, general laboratory fume hoods and flat-panel wet tools not configured for semiconductor wafer processing. |
Research Methodology
| Metric | Value |
|---|---|
| Primary Research | FMI analysts reviewed fab procurement managers, wet process engineers, cleanroom integrators and service contractors. Discussions focused on wafer size, process chemistry, automation level and qualification time. |
| Desk Research | Desk work reviewed semiconductor equipment standards, company product pages, fab incentive announcements and trade association data. Tool scope was cross-checked against wet benches, single-wafer cleaners and automated wet process platforms. |
| Market Sizing and Forecasting | The model combined wet process tool counts, 300mm fab investment signals, specialty wafer activity and average station pricing. Segment shares were adjusted for automation level, process role and end-use mix. |
| Data Validation | Forecasts were checked against fab spending cycles, company wet process portfolios and chemical consumption claims. Country-level growth was cross-checked with semiconductor project activity and local buyer maturity. |
What does the report cover?
The report covers station type, process, end use, material, sales channel, and region across the 2026-2036 forecast period in 30+ countries.
| Metric | Value |
|---|---|
| Periods | Base year 2025; estimated year 2026; forecast period 2026-2036 |
| Segment axes | station type, process, end use, material, sales channel, and region |
| Regions | Global |
| Countries | United States, United Kingdom, Germany, France, Japan, China, South Korea, India and 30+ countries |
| Companies | SCREEN Holdings, Tokyo Electron, Lam Research, ACM Research, Modutek, RENA Technologies, AP&S International, SEMES, and others |
| Approach | Hybrid bottom-up and top-down methodology using tool scope, station pricing, fab investment signals and process adoption rates. |
Market Segmentation Analysis
Segmented by Station Type
- Manual Wet Benches.
- Semi-automatic Stations.
- Fully Automated Wet Stations.
- Single-wafer Wet Systems.
Segmented by Process
- Cleaning.
- Etching.
- Stripping.
- Plating / Other.
Segmented by End Use
- Semiconductor Fabs.
- MEMS.
- Compound Semiconductor.
- R&D / Labs.
Segmented by Material
- PP / PVDF.
- Quartz.
- PTFE / PFA.
- Stainless / Other.
Segmented by Sales Channel
- Direct OEM.
- EPC / Integrator.
- Service Contractors.
By Region
- North America.
- United States.
- Canada.
- Mexico.
- Latin America.
- Brazil.
- Chile.
- Rest of Latin America.
- Western Europe.
- Germany.
- UK.
- Italy.
- Spain.
- France.
- Nordic.
- BENELUX.
- Rest of Western Europe.
- Eastern Europe.
- Russia.
- Poland.
- Hungary.
- Balkan & Baltic.
- Rest of Eastern Europe.
- East Asia.
- China.
- Japan.
- South Korea.
- South Asia and Pacific.
- India.
- ASEAN.
- Australia & New Zealand.
- Rest of South Asia and Pacific.
- Middle East & Africa.
- Kingdom of Saudi Arabia.
- Other GCC Countries.
- Turkiye.
- South Africa.
- Other African Union.
- Rest of Middle East & Africa.
Research Sources and Bibliography
- SEMI. (2025, December 16). Global semiconductor equipment sales projected to reach a record of $156 billion in 2027. SEMI.
- SEMI. (2024, March 19). 300mm fab equipment spending forecast to reach record $137 billion in 2027. SEMI.
- SEMI. (2025, January 7). Eighteen new semiconductor fabs to start construction in 2025. SEMI.
- USA National Institute of Standards and Technology. (2026, June 5). CHIPS for America. NIST.
- UK Government. (2023, May 19). New £1 billion strategy for UK's semiconductor sector. GOV.UK.
- European Commission. (2024, August 20). Commission approves €5 billion German State aid measure to support ESMC in setting up a new semiconductor manufacturing facility. European Commission.
- European Investment Bank. (2024). Project Liberty semiconductor fab. European Investment Bank.
- Rapidus Corporation. (2026, February 27). Rapidus secures 267.6 billion yen in funding from Japan government and private sector companies. Rapidus.
- Taiwan Semiconductor Manufacturing Company. (2024, February 6). JASM set to expand in Kumamoto Japan. TSMC.
- Ministry of Science and ICT of South Korea. (2024, January). Press release on semiconductor mega cluster investment. MSIT.
- Press Information Bureau of India. (2024, February 29). Cabinet approves three more semiconductor units. Government of India.
- Silverado Policy Accelerator. (2026, February 17). China semiconductor manufacturing equipment imports hit record levels in 2025. Silverado Policy Accelerator.
- ACM Research. (2024, November 7). ACM Research announces major performance breakthrough for Ultra C Tahoe cleaning tool. ACM Research.
- ACM Research. (2025, July 24). ACM Research announces major upgrades to its Ultra C wb wet bench cleaning tool. ACM Research.
- RENA Technologies. (2025, November 17). Introducing Vanguard: The new single-wafer cleaning and etching tool. RENA Technologies.
The bibliography is provided for reader reference and uses primary company, government, regulatory or official trade body sources wherever available.
This Report Answers
- What is the projected value of the Wet Chemical Station Market in 2026?
- What value is forecast for the Wet Chemical Station Market by 2036?
- What CAGR is forecast for the Wet Chemical Station Market from 2026 to 2036?
- What 2026 share is projected for Fully Automated Wet Stations within the station type category?
- What 2026 share is projected for Cleaning within the process category?
- Which demand factors support the Wet Chemical Station Market outlook?
- Which restraints and opportunities affect adoption in the Wet Chemical Station Market?
- How are country CAGR outlooks, including India at 10.2%, compared?
- Which companies and product developments are covered in the competitive analysis?
- What is included in the market scope, and how is the forecast validated?
Frequently Asked Questions
Why should executives track the Wet Chemical Station Market?
Executives should track this market because it can affect capital allocation, supplier strategy, operating risk, and competitive positioning across commercial planning cycles.
What business problem does the Wet Chemical Station Market address?
It helps executive teams judge where customer pain, supplier capability, compliance exposure, and implementation economics justify investment, procurement, or portfolio action.
What should procurement leaders evaluate before selecting suppliers?
Procurement leaders should assess evidence quality, integration fit, service coverage, compliance readiness, total cost of ownership, and supplier execution capability.
What can limit return on investment for buyers?
Return on investment can be limited by low utilization, integration delays, training gaps, unclear ownership, pricing pressure, or weak fit with existing workflows.
How can suppliers build executive confidence?
Suppliers can build confidence by proving implementation speed, risk reduction, support depth, reference use cases, and measurable outcomes for budget owners.
Preview the report firsthand - request a free sample
Get SampleGet the brochure for pricing and purchase details.
Get PDFTable of Content
- Key Takeaways
- Market Size and CAGR
- Top Growth Driver
- Fastest Growing Segment
- Leading Region
- Key Companies
- Emerging Opportunities
- Executive Summary
- Global Market Outlook
- Demand-side Trends
- Supply-side Trends
- Technology Roadmap Analysis
- Analysis and Recommendations
- Analyst Perspective (What is happening? Why now? What should investors know?)
- Key Questions Answered
- How large is the market?
- What is the CAGR?
- What are key trends?
- Which region dominates?
- Who are the leaders?
- Market Overview
- Market Coverage / Taxonomy
- Market Definition / Scope / Limitations
- Research Methodology
- Chapter Orientation
- Analytical Lens and Working Hypotheses
- Market Structure, Signals, and Trend Drivers
- Benchmarking and Cross-market Comparability
- Market Sizing, Forecasting, and Opportunity Mapping
- Research Design and Evidence Framework
- Desk Research Programme (Secondary Evidence)
- Expert Input and Fieldwork (Primary Evidence)
- Tooling, Models, and Reference Databases
- Data Engineering and Model Build
- Quality Assurance and Audit Trail
- Market Background
- Market Dynamics (Drivers, Restraints, Opportunity, Trends)
- Scenario Forecast (Optimistic, Likely, Conservative)
- Impact Analysis
- AI Impact
- Sustainability Impact
- Regulatory Impact
- Technology Impact
- Consumer / Buyer Analysis
- Purchase Drivers
- Adoption Barriers
- Buyer Journey
- Opportunity Map Analysis
- Product Life Cycle Analysis
- Supply Chain Analysis
- Investment Feasibility Matrix
- Value Chain Analysis
- PESTLE and Porter's Analysis
- Regulatory Landscape
- Regional Parent Market Outlook
- Production and Consumption Statistics
- Import and Export Statistics
- Global Market Analysis and Forecast, 2021 to 2036
- Historical Market Size Value (USD Billion) & Volume (Unit) Analysis, 2021 to 2025
- Current and Future Market Size Value (USD Billion) & Volume (Unit) Projections, 2026 to 2036
- Y-o-Y Growth Trend Analysis
- Absolute $ Opportunity Analysis
- Global Market Pricing Analysis, 2021 to 2036
- Global Market Analysis and Forecast, By Station Type, 2021 to 2036
- Introduction / Key Findings
- Historical Market Size Value (USD Billion) & Volume (Unit) Analysis By Station Type, 2021 to 2025
- Current and Future Market Size Value (USD Billion) & Volume (Unit) Analysis and Forecast By Station Type, 2026 to 2036
- Fully Automated Wet Stations
- Semi-automatic Stations
- Manual Wet Benches
- Single-wafer Wet Systems
- Fully Automated Wet Stations
- Y-o-Y Growth Trend Analysis By Station Type, 2021 to 2025
- Absolute $ Opportunity Analysis By Station Type, 2026 to 2036
- Global Market Analysis and Forecast, By Process, 2021 to 2036
- Introduction / Key Findings
- Historical Market Size Value (USD Billion) & Volume (Unit) Analysis By Process, 2021 to 2025
- Current and Future Market Size Value (USD Billion) & Volume (Unit) Analysis and Forecast By Process, 2026 to 2036
- Cleaning
- Etching
- Stripping
- Plating - Other
- Cleaning
- Y-o-Y Growth Trend Analysis By Process, 2021 to 2025
- Absolute $ Opportunity Analysis By Process, 2026 to 2036
- Global Market Analysis and Forecast, By End Use, 2021 to 2036
- Introduction / Key Findings
- Historical Market Size Value (USD Billion) & Volume (Unit) Analysis By End Use, 2021 to 2025
- Current and Future Market Size Value (USD Billion) & Volume (Unit) Analysis and Forecast By End Use, 2026 to 2036
- Semiconductor Fabs
- MEMS
- Compound Semiconductor
- R&D - Labs
- Semiconductor Fabs
- Y-o-Y Growth Trend Analysis By End Use, 2021 to 2025
- Absolute $ Opportunity Analysis By End Use, 2026 to 2036
- Global Market Analysis and Forecast, By Material, 2021 to 2036
- Introduction / Key Findings
- Historical Market Size Value (USD Billion) & Volume (Unit) Analysis By Material, 2021 to 2025
- Current and Future Market Size Value (USD Billion) & Volume (Unit) Analysis and Forecast By Material, 2026 to 2036
- PP - PVDF
- Quartz
- PTFE - PFA
- Stainless - Other
- PP - PVDF
- Y-o-Y Growth Trend Analysis By Material, 2021 to 2025
- Absolute $ Opportunity Analysis By Material, 2026 to 2036
- Global Market Analysis and Forecast, By Sales Channel, 2021 to 2036
- Introduction / Key Findings
- Historical Market Size Value (USD Billion) & Volume (Unit) Analysis By Sales Channel, 2021 to 2025
- Current and Future Market Size Value (USD Billion) & Volume (Unit) Analysis and Forecast By Sales Channel, 2026 to 2036
- Direct OEM
- EPC - Integrator
- Service Contractors
- Direct OEM
- Y-o-Y Growth Trend Analysis By Sales Channel, 2021 to 2025
- Absolute $ Opportunity Analysis By Sales Channel, 2026 to 2036
- Global Market Analysis and Forecast, By Region, 2021 to 2036
- Introduction
- Historical Market Size Value (USD Billion) & Volume (Unit) Analysis By Region, 2021 to 2025
- Current Market Size Value (USD Billion) & Volume (Unit) Analysis and Forecast By Region, 2026 to 2036
- North America
- Latin America
- Western Europe
- Eastern Europe
- East Asia
- South Asia and Pacific
- Middle East & Africa
- Market Attractiveness Analysis By Region
- North America Market Analysis and Forecast, By Country, 2021 to 2036
- Historical Market Size Value (USD Billion) & Volume (Unit) Trend Analysis By Market Taxonomy, 2021 to 2025
- Market Size Value (USD Billion) & Volume (Unit) Forecast By Market Taxonomy, 2026 to 2036
- By Country
- USA
- Canada
- Mexico
- By Station Type
- By Process
- By End Use
- By Material
- By Sales Channel
- By Country
- Market Attractiveness Analysis
- By Country
- By Station Type
- By Process
- By End Use
- By Material
- By Sales Channel
- Key Takeaways
- Latin America Market Analysis and Forecast, By Country
- Historical Market Size Value (USD Billion) & Volume (Unit) Trend Analysis By Market Taxonomy, 2021 to 2025
- Market Size Value (USD Billion) & Volume (Unit) Forecast By Market Taxonomy, 2026 to 2036
- By Country
- Brazil
- Chile
- Rest of Latin America
- By Station Type
- By Process
- By End Use
- By Material
- By Sales Channel
- By Country
- Market Attractiveness Analysis
- By Country
- By Station Type
- By Process
- By End Use
- By Material
- By Sales Channel
- Key Takeaways
- Western Europe Market Analysis and Forecast, By Country
- Historical Market Size Value (USD Billion) & Volume (Unit) Trend Analysis By Market Taxonomy, 2021 to 2025
- Market Size Value (USD Billion) & Volume (Unit) Forecast By Market Taxonomy, 2026 to 2036
- By Country
- Germany
- UK
- Italy
- Spain
- France
- Nordic
- BENELUX
- Rest of Western Europe
- By Station Type
- By Process
- By End Use
- By Material
- By Sales Channel
- By Country
- Market Attractiveness Analysis
- By Country
- By Station Type
- By Process
- By End Use
- By Material
- By Sales Channel
- Key Takeaways
- Eastern Europe Market Analysis and Forecast, By Country
- Historical Market Size Value (USD Billion) & Volume (Unit) Trend Analysis By Market Taxonomy, 2021 to 2025
- Market Size Value (USD Billion) & Volume (Unit) Forecast By Market Taxonomy, 2026 to 2036
- By Country
- Russia
- Poland
- Hungary
- Balkan & Baltic
- Rest of Eastern Europe
- By Station Type
- By Process
- By End Use
- By Material
- By Sales Channel
- By Country
- Market Attractiveness Analysis
- By Country
- By Station Type
- By Process
- By End Use
- By Material
- By Sales Channel
- Key Takeaways
- East Asia Market Analysis and Forecast, By Country
- Historical Market Size Value (USD Billion) & Volume (Unit) Trend Analysis By Market Taxonomy, 2021 to 2025
- Market Size Value (USD Billion) & Volume (Unit) Forecast By Market Taxonomy, 2026 to 2036
- By Country
- China
- Japan
- South Korea
- By Station Type
- By Process
- By End Use
- By Material
- By Sales Channel
- By Country
- Market Attractiveness Analysis
- By Country
- By Station Type
- By Process
- By End Use
- By Material
- By Sales Channel
- Key Takeaways
- South Asia and Pacific Market Analysis and Forecast, By Country
- Historical Market Size Value (USD Billion) & Volume (Unit) Trend Analysis By Market Taxonomy, 2021 to 2025
- Market Size Value (USD Billion) & Volume (Unit) Forecast By Market Taxonomy, 2026 to 2036
- By Country
- India
- ASEAN
- Australia & New Zealand
- Rest of South Asia and Pacific
- By Station Type
- By Process
- By End Use
- By Material
- By Sales Channel
- By Country
- Market Attractiveness Analysis
- By Country
- By Station Type
- By Process
- By End Use
- By Material
- By Sales Channel
- Key Takeaways
- Middle East & Africa Market Analysis and Forecast, By Country
- Historical Market Size Value (USD Billion) & Volume (Unit) Trend Analysis By Market Taxonomy, 2021 to 2025
- Market Size Value (USD Billion) & Volume (Unit) Forecast By Market Taxonomy, 2026 to 2036
- By Country
- Kingdom of Saudi Arabia
- Other GCC Countries
- Türkiye
- South Africa
- Other African Union
- Rest of Middle East & Africa
- By Station Type
- By Process
- By End Use
- By Material
- By Sales Channel
- By Country
- Market Attractiveness Analysis
- By Country
- By Station Type
- By Process
- By End Use
- By Material
- By Sales Channel
- Key Takeaways
- Key Countries Market Analysis
- USA
- Pricing Analysis
- Market Share Analysis, 2025
- By Station Type
- By Process
- By End Use
- By Material
- By Sales Channel
- Canada
- Pricing Analysis
- Market Share Analysis, 2025
- By Station Type
- By Process
- By End Use
- By Material
- By Sales Channel
- Mexico
- Pricing Analysis
- Market Share Analysis, 2025
- By Station Type
- By Process
- By End Use
- By Material
- By Sales Channel
- Brazil
- Pricing Analysis
- Market Share Analysis, 2025
- By Station Type
- By Process
- By End Use
- By Material
- By Sales Channel
- Chile
- Pricing Analysis
- Market Share Analysis, 2025
- By Station Type
- By Process
- By End Use
- By Material
- By Sales Channel
- Germany
- Pricing Analysis
- Market Share Analysis, 2025
- By Station Type
- By Process
- By End Use
- By Material
- By Sales Channel
- UK
- Pricing Analysis
- Market Share Analysis, 2025
- By Station Type
- By Process
- By End Use
- By Material
- By Sales Channel
- Italy
- Pricing Analysis
- Market Share Analysis, 2025
- By Station Type
- By Process
- By End Use
- By Material
- By Sales Channel
- Spain
- Pricing Analysis
- Market Share Analysis, 2025
- By Station Type
- By Process
- By End Use
- By Material
- By Sales Channel
- France
- Pricing Analysis
- Market Share Analysis, 2025
- By Station Type
- By Process
- By End Use
- By Material
- By Sales Channel
- India
- Pricing Analysis
- Market Share Analysis, 2025
- By Station Type
- By Process
- By End Use
- By Material
- By Sales Channel
- ASEAN
- Pricing Analysis
- Market Share Analysis, 2025
- By Station Type
- By Process
- By End Use
- By Material
- By Sales Channel
- Australia & New Zealand
- Pricing Analysis
- Market Share Analysis, 2025
- By Station Type
- By Process
- By End Use
- By Material
- By Sales Channel
- China
- Pricing Analysis
- Market Share Analysis, 2025
- By Station Type
- By Process
- By End Use
- By Material
- By Sales Channel
- Japan
- Pricing Analysis
- Market Share Analysis, 2025
- By Station Type
- By Process
- By End Use
- By Material
- By Sales Channel
- South Korea
- Pricing Analysis
- Market Share Analysis, 2025
- By Station Type
- By Process
- By End Use
- By Material
- By Sales Channel
- Russia
- Pricing Analysis
- Market Share Analysis, 2025
- By Station Type
- By Process
- By End Use
- By Material
- By Sales Channel
- Poland
- Pricing Analysis
- Market Share Analysis, 2025
- By Station Type
- By Process
- By End Use
- By Material
- By Sales Channel
- Hungary
- Pricing Analysis
- Market Share Analysis, 2025
- By Station Type
- By Process
- By End Use
- By Material
- By Sales Channel
- Kingdom of Saudi Arabia
- Pricing Analysis
- Market Share Analysis, 2025
- By Station Type
- By Process
- By End Use
- By Material
- By Sales Channel
- Türkiye
- Pricing Analysis
- Market Share Analysis, 2025
- By Station Type
- By Process
- By End Use
- By Material
- By Sales Channel
- South Africa
- Pricing Analysis
- Market Share Analysis, 2025
- By Station Type
- By Process
- By End Use
- By Material
- By Sales Channel
- USA
- Market Structure Analysis
- Competition Dashboard
- Competition Benchmarking
- Market Share Analysis of Top Players
- By Regional
- By Station Type
- By Process
- By End Use
- By Material
- By Sales Channel
- Emerging Startups
- Innovation Benchmarking
- Competition Analysis
- Competition Deep Dive
- SCREEN Holdings
- Overview
- Product Portfolio
- Profitability by Market Segments (Product/Region/Sales Channel)
- Sales Footprint
- Strategy Overview
- Marketing Strategy
- Product Strategy
- Channel Strategy
- Tokyo Electron
- Lam Research
- ACM Research
- Modutek
- RENA Technologies
- AP&S International
- SEMES
- SCREEN Holdings
- Case Studies
- Success Stories
- Recent Developments
- Competition Deep Dive
- Assumptions & Acronyms Used


