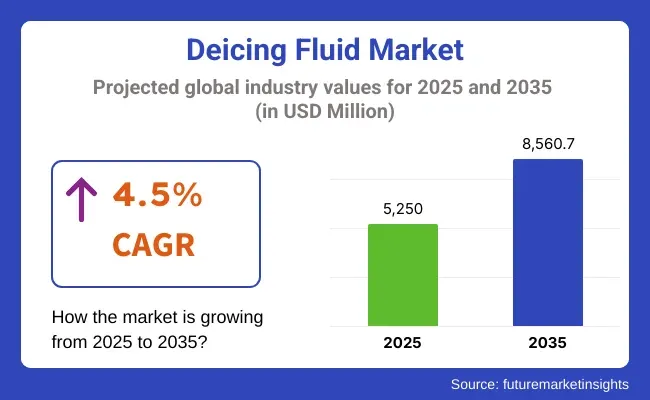
The market is projected to grow from USD 5,250 Million in 2025 to USD 8,560.7 Million in 2035, at a CAGR of 4.5% during the forecast period. Innovations like green-class formulations and glycol-free products as well as the rising demand from the aerospace and highway de-icing segments are causing the industry to change. Moreover, imposing rigorous safety regulations by aviation authorities and the increase of winter tourism are some more driving the market growth.
Market Metrics
| Metric | Value |
|---|---|
| Market Size (2025E) | USD 5,250 Million |
| Market Value (2035F) | USD 8,560.7 Million |
| CAGR (2025 to 2035) | 4.5% |
The deicing fluid market is expected to pave its way with a consistent growth during the forecast period (2025 to 2035) and create more opportunities for the manufacturers as the air traffic is increasing across the globe coupled with stringent safety regulations governing aviation and transportation are expected to propel the demand of deicing fluid, leading to growth of the market.
Deicing fluids play an important role in keeping aircraft, runways, roadways, and equipment free from ice formations and accretions in harsh winter conditions, which improves the safety and efficacy of operations.
Ethylene glycol accounts for the leading share of the deicing fluid market, due to its thermal efficiency and cost-effectiveness in large operations. The ethylene glycol-based fluids are favoured by bus servicing stations, aviation service providers and airport maintenance crews for their exceptional ice ingestion performance, being able to quickly melt off ice deposited on aircraft surfaces. Such fluids work at low temperatures and are therefore necessary for guaranteeing the safety of flights and the continuity of aircraft operations during winter conditions.
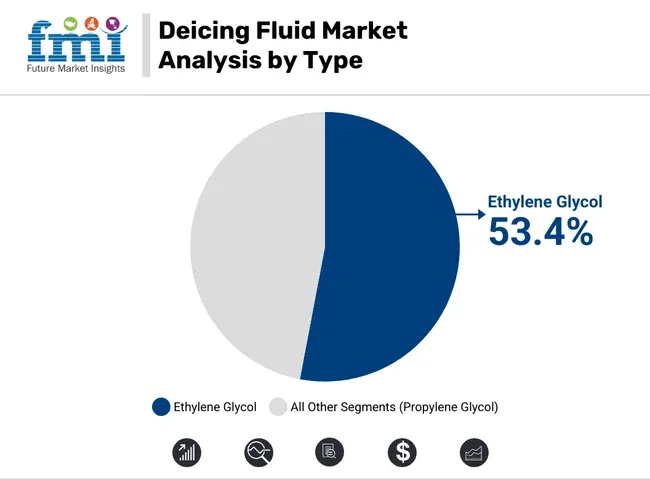
| By Type | Market Share (2025) |
|---|---|
| Ethylene Glycol | 53.4% |
Due to its chemical properties, ethylene glycol significantly lowers the freezing point of water, which prevents ice from forming on aircraft wings, fuselage and ground infrastructure. The extensive commercial availability of the fluid and its compatibility with already existing ground equipment have also helped cement its dominance in both developed and emerging aviation markets.
Over the years, manufacturers have come out with formulations that are less toxic and have produced better recovery systems, which address the environment concerns that have come with ethylene glycol use.
As agencies ramp up controls regarding environmental discharge and glycol runoff, suppliers are investing in state-of-the-art recycling technologies to capture and reuse deicing fluid, minimizing waste and operating costs. Such advancements do not diminish the continued usefulness of ethylene glycol, especially for high throughput international airports and military bases that require quick, large scale deicing.
Commercial aviation is the leading end-user of deicing fluids and crosses over the globe's maximum consumption. Deicing solutions are widely used by airports and airline operators to keep up with flight schedules and ensure passenger safety during the winter months, especially in North America, Europe and parts of Asia-Pacific, where snow and frost can cause interruptions in operations for long periods of time. The usage of deicing fluids has further increased due to the revival of flights and growth of airline networks.
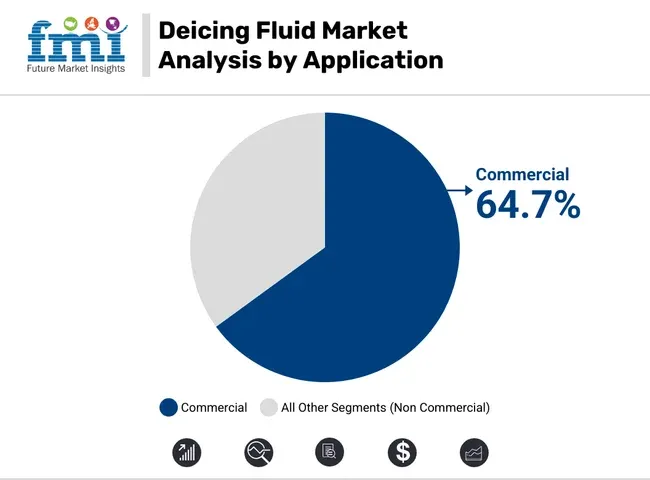
| By Application | Market Share (2025) |
|---|---|
| Commercial | 64.7% |
Leading commercial airlines use high-volume deicing systems and advanced formulations to keep downtime down and the total per-flight consumption of fluid low. With passenger traffic increasing, airports have expanded and modernized deicing infrastructures, building centralized deicing pads and implementing recovery of deicing fluids to route operations on a larger scale.
In addition, climate variability and increased frequency of extreme winter weather events have driven a need for information and knowledge on effective deicing procedures in the context of commercial aviation with airline operators has also brought about collaborations between deicing fluid providers that are forming plans to determine phased better, greener, and quicker solutions.
Notably, the commercial segment will remain as a major driver of innovation and volume growth for the deicing fluid market, with stringent aviation safety regulations in place. Upticks in air fleet modernization and airport upgrades across developing economies continue to ensure sustained fluid consumption, reaffirming the segment's leadership in the global market.
Environmental Impact and Regulatory Pressures
One of the significant challenges for deicing fluid market is the environmental hazards caused by conventional glycol-based fluids which can be damaging if released into water bodies. Local aviation authorities, as well as regulatory agencies like the EPA and ECHA, are imposing stricter controls and restrictions on both the use and disposal of deicing agents, raising compliance costs for both manufacturers and operators.
Ethylene and propylene glycol fluids have high BOD levels, leading to difficulties in airport runoff systems and impacting local ecosystems. In response to these issues, manufacturers should develop biodegradable, low-toxicity formulations, while airports should modernize to closed-loop recovery and treatment systems, both of which require a hefty investment.
Development of Eco-Friendly and High-Performance Deicers
The rising demand for sustainable and performance-enhanced deicing solutions represents as a significant opportunity for market participants. In particular, emerging trends towards non-corrosive, non-glycol, and fast-acting fluids are driving innovation through alternative chemistries such as potassium acetate, calcium magnesium acetate, and novel biodegradable polymers.
Moreover, the integration of automated spraying systems, real-time weather integration, and smart deicing infrastructure also provide value-added opportunities. Businesses that provide next-generation, environmental-friendly deicers with aviation- and highway-approved certifications will gain. They can strengthen their market position through collaborations with aerospace OEMs, municipalities, and defense agencies.
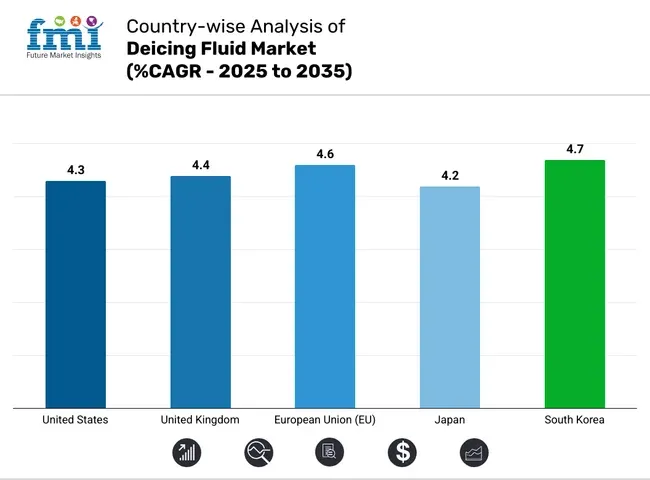
USA deicing fluid market is anticipated to record a CAGR of over 4.3% during the forecast period. Key factors supporting the market growth include the country's wide-scale aviation operations, extensive highway infrastructure, and vulnerability to frequent snow and ice storms, especially in northern states.
Moreover, stringent safety policies from agencies like the FAA and the Department of Transportation have motivated uniform and timely application of deicing fluids. Innovation and rising consumer demand for eco-friendly, low-toxicity products are also driving demand higher across airports, municipalities and road maintenance departments.
| Country | CAGR (2025 to 2035) |
|---|---|
| United States | 4.3% |
The United Kingdom deicing fluid market is anticipated to register a CAGR of 4.4% through 2035. Regular winter weather interruptions combined with increasing aviation traffic require deicing fluids to be efficiently applied across roadways and airport runways.
Municipalities are also placing more focus on preventive winter maintenance, which is driving the use of advanced deicing formulations. Increasing environmental guidelines regarding usage of glycol-based fluids are also causing innovations in biodegradable and less corrosive solutions, expanding the scope of the market in civil and commercial applications.
| Country | CAGR (2025 to 2035) |
|---|---|
| United Kingdom | 4.4% |
Europe deicing fluid market is anticipated to be the fastest-growing in the total market, and it is anticipated to register a 4.6% CAGR in 2025 to 2035. Well-developed airport infrastructure, frequent winter snowfalls across north-central Europe, as well as strong environmental regulations pushing manufacturers away from conventional systems and towards eco-friendly alternatives, all drive demand here.
With airport authorities and municipal bodies upping the ante in winter weather readiness in Germany, Sweden and France, there are direct implications for deicing fluids particularly potassium acetate and other organic-derived blends consumed at runways.
| Region | CAGR (2025 to 2035) |
|---|---|
| European Union | 4.6% |
Japan deicing fluid market is anticipated to grow at a CAGR of 4.3% during 2025 to 2035. Japan's cold northern perimeter, including Hokkaido, and vibrant aviation hubs ensure a steady demand for runway and aircraft deicing applications.
Market drivers include a focus on operational safety, punctuality in air travel, and increasing adoption and use of automated spraying systems. Additionally, government backing of sustainable deicing techniques is motivating local firms to create and market low-impact, high-efficiency formulations.
| Country | CAGR (2025 to 2035) |
|---|---|
| Japan | 4.2% |
The South Korea deicing fluid market is expected to grow with a CAGR of 4.7% during the forecast period. The country is moving towards embracing winter maintenance technologies that incorporate new deicing options as air travel and infrastructure development grows in urban areas.
This has resulted in enhanced procurement of deicing fluids by local governments and transport departments, especially in snow-prone provinces and high-altitude road networks. South Korea is even more riding the wave with smart infrastructure including weather detection systems integrated with automatic fluid spraying mechanisms to enhance usage.
| Country | CAGR (2025 to 2035) |
|---|---|
| South Korea | 4.7% |
As winter maintenance standards advance in major regions and aviation safety regulations tighten, the Deicing Fluid Market will continue to grow. Firms are also investing in sustainable formulations, more resilient storage and delivery systems, and regional supply chain optimization. Market players focus on R&D and sustainability certifications to remain competitive, and engage in strategic partnerships to improve operational and environmental performance.
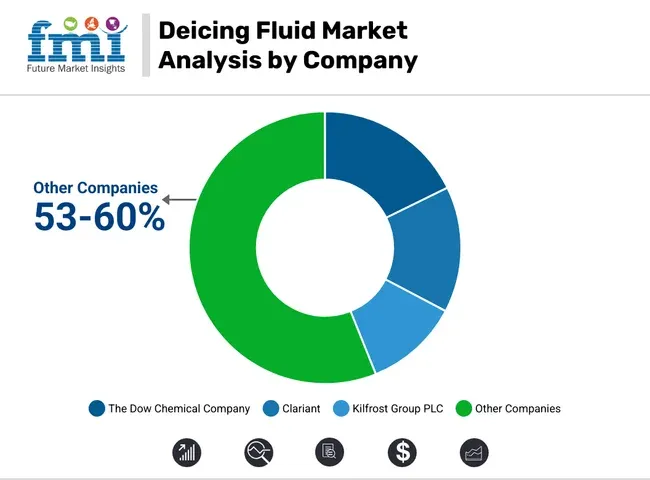
The Dow Chemical Company (16-19%)
Dow leads the market through continuous innovation in propylene glycol-based fluids. The company emphasizes environmental compliance and high-performance properties in extreme weather. Its global infrastructure supports fast delivery and replenishment during peak deicing seasons.
Clariant (14-16%)
Clariant focuses on environmentally friendly formulations, emphasizing performance with low environmental impact. Its Safewing® product line is widely adopted across European and Asian airports, with strong regulatory compliance and operational versatility.
Kilfrost Group PLC (10-12%)
Kilfrost enhances its reach across road, rail, and runway deicing applications. The company offers versatile and non-toxic solutions, with a stronghold in the UK and expanding presence in North America and Asia-Pacific.
E. I. du Pont de Nemours and Company
DuPont integrates sustainability into its deicing fluid innovations. It develops safer formulations for personnel and surfaces while enhancing freeze point depression performance, particularly in civil aviation and military applications.
Other Key Players (53-60% Combined)
These companies contribute to industry diversity through specialized offerings, regional presence, and innovation:
Table 1: Global Market Value (US$ Mn) Forecast by Region, 2017-2032
Table 2: Global Market Volume (Tons) Forecast by Region, 2017-2032
Table 3: Global Market Value (US$ Mn) Forecast by Product Type, 2017-2032
Table 4: Global Market Volume (Tons) Forecast by Product Type, 2017-2032
Table 5: Global Market Value (US$ Mn) Forecast by Composition, 2017-2032
Table 6: Global Market Volume (Tons) Forecast by Composition, 2017-2032
Table 7: Global Market Value (US$ Mn) Forecast by Application, 2017-2032
Table 8: Global Market Volume (Tons) Forecast by Application, 2017-2032
Table 9: North America Market Value (US$ Mn) Forecast by Country, 2017-2032
Table 10: North America Market Volume (Tons) Forecast by Country, 2017-2032
Table 11: North America Market Value (US$ Mn) Forecast by Product Type, 2017-2032
Table 12: North America Market Volume (Tons) Forecast by Product Type, 2017-2032
Table 13: North America Market Value (US$ Mn) Forecast by Composition, 2017-2032
Table 14: North America Market Volume (Tons) Forecast by Composition, 2017-2032
Table 15: North America Market Value (US$ Mn) Forecast by Application, 2017-2032
Table 16: North America Market Volume (Tons) Forecast by Application, 2017-2032
Table 17: Latin America Market Value (US$ Mn) Forecast by Country, 2017-2032
Table 18: Latin America Market Volume (Tons) Forecast by Country, 2017-2032
Table 19: Latin America Market Value (US$ Mn) Forecast by Product Type, 2017-2032
Table 20: Latin America Market Volume (Tons) Forecast by Product Type, 2017-2032
Table 21: Latin America Market Value (US$ Mn) Forecast by Composition, 2017-2032
Table 22: Latin America Market Volume (Tons) Forecast by Composition, 2017-2032
Table 23: Latin America Market Value (US$ Mn) Forecast by Application, 2017-2032
Table 24: Latin America Market Volume (Tons) Forecast by Application, 2017-2032
Table 25: Europe Market Value (US$ Mn) Forecast by Country, 2017-2032
Table 26: Europe Market Volume (Tons) Forecast by Country, 2017-2032
Table 27: Europe Market Value (US$ Mn) Forecast by Product Type, 2017-2032
Table 28: Europe Market Volume (Tons) Forecast by Product Type, 2017-2032
Table 29: Europe Market Value (US$ Mn) Forecast by Composition, 2017-2032
Table 30: Europe Market Volume (Tons) Forecast by Composition, 2017-2032
Table 31: Europe Market Value (US$ Mn) Forecast by Application, 2017-2032
Table 32: Europe Market Volume (Tons) Forecast by Application, 2017-2032
Table 33: East Asia Market Value (US$ Mn) Forecast by Country, 2017-2032
Table 34: East Asia Market Volume (Tons) Forecast by Country, 2017-2032
Table 35: East Asia Market Value (US$ Mn) Forecast by Product Type, 2017-2032
Table 36: East Asia Market Volume (Tons) Forecast by Product Type, 2017-2032
Table 37: East Asia Market Value (US$ Mn) Forecast by Composition, 2017-2032
Table 38: East Asia Market Volume (Tons) Forecast by Composition, 2017-2032
Table 39: East Asia Market Value (US$ Mn) Forecast by Application, 2017-2032
Table 40: East Asia Market Volume (Tons) Forecast by Application, 2017-2032
Table 41: South Asia & Pacific Market Value (US$ Mn) Forecast by Country, 2017-2032
Table 42: South Asia & Pacific Market Volume (Tons) Forecast by Country, 2017-2032
Table 43: South Asia & Pacific Market Value (US$ Mn) Forecast by Product Type, 2017-2032
Table 44: South Asia & Pacific Market Volume (Tons) Forecast by Product Type, 2017-2032
Table 45: South Asia & Pacific Market Value (US$ Mn) Forecast by Composition, 2017-2032
Table 46: South Asia & Pacific Market Volume (Tons) Forecast by Composition, 2017-2032
Table 47: South Asia & Pacific Market Value (US$ Mn) Forecast by Application, 2017-2032
Table 48: South Asia & Pacific Market Volume (Tons) Forecast by Application, 2017-2032
Table 49: MEA Market Value (US$ Mn) Forecast by Country, 2017-2032
Table 50: MEA Market Volume (Tons) Forecast by Country, 2017-2032
Table 51: MEA Market Value (US$ Mn) Forecast by Product Type, 2017-2032
Table 52: MEA Market Volume (Tons) Forecast by Product Type, 2017-2032
Table 53: MEA Market Value (US$ Mn) Forecast by Composition, 2017-2032
Table 54: MEA Market Volume (Tons) Forecast by Composition, 2017-2032
Table 55: MEA Market Value (US$ Mn) Forecast by Application, 2017-2032
Table 56: MEA Market Volume (Tons) Forecast by Application, 2017-2032
Figure 1: Global Market Value (US$ Mn) by Product Type, 2022-2032
Figure 2: Global Market Value (US$ Mn) by Composition, 2022-2032
Figure 3: Global Market Value (US$ Mn) by Application, 2022-2032
Figure 4: Global Market Value (US$ Mn) by Region, 2022-2032
Figure 5: Global Market Value (US$ Mn) Analysis by Region, 2017-2032
Figure 6: Global Market Volume (Tons) Analysis by Region, 2017-2032
Figure 7: Global Market Value Share (%) and BPS Analysis by Region, 2022-2032
Figure 8: Global Market Y-o-Y Growth (%) Projections by Region, 2022-2032
Figure 9: Global Market Value (US$ Mn) Analysis by Product Type, 2017-2032
Figure 10: Global Market Volume (Tons) Analysis by Product Type, 2017-2032
Figure 11: Global Market Value Share (%) and BPS Analysis by Product Type, 2022-2032
Figure 12: Global Market Y-o-Y Growth (%) Projections by Product Type, 2022-2032
Figure 13: Global Market Value (US$ Mn) Analysis by Composition, 2017-2032
Figure 14: Global Market Volume (Tons) Analysis by Composition, 2017-2032
Figure 15: Global Market Value Share (%) and BPS Analysis by Composition, 2022-2032
Figure 16: Global Market Y-o-Y Growth (%) Projections by Composition, 2022-2032
Figure 17: Global Market Value (US$ Mn) Analysis by Application, 2017-2032
Figure 18: Global Market Volume (Tons) Analysis by Application, 2017-2032
Figure 19: Global Market Value Share (%) and BPS Analysis by Application, 2022-2032
Figure 20: Global Market Y-o-Y Growth (%) Projections by Application, 2022-2032
Figure 21: Global Market Attractiveness by Product Type, 2022-2032
Figure 22: Global Market Attractiveness by Composition, 2022-2032
Figure 23: Global Market Attractiveness by Application, 2022-2032
Figure 24: Global Market Attractiveness by Region, 2022-2032
Figure 25: North America Market Value (US$ Mn) by Product Type, 2022-2032
Figure 26: North America Market Value (US$ Mn) by Composition, 2022-2032
Figure 27: North America Market Value (US$ Mn) by Application, 2022-2032
Figure 28: North America Market Value (US$ Mn) by Country, 2022-2032
Figure 29: North America Market Value (US$ Mn) Analysis by Country, 2017-2032
Figure 30: North America Market Volume (Tons) Analysis by Country, 2017-2032
Figure 31: North America Market Value Share (%) and BPS Analysis by Country, 2022-2032
Figure 32: North America Market Y-o-Y Growth (%) Projections by Country, 2022-2032
Figure 33: North America Market Value (US$ Mn) Analysis by Product Type, 2017-2032
Figure 34: North America Market Volume (Tons) Analysis by Product Type, 2017-2032
Figure 35: North America Market Value Share (%) and BPS Analysis by Product Type, 2022-2032
Figure 36: North America Market Y-o-Y Growth (%) Projections by Product Type, 2022-2032
Figure 37: North America Market Value (US$ Mn) Analysis by Composition, 2017-2032
Figure 38: North America Market Volume (Tons) Analysis by Composition, 2017-2032
Figure 39: North America Market Value Share (%) and BPS Analysis by Composition, 2022-2032
Figure 40: North America Market Y-o-Y Growth (%) Projections by Composition, 2022-2032
Figure 41: North America Market Value (US$ Mn) Analysis by Application, 2017-2032
Figure 42: North America Market Volume (Tons) Analysis by Application, 2017-2032
Figure 43: North America Market Value Share (%) and BPS Analysis by Application, 2022-2032
Figure 44: North America Market Y-o-Y Growth (%) Projections by Application, 2022-2032
Figure 45: North America Market Attractiveness by Product Type, 2022-2032
Figure 46: North America Market Attractiveness by Composition, 2022-2032
Figure 47: North America Market Attractiveness by Application, 2022-2032
Figure 48: North America Market Attractiveness by Country, 2022-2032
Figure 49: Latin America Market Value (US$ Mn) by Product Type, 2022-2032
Figure 50: Latin America Market Value (US$ Mn) by Composition, 2022-2032
Figure 51: Latin America Market Value (US$ Mn) by Application, 2022-2032
Figure 52: Latin America Market Value (US$ Mn) by Country, 2022-2032
Figure 53: Latin America Market Value (US$ Mn) Analysis by Country, 2017-2032
Figure 54: Latin America Market Volume (Tons) Analysis by Country, 2017-2032
Figure 55: Latin America Market Value Share (%) and BPS Analysis by Country, 2022-2032
Figure 56: Latin America Market Y-o-Y Growth (%) Projections by Country, 2022-2032
Figure 57: Latin America Market Value (US$ Mn) Analysis by Product Type, 2017-2032
Figure 58: Latin America Market Volume (Tons) Analysis by Product Type, 2017-2032
Figure 59: Latin America Market Value Share (%) and BPS Analysis by Product Type, 2022-2032
Figure 60: Latin America Market Y-o-Y Growth (%) Projections by Product Type, 2022-2032
Figure 61: Latin America Market Value (US$ Mn) Analysis by Composition, 2017-2032
Figure 62: Latin America Market Volume (Tons) Analysis by Composition, 2017-2032
Figure 63: Latin America Market Value Share (%) and BPS Analysis by Composition, 2022-2032
Figure 64: Latin America Market Y-o-Y Growth (%) Projections by Composition, 2022-2032
Figure 65: Latin America Market Value (US$ Mn) Analysis by Application, 2017-2032
Figure 66: Latin America Market Volume (Tons) Analysis by Application, 2017-2032
Figure 67: Latin America Market Value Share (%) and BPS Analysis by Application, 2022-2032
Figure 68: Latin America Market Y-o-Y Growth (%) Projections by Application, 2022-2032
Figure 69: Latin America Market Attractiveness by Product Type, 2022-2032
Figure 70: Latin America Market Attractiveness by Composition, 2022-2032
Figure 71: Latin America Market Attractiveness by Application, 2022-2032
Figure 72: Latin America Market Attractiveness by Country, 2022-2032
Figure 73: Europe Market Value (US$ Mn) by Product Type, 2022-2032
Figure 74: Europe Market Value (US$ Mn) by Composition, 2022-2032
Figure 75: Europe Market Value (US$ Mn) by Application, 2022-2032
Figure 76: Europe Market Value (US$ Mn) by Country, 2022-2032
Figure 77: Europe Market Value (US$ Mn) Analysis by Country, 2017-2032
Figure 78: Europe Market Volume (Tons) Analysis by Country, 2017-2032
Figure 79: Europe Market Value Share (%) and BPS Analysis by Country, 2022-2032
Figure 80: Europe Market Y-o-Y Growth (%) Projections by Country, 2022-2032
Figure 81: Europe Market Value (US$ Mn) Analysis by Product Type, 2017-2032
Figure 82: Europe Market Volume (Tons) Analysis by Product Type, 2017-2032
Figure 83: Europe Market Value Share (%) and BPS Analysis by Product Type, 2022-2032
Figure 84: Europe Market Y-o-Y Growth (%) Projections by Product Type, 2022-2032
Figure 85: Europe Market Value (US$ Mn) Analysis by Composition, 2017-2032
Figure 86: Europe Market Volume (Tons) Analysis by Composition, 2017-2032
Figure 87: Europe Market Value Share (%) and BPS Analysis by Composition, 2022-2032
Figure 88: Europe Market Y-o-Y Growth (%) Projections by Composition, 2022-2032
Figure 89: Europe Market Value (US$ Mn) Analysis by Application, 2017-2032
Figure 90: Europe Market Volume (Tons) Analysis by Application, 2017-2032
Figure 91: Europe Market Value Share (%) and BPS Analysis by Application, 2022-2032
Figure 92: Europe Market Y-o-Y Growth (%) Projections by Application, 2022-2032
Figure 93: Europe Market Attractiveness by Product Type, 2022-2032
Figure 94: Europe Market Attractiveness by Composition, 2022-2032
Figure 95: Europe Market Attractiveness by Application, 2022-2032
Figure 96: Europe Market Attractiveness by Country, 2022-2032
Figure 97: East Asia Market Value (US$ Mn) by Product Type, 2022-2032
Figure 98: East Asia Market Value (US$ Mn) by Composition, 2022-2032
Figure 99: East Asia Market Value (US$ Mn) by Application, 2022-2032
Figure 100: East Asia Market Value (US$ Mn) by Country, 2022-2032
Figure 101: East Asia Market Value (US$ Mn) Analysis by Country, 2017-2032
Figure 102: East Asia Market Volume (Tons) Analysis by Country, 2017-2032
Figure 103: East Asia Market Value Share (%) and BPS Analysis by Country, 2022-2032
Figure 104: East Asia Market Y-o-Y Growth (%) Projections by Country, 2022-2032
Figure 105: East Asia Market Value (US$ Mn) Analysis by Product Type, 2017-2032
Figure 106: East Asia Market Volume (Tons) Analysis by Product Type, 2017-2032
Figure 107: East Asia Market Value Share (%) and BPS Analysis by Product Type, 2022-2032
Figure 108: East Asia Market Y-o-Y Growth (%) Projections by Product Type, 2022-2032
Figure 109: East Asia Market Value (US$ Mn) Analysis by Composition, 2017-2032
Figure 110: East Asia Market Volume (Tons) Analysis by Composition, 2017-2032
Figure 111: East Asia Market Value Share (%) and BPS Analysis by Composition, 2022-2032
Figure 112: East Asia Market Y-o-Y Growth (%) Projections by Composition, 2022-2032
Figure 113: East Asia Market Value (US$ Mn) Analysis by Application, 2017-2032
Figure 114: East Asia Market Volume (Tons) Analysis by Application, 2017-2032
Figure 115: East Asia Market Value Share (%) and BPS Analysis by Application, 2022-2032
Figure 116: East Asia Market Y-o-Y Growth (%) Projections by Application, 2022-2032
Figure 117: East Asia Market Attractiveness by Product Type, 2022-2032
Figure 118: East Asia Market Attractiveness by Composition, 2022-2032
Figure 119: East Asia Market Attractiveness by Application, 2022-2032
Figure 120: East Asia Market Attractiveness by Country, 2022-2032
Figure 121: South Asia & Pacific Market Value (US$ Mn) by Product Type, 2022-2032
Figure 122: South Asia & Pacific Market Value (US$ Mn) by Composition, 2022-2032
Figure 123: South Asia & Pacific Market Value (US$ Mn) by Application, 2022-2032
Figure 124: South Asia & Pacific Market Value (US$ Mn) by Country, 2022-2032
Figure 125: South Asia & Pacific Market Value (US$ Mn) Analysis by Country, 2017-2032
Figure 126: South Asia & Pacific Market Volume (Tons) Analysis by Country, 2017-2032
Figure 127: South Asia & Pacific Market Value Share (%) and BPS Analysis by Country, 2022-2032
Figure 128: South Asia & Pacific Market Y-o-Y Growth (%) Projections by Country, 2022-2032
Figure 129: South Asia & Pacific Market Value (US$ Mn) Analysis by Product Type, 2017-2032
Figure 130: South Asia & Pacific Market Volume (Tons) Analysis by Product Type, 2017-2032
Figure 131: South Asia & Pacific Market Value Share (%) and BPS Analysis by Product Type, 2022-2032
Figure 132: South Asia & Pacific Market Y-o-Y Growth (%) Projections by Product Type, 2022-2032
Figure 133: South Asia & Pacific Market Value (US$ Mn) Analysis by Composition, 2017-2032
Figure 134: South Asia & Pacific Market Volume (Tons) Analysis by Composition, 2017-2032
Figure 135: South Asia & Pacific Market Value Share (%) and BPS Analysis by Composition, 2022-2032
Figure 136: South Asia & Pacific Market Y-o-Y Growth (%) Projections by Composition, 2022-2032
Figure 137: South Asia & Pacific Market Value (US$ Mn) Analysis by Application, 2017-2032
Figure 138: South Asia & Pacific Market Volume (Tons) Analysis by Application, 2017-2032
Figure 139: South Asia & Pacific Market Value Share (%) and BPS Analysis by Application, 2022-2032
Figure 140: South Asia & Pacific Market Y-o-Y Growth (%) Projections by Application, 2022-2032
Figure 141: South Asia & Pacific Market Attractiveness by Product Type, 2022-2032
Figure 142: South Asia & Pacific Market Attractiveness by Composition, 2022-2032
Figure 143: South Asia & Pacific Market Attractiveness by Application, 2022-2032
Figure 144: South Asia & Pacific Market Attractiveness by Country, 2022-2032
Figure 145: MEA Market Value (US$ Mn) by Product Type, 2022-2032
Figure 146: MEA Market Value (US$ Mn) by Composition, 2022-2032
Figure 147: MEA Market Value (US$ Mn) by Application, 2022-2032
Figure 148: MEA Market Value (US$ Mn) by Country, 2022-2032
Figure 149: MEA Market Value (US$ Mn) Analysis by Country, 2017-2032
Figure 150: MEA Market Volume (Tons) Analysis by Country, 2017-2032
Figure 151: MEA Market Value Share (%) and BPS Analysis by Country, 2022-2032
Figure 152: MEA Market Y-o-Y Growth (%) Projections by Country, 2022-2032
Figure 153: MEA Market Value (US$ Mn) Analysis by Product Type, 2017-2032
Figure 154: MEA Market Volume (Tons) Analysis by Product Type, 2017-2032
Figure 155: MEA Market Value Share (%) and BPS Analysis by Product Type, 2022-2032
Figure 156: MEA Market Y-o-Y Growth (%) Projections by Product Type, 2022-2032
Figure 157: MEA Market Value (US$ Mn) Analysis by Composition, 2017-2032
Figure 158: MEA Market Volume (Tons) Analysis by Composition, 2017-2032
Figure 159: MEA Market Value Share (%) and BPS Analysis by Composition, 2022-2032
Figure 160: MEA Market Y-o-Y Growth (%) Projections by Composition, 2022-2032
Figure 161: MEA Market Value (US$ Mn) Analysis by Application, 2017-2032
Figure 162: MEA Market Volume (Tons) Analysis by Application, 2017-2032
Figure 163: MEA Market Value Share (%) and BPS Analysis by Application, 2022-2032
Figure 164: MEA Market Y-o-Y Growth (%) Projections by Application, 2022-2032
Figure 165: MEA Market Attractiveness by Product Type, 2022-2032
Figure 166: MEA Market Attractiveness by Composition, 2022-2032
Figure 167: MEA Market Attractiveness by Application, 2022-2032
Figure 168: MEA Market Attractiveness by Country, 2022-2032
The overall market size for the Deicing Fluid Market was USD 5,250 Million in 2025.
The Deicing Fluid Market is expected to reach USD 8,560.7 Million in 2035.
The demand is driven by increasing air traffic and airport operations in cold regions, stringent safety regulations for aircraft and runways, growing road maintenance needs during winter, and rising demand from military and commercial aviation sectors.
The top 5 countries driving market growth are the USA, UK, Europe, Japan and South Korea.
The Ethylene Glycol -based deicing fluid segment is expected to command a significant share over the assessment period.
Explore Similar Insights

Thank you!
You will receive an email from our Business Development Manager. Please be sure to check your SPAM/JUNK folder too.