

- Market Size (2026)
- USD 2.4 Bn
- Forecast (2036)
- USD 3.9 Bn
- CAGR (2026 to 2036)
- 4.8%
How big is Golf Cart Market in 2026?
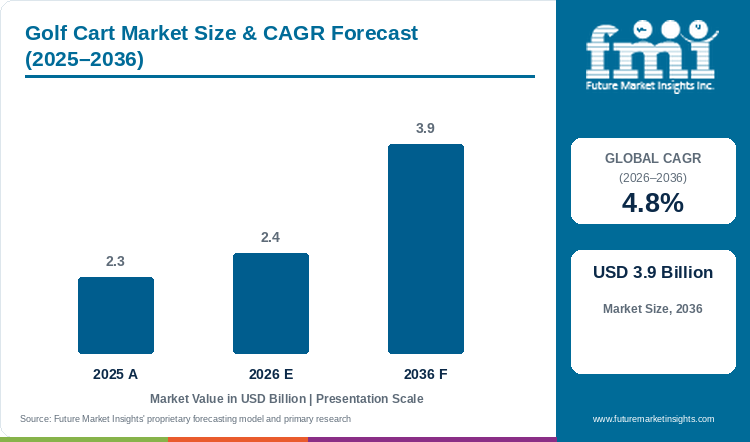
Golf cart industry value stood at USD 2.30 billion in 2025, with an estimated USD 2.41 billion for 2026 and a projected USD 3.86 billion by 2036. CAGR over 2026 to 2036 is 4.8%.
The fleet replacement and electrification demand intensity analysis of the golf cart market ties annual cart procurement to three inputs: the number of active courses and venues operating fleets, the average fleet age relative to a four-to-five-year replacement cycle, and the share of replacements moving from lead-acid to lithium-ion powertrains. Globally, 43.3 million people played 9- or 18-hole golf in 2024, according to the R&A's participation report published in June 2026 [1]. In the United States alone, more than 3.68 million golfers with a Handicap Index posted 82 million scores in 2025, per the USGA [2]. Fleet purchase volumes track these participation figures, because higher round counts accelerate wear on batteries, seats and drive components, shortening the interval before courses re-order.
Suppliers are positioning lithium options as the conversion path for ageing lead-acid fleets. Club Car launched the next-generation Tempo in March 2025 with integrated lithium-ion and lead-acid variants, replacing the Precedent line and adding Automatic Park Brake and StopSmart braking across all powertrains [3]. Yamaha Motor disclosed five-seater electric golf cart models with in-house lithium iron phosphate batteries offering 4 kWh and 6 kWh capacities, and a 30% reduction in power consumption, in March 2025. Columbia Vehicle Group selected Aiken County, South Carolina, for a USD 12.2 million production operation in May 2024, adding 180 jobs to serve domestic fleet orders. FMI expects the lithium share of new fleet deliveries to rise steadily through 2036 as battery costs decline and charging time advantages compress fleet downtime.
Key Market Trends & Insights
- Electric golf carts led the product segment with 95% of demand in 2026. Course operators and resort managers favor the lower noise, fewer emissions and reduced fueling infrastructure of electric drivetrains, and Club Car stated in July 2025 that lithium-ion carts charge up to 40% faster than lead-acid units [4].
- Lithium-ion batteries held about 51% of battery type demand in 2026, overtaking lead-acid as major OEMs default new fleet and personal carts to lithium. Cost-per-cycle economics and established service routines keep lead-acid competitive in budget-focused accounts.
- Golf carts represented 52% of golf cart type demand in 2026. Passenger and utility carts serve resort transport and maintenance tasks but stay smaller by value.
- Two seaters held 40% of seating capacity demand in 2026, matching the standard two-player pairing format used on most courses.
- Direct sales accounted for 55% of sales channel demand in 2026. FMI notes that fleet procurement relies on manufacturer relationships and lease-to-purchase agreements negotiated at the account level.
- Golf clubs held 46% of end-use demand in 2026, with hotels and resorts, airports and private communities making up the balance.
- Standard design accounted for 64% of vehicle-design demand in 2026, as luxury and off-road variants serve niche segments including high-end resort properties and terrain-intensive venues.
Regional Highlights
- India records the fastest profiled CAGR at 8.3% over 2026 to 2036, led by resort, campus and gated community applications.
- China (6.2%) and Germany (5.5%) follow, and France closes the profiled set at 3.7%.
- The R&A reported 10.78 million golfers and 2,176 courses in Japan in 2024, and 2.31 million golfers across 726 courses in Germany [1].
Market Size & Forecast
Table 1: Market Size and Forecast for the Golf Cart Market (USD billion and percentage), 2025 to 2036
| Metric | Value |
|---|---|
| 2025 Market Size | USD 2.30 billion |
| Estimated Market Size in 2026 | USD 2.41 billion |
| Projected Market Size by 2036 | USD 3.86 billion |
| CAGR, 2026 to 2036 | 4.8% |
| Value Added, 2026 to 2036 | USD 1.45 billion |
| Market Expansion Multiple | 1.6x |
Demand for golf carts is sustained by course fleet renewal, the spread of cart-based transport across resorts and gated communities, and the ongoing conversion from lead-acid to lithium-ion battery powertrains. In the United States, the NGF confirmed that rounds played reached a record in 2024 for the third time in four years, maintaining the post-pandemic demand base that keeps fleet utilisation high. NHTSA classifies low-speed vehicles as four-wheeled motor vehicles with a top speed above 20 mph and not exceeding 25 mph, which enables street-legal cart use in retirement communities and resort corridors. However, the cost of lithium conversion and the service burden of maintaining mixed lead-acid and lithium fleets present a near-term constraint, as buyers demand proof of payback before committing to full fleet electrification. FMI projects steady volume growth through 2036 as replacement cycles compress and electrification penetration deepens across price tiers.
Fleet Replacement and Electrification Demand Intensity Evidence
Under the fleet replacement and electrification demand intensity analysis carried out for this report, cart procurement volumes correlate with course fleet age, play intensity and the pace of lithium adoption. The indicators below quantify these inputs across verified reporting years.
Table 2: Fleet Replacement and Electrification Demand Intensity Indicators for the Golf Cart Market (mixed units), mixed reporting years from 2024 to 2026
| Indicator | Data Point | Significance | Source |
|---|---|---|---|
| Global 9/18-hole golfers (2024) | 43.3 million | Sets the baseline of active courses needing fleet capacity | [1] |
| US Handicap Index holders (2025) | 3.68 million, 82 million scores | Higher round counts shorten battery and component life on fleet carts | [2] |
| Lead-acid battery life | 3 to 5 years | Defines the replacement cycle driving repeat fleet orders | - |
| Lithium-ion battery life | 8 to 10 years | Longer life extends replacement intervals but raises upfront cost | - |
| Lithium charging speed advantage | Up to 40% faster than lead-acid | Reduces fleet downtime during peak play windows | - |
| Columbia Vehicle Group Aiken facility | USD 12.2 million, 180 jobs | Adds US-based production to serve domestic fleet procurement | - |
Analyst Perspective
"Fleet operators should evaluate golf carts on total cost of ownership across a full replacement cycle, not on unit price alone. Lithium packs carry higher upfront cost but deliver longer service life, faster turnaround between rounds and lower annual maintenance, which tilts the economics toward conversion as battery prices decline through 2036."
- Nikhil Kaitwade, Principal Consultant, Future Market Insights.
How is the Golf Cart market segmented?
Golf cart market is segmented by seven primary commercial axes and region: product, seating capacity, golf cart type, sales channel, end use, battery type, vehicle design, and region. In 2026, electric golf carts hold 95%, lead acid batteries 58%, direct sales 55%, and golf carts (by type) 52%.
By product: Electric Golf Carts, Gasoline Golf Carts, Hybrid Fuel Carts.
By seating capacity: 2 Seaters, 4 Seaters, 6 Seaters, 8 Seaters.
By golf cart type: Golf Carts, Passenger Carts, Utility Carts.
By sales channel: Direct Sales, Retail Sales, Online Sales.
By end use: Golf Clubs, Hotels and Resorts, Housing Projects, Airports, Recreational Industries, Private Communities, Others.
By battery type: Lead Acid Batteries, Lithium Ion Batteries, Others (including Solid State Batteries).
By vehicle design: Standard Design, Luxury Design, Off Road Design.
By region: North America, Latin America, Western Europe, Eastern Europe, East Asia, South Asia and Pacific, and Middle East and Africa.
Why do electric golf carts retain a 95% product share?
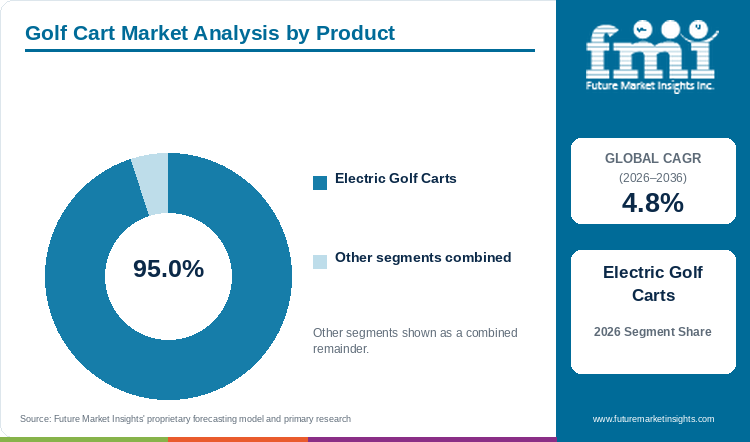
Electric golf carts hold 95% of product demand in 2026, sustained by course operator preferences for quieter operation, lower per-round fuel cost and simpler drivetrains.
Table 3: Product Share for the Golf Cart Market (percentage share), 2026
| Product | Share (2026) |
|---|---|
| Electric Golf Carts | 95% |
| Other Segments Combined | 5%* |
| Total | 100% |
*Represents the combined share of all remaining product segments in 2026.
Table 4: Product Leadership and Market Growth for the Golf Cart Market (segment and CAGR percentage), 2026 to 2036
| Metric | Value |
|---|---|
| Global CAGR (2026 to 2036) | 4.8% |
| Leading Segment | Electric Golf Carts |
In the FMI report, electric golf carts account for 95% of product demand in 2026, reflecting two decades of fleet migration away from gasoline engines. Yamaha Motor launched five-seater electric models in March 2025 with in-house LFP batteries offering 4 kWh and 6 kWh options and approximately 30% lower power consumption than prior generations [5]. Gasoline and hybrid carts serve a narrow residual segment when charging infrastructure is unavailable or terrain demands higher sustained torque. The fleet replacement and electrification demand intensity analysis points to lithium-ion adoption as the next conversion within the electric category, paralleling trends in the broader electric vehicle battery supply chain.
- Electric golf carts account for 95% share in 2026, as course operators standardise on electric drivetrains that align with noise ordinances and on-site solar charging installations.
- Gasoline models persist when off-grid courses or utility applications require extended range without access to charging facilities.
What positions lithium-ion batteries at about 51% of battery type demand?
Lithium-ion batteries now account for about 51% of battery type demand in 2026, as major OEMs default new fleet and personal carts to lithium, with lead-acid retaining the remainder on lower upfront cost and established maintenance routines.
Lithium-ion batteries now hold the majority share, as major OEMs ship lithium as the default on new fleet and personal carts, even though a typical lead-acid pack still costs less to procure and fits existing charging setups without infrastructure modification. Club Car stated in July 2025 that lithium-ion packs charge up to 40% faster than lead-acid, which matters during peak-season turnarounds between morning and afternoon tee times. Lithium-ion battery life also extends to 8 to 10 years versus 3 to 5 years for lead-acid, which shifts total cost of ownership in favour of lithium over a full replacement cycle.
- Lithium-ion batteries hold about 51% share in 2026, as fleet managers increasingly favor the higher cycle-life economics of lithium, though smaller courses still weigh upfront lead-acid savings.
- Lithium-ion is gaining fastest in resort and private-community fleets, as daily charging windows are tight and range requirements exceed single-round distances.
How does the 2-seater configuration hold 40% of seating capacity demand?
Two-seater carts account for 40% of seating capacity demand in 2026, matching the standard two-golfer pairing format that most courses schedule.
Course tee sheets pair golfers in twos and fours, and the two-seat cart matches the most common booking unit. Four-seater and six-seater configurations serve resort transport and private-community mobility when passenger count per trip is higher. As per the fleet replacement and electrification demand intensity analysis, two-seater fleet orders correlate directly with course round volumes, since each cart serves one pairing per round and returns for recharging.
- Two seaters hold 40% share in 2026, aligned with standard course pairing formats.
- Larger configurations gain share in resort and community applications as per-trip occupancy is higher.
Why does the direct sales channel represent 55% of golf cart distribution?
Direct sales hold 55% of sales channel demand in 2026, reflecting the importance of manufacturer-to-operator fleet contracts and lease agreements in large-volume procurement.
Fleet procurement in the golf cart market operates differently from consumer vehicle retail. Courses and resort groups negotiate multi-year contracts directly with manufacturers such as Club Car, Yamaha and Textron, covering supply, financing, service and trade-in terms. Retail and online channels serve individual buyers and small commercial accounts. The fleet replacement and electrification demand intensity analysis shows that direct-channel transactions carry larger average order values because direct deals bundle carts, batteries, chargers and service agreements.
- Direct sales account for 55% share in 2026, anchored by institutional fleet procurement.
- Online sales are growing from a small base, serving the personal-use and neighbourhood electric vehicle segments.
What are the drivers, restraints, and opportunities in the Golf Cart market?
Course fleet renewal and rising play volumes drive replacement ordering across all regions. Battery service cost and the split economics of lead-acid versus lithium constrain conversion speed. Low-speed vehicle legislation in residential and resort communities opens a new application corridor for street-legal carts.
- Driver: Fleet renewal cycles of four to five years at high-volume courses sustain annual procurement, and record participation levels in the United States keep cart utilisation above pre-pandemic rates.
- Restraint: Lithium-ion packs require higher upfront investment, and fleet operators managing mixed lead-acid and lithium inventories face parallel maintenance and charging infrastructure costs.
- Opportunity: NHTSA low-speed vehicle classification and equivalent local frameworks enable street-legal cart use in retirement communities, resort corridors and campus environments, widening addressable demand beyond traditional course fleets.
Course fleet renewal sustains procurement volumes
FMI finds that demand for golf carts tracks course fleet age and play intensity. A four-to-five-year replacement cycle is standard at high-utilisation courses, and accelerating round counts compress this interval. The USGA reported that 82 million scores were posted in the United States in 2025, up from already elevated post-pandemic levels [2]. Each round adds wear to batteries, tyres and seats, and courses operating above capacity during peak seasons face pressure to maintain fleet availability. Fleet replacement orders account for the majority of annual industry shipments, and the golf equipment spending trend supports broader course-level capital expenditure.
Battery service cost divides fleet conversion decisions
Sales of golf carts into the lithium segment are constrained by the payback period that fleet managers require before approving conversion. A lead-acid battery pack lasts 3 to 5 years and costs less to replace, though a lithium-ion pack offers 8 to 10 years of service but demands a higher initial outlay. Courses operating mixed fleets face the added burden of maintaining two charging systems and two spare-parts inventories. Club Car's January 2024 statement that lithium-ion charges up to 40% faster than lead-acid has accelerated adoption, but procurement committees at smaller courses still require documented total-cost-of-ownership evidence before switching.
Low-speed vehicle legislation opens community and resort corridors
Growth in fleet electrification extends beyond the course perimeter. NHTSA defines a low-speed vehicle as a four-wheeled motor vehicle with a top speed above 20 mph and not exceeding 25 mph on a paved level surface, permitting compliant carts on designated public roads. Florida retirement communities and Georgia resort corridors already operate cart networks under these rules. Club Car's CRU Lithium, launched in July 2025 as a street-legal neighbourhood electric vehicle, targets this corridor with faster charging and extended range. The low speed vehicle regulatory framework is expected to widen as more municipalities adopt cart-friendly ordinances.
Which country CAGRs are profiled in the Golf Cart market?
Table 5: Country CAGR Comparison for the Golf Cart Market (CAGR percentage), 2026 to 2036
| Country | CAGR |
|---|---|
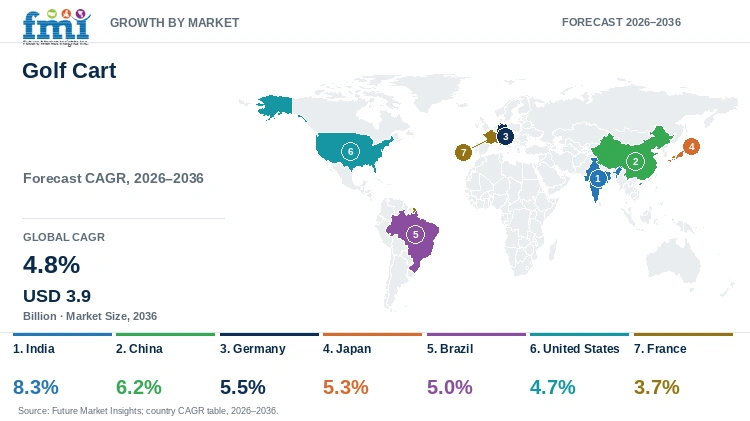
| India | 8.3% |
| China | 6.2% |
| Germany | 5.5% |
| Japan | 5.3% |
| Brazil | 5% |
| United States | 4.7% |
| France | 3.7% |
How do country-level CAGRs compare in the Golf Cart market?
Adoption of electric golf carts varies by installed course base, resort infrastructure and regulatory openness to low-speed vehicles. FMI's fleet replacement and electrification demand intensity analysis segments the profiled countries into high-growth emerging markets, adding fleet capacity through resort, campus and community applications, and mature markets, sustained by replacement cycles and electrification conversion. India leads at 8.3%, and France stands at 3.7%.
- India demand gains from resort, campus and gated community projects in Bengaluru, Goa and Delhi NCR. The R&A reported 185,500 golfers across 289 courses in India in 2024 [1].
- China demand gains from tourism sites and industrial park transport in Hainan and Guangdong. The R&A counted 1.0 million golfers and 601 courses in 2024 [1].
- Germany demand gains from high golf participation and premium fleet replacement. The R&A reported 2.31 million golfers and 726 courses in 2024, with 41% female participation among adults [1].
- Japan demand gains from mature fleet replacement with quieter electric units across 2,176 courses. The R&A counted 10.78 million golfers in 2024 [1].
- Brazil demand gains from resort and gated community projects in Sao Paulo and Rio de Janeiro. The R&A reported 15,500 golfers and 101 courses in 2024 [1].
- United States demand gains from large installed fleets and community vehicle use. USGA data show 3.68 million Handicap Index holders posting 82 million scores in 2025 [2].
- France demand gains from steady replacement in a mature market. The R&A counted 1.68 million golfers across 687 courses in 2024 [1].
Full report country CAGRs cover: North America; Latin America; Western Europe; Eastern Europe; East Asia; South Asia and Pacific; Middle East and Africa.
Country-wise Analysis
- Golf cart demand in India is set to advance at 8.3% CAGR through 2036. The R&A identified 185,500 golfers playing 9- or 18-hole rounds across 289 courses in India in 2024 [1]. Resort properties in Goa, tech campuses in Bengaluru and gated communities in Delhi NCR are adding fleet capacity in locations that had none previously. Cart procurement in these non-course applications is expected to broaden the Indian golf cart market over the forecast period.
- China's golf cart market is forecast to register 6.2% CAGR through 2036. The R&A reported 1.0 million golfers and 601 courses in 2024, with Hainan resorts and Guangdong manufacturing zones representing both demand centres and supply hubs [1]. Domestic manufacturers including Xiamen Dalle and Marshell Green Power serve local fleet operators at price points below those of imported brands. Battery component supply chains in Guangdong and Zhejiang are expected to support volume production of lithium-equipped carts for both domestic and export markets.
- Germany's golf cart market is anticipated to record 5.5% CAGR through 2036. The country's 2.31 million golfers across 726 courses make Germany one of the largest European markets by active player base [1]. Premium electric fleet replacement is underway at Bavaria resort courses and North Rhine-Westphalia clubs, and buyers there scrutinise battery warranties and dealer service networks. Demand favours quiet operation and long battery life under variable seasonal conditions.
- A 5.3% CAGR through 2036 is projected for Japan's golf cart market. With 10.78 million golfers and 2,176 courses, Japan operates one of the densest course networks globally [1]. Yamaha Motor, headquartered in Japan, launched five-seater electric models with in-house LFP batteries in March 2025, targeting domestic fleet renewal. Mature fleets on sloped terrain in Shizuoka and high-frequency corridors in Chiba are expected to sustain replacement demand for quieter, more efficient electric units.
- Brazil's golf cart market is predicted to expand at 5% CAGR through 2036. The R&A counted 15,500 golfers and 101 courses in 2024, a small base that leaves room for capacity additions [1]. Resort hotels in Rio de Janeiro and gated residential communities in Santa Catarina are the primary non-course applications. Growth from a low starting point is expected to outpace mature markets in percentage terms even as absolute volumes remain modest.
- The United States golf cart market is estimated to grow at 4.7% CAGR through 2036. More than 3.68 million golfers with a Handicap Index posted 82 million scores in 2025, sustaining fleet utilisation at high levels [2]. Community vehicle use in Florida retirement towns and Georgia resort corridors adds to course fleet demand. Columbia Vehicle Group's USD 12.2 million Aiken County facility, announced in May 2024, adds domestic production capacity oriented toward fleet fulfilment.
- France's golf cart market is forecast to post 3.7% CAGR through 2036. The R&A identified 1.68 million golfers and 687 courses in 2024 [1]. Replacement cycles in Ile-de-France clubs and Provence resort courses support steady, not rapid, procurement. Winter battery performance remains a purchase consideration for northern courses, and operators weighing lithium conversion demand documented cold-weather range data before committing.
Who are the notable companies in the Golf Cart market?
Club Car LLC, Yamaha Golf-Car Company, Textron Specialized Vehicles Inc., Columbia Vehicle Group Inc., Xiamen Dalle Electric Car Co. Ltd., Maini Materials Movement Pvt. Ltd., Marshell Green Power Co. Ltd., Cruise Car Inc., Garia A/S, and Polaris Inc. are among the companies operating in this market.
Competition centres on fleet access, dealer network reach and battery service capability. Club Car maintains broad fleet relationships across course operators and resort groups, supported by a global dealer network. Yamaha Golf-Car and E-Z-GO (Textron) compete on proven fleet reliability and long-standing dealer presence. Regional manufacturers serve local price-sensitive accounts with shorter supply chains.
- Global fleet suppliers: Club Car LLC, Yamaha Golf-Car Company, Textron Specialized Vehicles Inc., Columbia Vehicle Group Inc.
- Regional electric vehicle manufacturers: Xiamen Dalle Electric Car Co. Ltd., Maini Materials Movement Pvt. Ltd., Marshell Green Power Co. Ltd., Cruise Car Inc.
- Luxury and specialty participants: Garia A/S, Polaris Inc.
Competitive Benchmarking: Golf Cart Market
Table 6: Competitive Benchmarking for the Golf Cart Market (qualitative capability ratings), 2026
| Company | Course Fleet Access | Battery Service | Dealer Reach | Geographic Footprint |
|---|---|---|---|---|
| Club Car LLC | High | High | Large | Global |
| Yamaha Golf-Car Company | High | Moderate | Large | Global |
| Textron Specialized Vehicles | High | Moderate | Large | Global |
| Columbia Vehicle Group | Moderate | Moderate | Moderate | North America |
| Garia A/S | Moderate | High | Limited | Europe and North America |
| Maini Materials Movement | Moderate | Moderate | Moderate | India |
| Xiamen Dalle Electric Car | Moderate | Moderate | Moderate | China |
Ratings reflect the breadth of documented fleet contracts, service programmes and distribution networks. High indicates wide fleet supply and service coverage, Moderate indicates selective or regional coverage, and Low or Limited indicates narrower direct evidence.
Key Developments in the Golf Cart Market
- In July 2025, Club Car launched the CRU Lithium, a street-legal neighbourhood electric vehicle with lithium-ion battery, faster charging and extended range, available through authorised dealers.
- In May 2025, E-Z-GO was designated the official golf car of the 150th Preakness Stakes at Pimlico Race Course, supplying 50 golf cars and Cushman utility vehicles.
- In March 2025, Club Car introduced the next-generation Tempo with Automatic Park Brake, StopSmart braking technology and integrated lithium-ion battery options, replacing the Precedent line [3].
- In March 2025, Yamaha Motor launched five-seater electric golf cars with in-house lithium iron phosphate batteries offering 4 kWh and 6 kWh capacities.
Key Players in the Golf Cart Market
Global Fleet Suppliers
- Club Car LLC
- Yamaha Golf-Car Company
- Textron Specialized Vehicles Inc.
- Columbia Vehicle Group Inc.
Regional Electric Vehicle Manufacturers
- Xiamen Dalle Electric Car Co. Ltd.
- Maini Materials Movement Pvt. Ltd.
- Marshell Green Power Co. Ltd.
- Cruise Car Inc.
Luxury and Specialty Participants
- Garia A/S
- Polaris Inc.
Golf Cart Market - Report Scope
Table 7: Report Scope for the Golf Cart Market (coverage fields and definitions), 2026 to 2036
| Coverage field | Report scope |
|---|---|
| Market breakdown | Product; seating capacity; golf cart type; sales channel; end use; battery type; vehicle design; region |
| Quantitative units | USD billion |
| Market definition | Revenue from the sale of new small motorised vehicles designed for golf course transport and low-speed movement on private or controlled sites, including electric, gasoline and hybrid carts with two to eight seats. Covers golf carts, passenger carts and utility carts sold through direct, retail and online channels to golf clubs, hotels, resorts, airports, housing projects, private communities and recreational facilities. Excludes full-size passenger cars, all-terrain vehicles, heavy utility trucks, scooters, bicycles, electric motorcycles, construction site buggies and aftermarket accessories sold without a complete cart. |
| Regions covered | North America; Latin America; Western Europe; Eastern Europe; East Asia; South Asia and Pacific; Middle East and Africa |
| Countries covered | United States; China; Germany; Japan; India; Brazil; France |
| Key companies profiled | Club Car LLC; Yamaha Golf-Car Company; Textron Specialized Vehicles Inc.; Columbia Vehicle Group Inc.; Xiamen Dalle Electric Car Co. Ltd.; Maini Materials Movement Pvt. Ltd.; Marshell Green Power Co. Ltd.; Cruise Car Inc.; Garia A/S; Polaris Inc. |
| Forecast period | 2026 to 2036 |
| Approach | The model ties bottom-up volumes to top-down estimates, reconciling manufacturer shipments, fleet lease data, distributor sales and end-use procurement within the defined revenue boundary. |
Golf Cart Market - Research Methodology
Table 8: Research Methodology for the Golf Cart Market (research methods and approach), 2026 edition
| Method | Approach |
|---|---|
| Primary Research | Interviews with fleet procurement managers at golf courses, resorts and community operators, supplemented by input from manufacturer sales teams and battery suppliers. |
| Desk Research | Review of manufacturer product catalogues, trade association participation data (R&A, USGA, NGF), regulatory filings (NHTSA) and financial disclosures from publicly traded companies. |
| Market Sizing and Forecasting | Bottom-up build from fleet size estimates by course type and region, cross-checked against manufacturer shipment data and distributor sell-through. Top-down validation against published industry participation and course count figures. |
| Data Validation | Triangulation across primary interviews, manufacturer disclosures and third-party participation data. Segment shares and country CAGRs tested against reported company results and regional fleet age distributions. |
Golf Cart Market by Segments
Golf Cart Market segmented by Product:
- Electric Golf Carts
- Gasoline Golf Carts
- Hybrid Fuel Carts
Golf Cart Market segmented by Seating Capacity:
- 2 Seaters
- 4 Seaters
- 6 Seaters
- 8 Seaters
Golf Cart Market segmented by Golf Cart Type:
- Golf Carts
- Passenger Carts
- Utility Carts
Golf Cart Market segmented by Sales Channel:
- Direct Sales
- Retail Sales
- Online Sales
Golf Cart Market segmented by End Use:
- Golf Clubs
- Hotels and Resorts
- Housing Projects
- Airports
- Recreational Industries
- Private Communities
- Others
Golf Cart Market segmented by Battery Type:
- Lead Acid Batteries
- Lithium Ion Batteries
- Others
Golf Cart Market segmented by Vehicle Design:
- Standard Design
- Luxury Design
- Off Road Design
Golf Cart Market by Region
- North America
- United States
- Canada
- Latin America
- Brazil
- Mexico
- Argentina
- Chile
- Western Europe
- Germany
- France
- United Kingdom
- Italy
- Spain
- Benelux
- Nordics
- Eastern Europe
- Poland
- Czech Republic
- Romania
- Hungary
- East Asia
- China
- Japan
- South Korea
- South Asia and Pacific
- India
- ASEAN
- Australia and New Zealand
- Middle East and Africa
- GCC Countries
- South Africa
- Turkiye
- Israel
Research Sources and Bibliography
- [1] The R&A. (2026, June 4). Junior golf growth helps drive sustained increase in global participation. https://www.randa.org/articles/junior-golf-growth-helps-drive-sustained-increase-in-global-participation
- [2] USGA. (2026, January 20). Golf participation boomed in 2025: more than 82 million rounds posted. https://www.usga.org/content/usga/home-page/articles/2026/01/golf-boomed-2025-more-than-82-million-rounds-posted.html
- [3] Club Car. (2025, March 20). Club Car raises the bar again with next-gen Tempo golf car. https://www.clubcar.com/en/club-car-raises-the-bar-again-with-next-gen-tempo-car
- [4] Club Car. (2025, July 10). Club Car launches CRU lithium-ion option. https://www.clubcar.com/en/our-company/news/club-car-launches-cru-lithium-ion-option
- [5] Yamaha Motor. (2025, March 5). Yamaha Motor launches new five-seater electric golf cars with new in-house battery technology. https://global.yamaha-motor.com/news/2025/0305/gc.html
- [6] South Carolina Governor's Office. (2024, May 7). Columbia Vehicle Group selects Aiken County for first South Carolina operation. https://www.governor.sc.gov/node/3761
- [7] Club Car. (2024, January). Lithium-ion carts charge up to 40% faster than lead-acid. https://www.clubcar.com/en/our-company/news/club-car-launches-cru-lithium-ion-option
- [8] IEA. (2025, May). Global EV Outlook 2025: electric vehicle batteries. https://www.iea.org/reports/global-ev-outlook-2025/electric-vehicle-batteries
- [9] National Golf Foundation. (2025, January 30). Rounds played summary. https://www.ngf.org/rounds-played-summary
- [10] NHTSA. Low-speed vehicle classification: four-wheeled motor vehicle with top speed above 20 mph and not exceeding 25 mph. https://www.nhtsa.gov/interpretations/19123ztv
- [11] C2 Vehicles. Golf course fleet carts planning guide. https://c2vehicles.com/blogs/news/golf-course-fleet-carts-planning-guide
- [12] Golf Course Industry. (2025, May). E-Z-GO named official golf car of the 150th Preakness Stakes. https://www.golfcourseindustry.com/news/e-z-go-preakness-stakes
- [13] The R&A. (2025, June). Golf around the world 2024: country-level participation data. https://www.randa.org/articles/junior-golf-growth-helps-drive-sustained-increase-in-global-participation
- [14] Yamaha Motor. (2025, March 25). 50 years of Yamaha golf cars. https://global.yamaha-motor.com/news/2025/0325/newsletter.html
- [15] Electrek. (2025, July 11). Club Car's 25 mph CRU microcar just went modern. https://electrek.co/2025/07/11/club-cars-25-mph-living-room-on-wheels-microcar-just-went-modern/
- [16] Area Development. (2024, May 9). Columbia Vehicle Group plans Aiken, South Carolina, production operations. https://www.areadevelopment.com/newsItems/5-9-2024/columbia-vehicle-group-aiken-south-carolina.shtml
This Report Answers
- How big is the golf cart market during 2026?
- What value is projected by 2036?
- Which product leads by share?
- Which battery type leads by share?
- Which countries show the fastest growth?
- Which companies lead the market?
Frequently Asked Questions
How large is the Golf Cart market expected in 2026?
FMI analysis places the golf cart market at USD 2.41 billion in 2026, with projected growth to USD 3.86 billion by 2036. This reflects continued fleet renewal demand across course operators, resorts and community applications.
What CAGR is projected for the Golf Cart market through 2036?
A 4.8% CAGR from 2026 to 2036 drives the golf cart market forecast. Fleet replacement cycles of four to five years and the ongoing conversion from lead-acid to lithium-ion powertrains underpin this rate.
Which product holds the leading market share in 2026?
Electric golf carts account for 95% of product demand in 2026. Course operators and resort managers have standardised on electric drivetrains for quieter operation, lower per-round cost and simpler maintenance routines.
Which battery type holds the leading share in 2026?
Lithium-ion batteries hold about 51% of battery type demand in 2026, as charging speed and cycle-life economics increasingly justify conversion, although lead-acid retains a meaningful share on lower upfront cost and established maintenance routines.
Which country has the strongest expansion outlook through 2036?
FMI attributes India's lead, the fastest profiled CAGR at 8.3% over 2026 to 2036, to resort properties, tech campuses and gated communities adding fleet capacity in a market that the R&A measured at 185,500 golfers and 289 courses in 2024.
Who are the key companies in the Golf Cart market?
Profiled companies include Club Car LLC, Yamaha Golf-Car Company, Textron Specialized Vehicles Inc., Columbia Vehicle Group Inc., Xiamen Dalle Electric Car Co. Ltd., Maini Materials Movement Pvt. Ltd., Marshell Green Power Co. Ltd., Cruise Car Inc., Garia A/S and Polaris Inc.
Preview the report firsthand - request a free sample
Get SampleGet the brochure for pricing and purchase details.
Get PDFTable of Content
- Key Takeaways
- Market Size and CAGR
- Top Growth Driver
- Fastest Growing Segment
- Leading Region
- Key Companies
- Emerging Opportunities
- Executive Summary
- Global Market Outlook
- Demand-side Trends
- Supply-side Trends
- Technology Roadmap Analysis
- Analysis and Recommendations
- Analyst Perspective (What is happening? Why now? What should investors know?)
- Key Questions Answered
- How large is the market?
- What is the CAGR?
- What are key trends?
- Which region dominates?
- Who are the leaders?
- Market Overview
- Market Coverage / Taxonomy
- Market Definition / Scope / Limitations
- Research Methodology
- Chapter Orientation
- Analytical Lens and Working Hypotheses
- Market Structure, Signals, and Trend Drivers
- Benchmarking and Cross-market Comparability
- Market Sizing, Forecasting, and Opportunity Mapping
- Research Design and Evidence Framework
- Desk Research Programme (Secondary Evidence)
- Expert Input and Fieldwork (Primary Evidence)
- Tooling, Models, and Reference Databases
- Data Engineering and Model Build
- Quality Assurance and Audit Trail
- Market Background
- Market Dynamics (Drivers, Restraints, Opportunity, Trends)
- Scenario Forecast (Optimistic, Likely, Conservative)
- Impact Analysis
- AI Impact
- Sustainability Impact
- Regulatory Impact
- Technology Impact
- Consumer / Buyer Analysis
- Purchase Drivers
- Adoption Barriers
- Buyer Journey
- Opportunity Map Analysis
- Product Life Cycle Analysis
- Supply Chain Analysis
- Investment Feasibility Matrix
- Value Chain Analysis
- PESTLE and Porter's Analysis
- Regulatory Landscape
- Regional Parent Market Outlook
- Production and Consumption Statistics
- Import and Export Statistics
- Global Market Analysis and Forecast, 2021 to 2036
- Historical Market Size Value (USD Billion) Analysis, 2021 to 2025
- Current and Future Market Size Value (USD Billion) Projections, 2026 to 2036
- Y-o-Y Growth Trend Analysis
- Absolute $ Opportunity Analysis
- Global Market Pricing Analysis, 2021 to 2036
- Global Market Analysis and Forecast, By Product, 2021 to 2036
- Introduction / Key Findings
- Historical Market Size Value (USD Billion) Analysis By Product, 2021 to 2025
- Current and Future Market Size Value (USD Billion) Analysis and Forecast By Product, 2026 to 2036
- Electric Golf Carts
- Gasoline Golf Carts
- Hybrid Fuel Carts
- Y-o-Y Growth Trend Analysis By Product, 2021 to 2025
- Absolute $ Opportunity Analysis By Product, 2026 to 2036
- Global Market Analysis and Forecast, By Seating Capacity, 2021 to 2036
- Introduction / Key Findings
- Historical Market Size Value (USD Billion) Analysis By Seating Capacity, 2021 to 2025
- Current and Future Market Size Value (USD Billion) Analysis and Forecast By Seating Capacity, 2026 to 2036
- 2 Seaters
- 4 Seaters
- 6 Seaters
- 8 Seaters
- Y-o-Y Growth Trend Analysis By Seating Capacity, 2021 to 2025
- Absolute $ Opportunity Analysis By Seating Capacity, 2026 to 2036
- Global Market Analysis and Forecast, By Golf Cart Type, 2021 to 2036
- Introduction / Key Findings
- Historical Market Size Value (USD Billion) Analysis By Golf Cart Type, 2021 to 2025
- Current and Future Market Size Value (USD Billion) Analysis and Forecast By Golf Cart Type, 2026 to 2036
- Golf Carts
- Passenger Carts
- Utility Carts
- Y-o-Y Growth Trend Analysis By Golf Cart Type, 2021 to 2025
- Absolute $ Opportunity Analysis By Golf Cart Type, 2026 to 2036
- Global Market Analysis and Forecast, By Sales Channel, 2021 to 2036
- Introduction / Key Findings
- Historical Market Size Value (USD Billion) Analysis By Sales Channel, 2021 to 2025
- Current and Future Market Size Value (USD Billion) Analysis and Forecast By Sales Channel, 2026 to 2036
- Direct Sales
- Retail Sales
- Online Sales
- Y-o-Y Growth Trend Analysis By Sales Channel, 2021 to 2025
- Absolute $ Opportunity Analysis By Sales Channel, 2026 to 2036
- Global Market Analysis and Forecast, By End Use, 2021 to 2036
- Introduction / Key Findings
- Historical Market Size Value (USD Billion) Analysis By End Use, 2021 to 2025
- Current and Future Market Size Value (USD Billion) Analysis and Forecast By End Use, 2026 to 2036
- Golf Clubs
- Hotels and Resorts
- Housing Projects
- Airports
- Recreational Industries
- Private Communities
- Others
- Y-o-Y Growth Trend Analysis By End Use, 2021 to 2025
- Absolute $ Opportunity Analysis By End Use, 2026 to 2036
- Global Market Analysis and Forecast, By Battery Type, 2021 to 2036
- Introduction / Key Findings
- Historical Market Size Value (USD Billion) Analysis By Battery Type, 2021 to 2025
- Current and Future Market Size Value (USD Billion) Analysis and Forecast By Battery Type, 2026 to 2036
- Lead Acid Batteries
- Lithium Ion Batteries
- Others
- Y-o-Y Growth Trend Analysis By Battery Type, 2021 to 2025
- Absolute $ Opportunity Analysis By Battery Type, 2026 to 2036
- Global Market Analysis and Forecast, By Vehicle Design, 2021 to 2036
- Introduction / Key Findings
- Historical Market Size Value (USD Billion) Analysis By Vehicle Design, 2021 to 2025
- Current and Future Market Size Value (USD Billion) Analysis and Forecast By Vehicle Design, 2026 to 2036
- Standard Design
- Luxury Design
- Off Road Design
- Y-o-Y Growth Trend Analysis By Vehicle Design, 2021 to 2025
- Absolute $ Opportunity Analysis By Vehicle Design, 2026 to 2036
- Global Market Analysis and Forecast, By Region, 2021 to 2036
- Introduction
- Historical Market Size Value (USD Billion) Analysis By Region, 2021 to 2025
- Current Market Size Value (USD Billion) Analysis and Forecast By Region, 2026 to 2036
- North America
- Latin America
- Western Europe
- Eastern Europe
- East Asia
- South Asia and Pacific
- Middle East and Africa
- Market Attractiveness Analysis By Region
- North America Market Analysis and Forecast, By Country, 2021 to 2036
- Historical Market Size Value (USD Billion) Trend Analysis By Market Taxonomy, 2021 to 2025
- Market Size Value (USD Billion) Forecast By Market Taxonomy, 2026 to 2036
- By Country
- United States
- Canada
- By Product
- By Seating Capacity
- By Golf Cart Type
- By Sales Channel
- By End Use
- By Battery Type
- By Vehicle Design
- By Country
- Market Attractiveness Analysis
- By Country
- By Product
- By Seating Capacity
- By Golf Cart Type
- By Sales Channel
- By End Use
- By Battery Type
- By Vehicle Design
- Key Takeaways
- Latin America Market Analysis and Forecast, By Country
- Historical Market Size Value (USD Billion) Trend Analysis By Market Taxonomy, 2021 to 2025
- Market Size Value (USD Billion) Forecast By Market Taxonomy, 2026 to 2036
- By Country
- Brazil
- Mexico
- Argentina
- Chile
- By Product
- By Seating Capacity
- By Golf Cart Type
- By Sales Channel
- By End Use
- By Battery Type
- By Vehicle Design
- By Country
- Market Attractiveness Analysis
- By Country
- By Product
- By Seating Capacity
- By Golf Cart Type
- By Sales Channel
- By End Use
- By Battery Type
- By Vehicle Design
- Key Takeaways
- Western Europe Market Analysis and Forecast, By Country
- Historical Market Size Value (USD Billion) Trend Analysis By Market Taxonomy, 2021 to 2025
- Market Size Value (USD Billion) Forecast By Market Taxonomy, 2026 to 2036
- By Country
- Germany
- France
- United Kingdom
- Italy
- Spain
- Benelux
- Nordics
- By Product
- By Seating Capacity
- By Golf Cart Type
- By Sales Channel
- By End Use
- By Battery Type
- By Vehicle Design
- By Country
- Market Attractiveness Analysis
- By Country
- By Product
- By Seating Capacity
- By Golf Cart Type
- By Sales Channel
- By End Use
- By Battery Type
- By Vehicle Design
- Key Takeaways
- Eastern Europe Market Analysis and Forecast, By Country
- Historical Market Size Value (USD Billion) Trend Analysis By Market Taxonomy, 2021 to 2025
- Market Size Value (USD Billion) Forecast By Market Taxonomy, 2026 to 2036
- By Country
- Poland
- Czech Republic
- Romania
- Hungary
- By Product
- By Seating Capacity
- By Golf Cart Type
- By Sales Channel
- By End Use
- By Battery Type
- By Vehicle Design
- By Country
- Market Attractiveness Analysis
- By Country
- By Product
- By Seating Capacity
- By Golf Cart Type
- By Sales Channel
- By End Use
- By Battery Type
- By Vehicle Design
- Key Takeaways
- East Asia Market Analysis and Forecast, By Country
- Historical Market Size Value (USD Billion) Trend Analysis By Market Taxonomy, 2021 to 2025
- Market Size Value (USD Billion) Forecast By Market Taxonomy, 2026 to 2036
- By Country
- China
- Japan
- South Korea
- By Product
- By Seating Capacity
- By Golf Cart Type
- By Sales Channel
- By End Use
- By Battery Type
- By Vehicle Design
- By Country
- Market Attractiveness Analysis
- By Country
- By Product
- By Seating Capacity
- By Golf Cart Type
- By Sales Channel
- By End Use
- By Battery Type
- By Vehicle Design
- Key Takeaways
- South Asia and Pacific Market Analysis and Forecast, By Country
- Historical Market Size Value (USD Billion) Trend Analysis By Market Taxonomy, 2021 to 2025
- Market Size Value (USD Billion) Forecast By Market Taxonomy, 2026 to 2036
- By Country
- India
- ASEAN
- Australia and New Zealand
- By Product
- By Seating Capacity
- By Golf Cart Type
- By Sales Channel
- By End Use
- By Battery Type
- By Vehicle Design
- By Country
- Market Attractiveness Analysis
- By Country
- By Product
- By Seating Capacity
- By Golf Cart Type
- By Sales Channel
- By End Use
- By Battery Type
- By Vehicle Design
- Key Takeaways
- Middle East and Africa Market Analysis and Forecast, By Country
- Historical Market Size Value (USD Billion) Trend Analysis By Market Taxonomy, 2021 to 2025
- Market Size Value (USD Billion) Forecast By Market Taxonomy, 2026 to 2036
- By Country
- GCC Countries
- South Africa
- Turkiye
- Israel
- By Product
- By Seating Capacity
- By Golf Cart Type
- By Sales Channel
- By End Use
- By Battery Type
- By Vehicle Design
- By Country
- Market Attractiveness Analysis
- By Country
- By Product
- By Seating Capacity
- By Golf Cart Type
- By Sales Channel
- By End Use
- By Battery Type
- By Vehicle Design
- Key Takeaways
- Key Countries Market Analysis
- United States
- Pricing Analysis
- Market Share Analysis, 2025
- By Product
- By Seating Capacity
- By Golf Cart Type
- By Sales Channel
- By End Use
- By Battery Type
- By Vehicle Design
- Canada
- Pricing Analysis
- Market Share Analysis, 2025
- By Product
- By Seating Capacity
- By Golf Cart Type
- By Sales Channel
- By End Use
- By Battery Type
- By Vehicle Design
- Mexico
- Pricing Analysis
- Market Share Analysis, 2025
- By Product
- By Seating Capacity
- By Golf Cart Type
- By Sales Channel
- By End Use
- By Battery Type
- By Vehicle Design
- Brazil
- Pricing Analysis
- Market Share Analysis, 2025
- By Product
- By Seating Capacity
- By Golf Cart Type
- By Sales Channel
- By End Use
- By Battery Type
- By Vehicle Design
- Chile
- Pricing Analysis
- Market Share Analysis, 2025
- By Product
- By Seating Capacity
- By Golf Cart Type
- By Sales Channel
- By End Use
- By Battery Type
- By Vehicle Design
- Germany
- Pricing Analysis
- Market Share Analysis, 2025
- By Product
- By Seating Capacity
- By Golf Cart Type
- By Sales Channel
- By End Use
- By Battery Type
- By Vehicle Design
- United Kingdom
- Pricing Analysis
- Market Share Analysis, 2025
- By Product
- By Seating Capacity
- By Golf Cart Type
- By Sales Channel
- By End Use
- By Battery Type
- By Vehicle Design
- Italy
- Pricing Analysis
- Market Share Analysis, 2025
- By Product
- By Seating Capacity
- By Golf Cart Type
- By Sales Channel
- By End Use
- By Battery Type
- By Vehicle Design
- Spain
- Pricing Analysis
- Market Share Analysis, 2025
- By Product
- By Seating Capacity
- By Golf Cart Type
- By Sales Channel
- By End Use
- By Battery Type
- By Vehicle Design
- France
- Pricing Analysis
- Market Share Analysis, 2025
- By Product
- By Seating Capacity
- By Golf Cart Type
- By Sales Channel
- By End Use
- By Battery Type
- By Vehicle Design
- India
- Pricing Analysis
- Market Share Analysis, 2025
- By Product
- By Seating Capacity
- By Golf Cart Type
- By Sales Channel
- By End Use
- By Battery Type
- By Vehicle Design
- ASEAN
- Pricing Analysis
- Market Share Analysis, 2025
- By Product
- By Seating Capacity
- By Golf Cart Type
- By Sales Channel
- By End Use
- By Battery Type
- By Vehicle Design
- Australia and New Zealand
- Pricing Analysis
- Market Share Analysis, 2025
- By Product
- By Seating Capacity
- By Golf Cart Type
- By Sales Channel
- By End Use
- By Battery Type
- By Vehicle Design
- China
- Pricing Analysis
- Market Share Analysis, 2025
- By Product
- By Seating Capacity
- By Golf Cart Type
- By Sales Channel
- By End Use
- By Battery Type
- By Vehicle Design
- Japan
- Pricing Analysis
- Market Share Analysis, 2025
- By Product
- By Seating Capacity
- By Golf Cart Type
- By Sales Channel
- By End Use
- By Battery Type
- By Vehicle Design
- South Korea
- Pricing Analysis
- Market Share Analysis, 2025
- By Product
- By Seating Capacity
- By Golf Cart Type
- By Sales Channel
- By End Use
- By Battery Type
- By Vehicle Design
- Poland
- Pricing Analysis
- Market Share Analysis, 2025
- By Product
- By Seating Capacity
- By Golf Cart Type
- By Sales Channel
- By End Use
- By Battery Type
- By Vehicle Design
- Hungary
- Pricing Analysis
- Market Share Analysis, 2025
- By Product
- By Seating Capacity
- By Golf Cart Type
- By Sales Channel
- By End Use
- By Battery Type
- By Vehicle Design
- South Africa
- Pricing Analysis
- Market Share Analysis, 2025
- By Product
- By Seating Capacity
- By Golf Cart Type
- By Sales Channel
- By End Use
- By Battery Type
- By Vehicle Design
- United States
- Market Structure Analysis
- Competition Dashboard
- Competition Benchmarking
- Market Share Analysis of Top Players
- By Regional
- By Product
- By Seating Capacity
- By Golf Cart Type
- By Sales Channel
- By End Use
- By Battery Type
- By Vehicle Design
- Emerging Startups
- Innovation Benchmarking
- Competition Analysis
- Competition Deep Dive
- Club Car LLC
- Overview
- Product Portfolio
- Profitability by Market Segments
- Sales Footprint
- Strategy Overview
- Marketing Strategy
- Product Strategy
- Channel Strategy
- Yamaha Golf-Car Company
- Textron Specialized Vehicles
- Columbia Vehicle Group
- Garia A/S
- Maini Materials Movement
- Xiamen Dalle Electric Car
- Xiamen Dalle Electric Car Co. Ltd.
- Maini Materials Movement Pvt. Ltd.
- Marshell Green Power Co. Ltd.
- Cruise Car Inc.
- Polaris Inc.
- Club Car LLC
- Case Studies
- Success Stories
- Recent Developments
- Competition Deep Dive
- Assumptions & Acronyms Used


